Abstract
Persistent/latent viral infections of insect cells are a prominent though poorly understood phenomenon. In this study, the long-term association between the Hz-1 virus and insect host cells, conventionally referred to as persistent viral infection, is described. With the aid of a newly developed fluorescent cell-labeling system, we found that productive viral replication occurs by spontaneous viral reactivation in fewer than 0.2% of persistently infected cell lines over a 5-day period. Once viral reactivation takes place, the host cell dies. The persistently infected cells contain various amounts of viral DNA, and, in an extreme case, up to 16% of the total DNA isolated from infected cells could be of viral origin. Both pulsed-field gel electrophoresis and in situ hybridization experiments showed that some of these viral DNA molecules are inserted into the host chromosomes but that the rest of viral DNA copies are free from host chromosomes. Thus, Hz-1 virus is the first nonretroviral insect virus known to insert its genome into the host chromosome during the infection process. These data also suggest that the previously described persistent infection of Hz-1 virus in insect cells should be more accurately referred to as latent viral infection.
Persistent/latent viral infection is a long-term association between a host cell and a virus. It has been recognized to occur in insects since the last century, and depending upon external conditions, this chronic course will often change suddenly into an active or acute infection (36). Today, although viral persistence has been speculated to occur with many different viruses, little is known about the associations between these viruses and their hosts during their long quiescent periods (9, 25, 36). In this study, Hz-1 virus (also termed Hz-1 baculovirus, Hz-1V, and HzV-1) was used to elucidate the association and physical status of a persistent viral infection in insect host cells. Hz-1 virus was formerly recognized as the type species of the subfamily Nudibaculoviridae of the family Baculoviridae (43). More recently it and other nonoccluded baculoviruses have been removed from the baculovirus family, and they are currently unclassified (41).
The long-term association between Hz-1 virus and host cells is generally referred to as persistent viral infection. Hz-1 virus was identified by Granados and coworkers in 1978 (22) as a persistent infecting baculovirus agent in the IMC-Hz-1 ovarian cell line. It is an enveloped, nonoccluded, rod-shaped virus that contains a double-stranded circular 228-kb DNA genome (12, 24). The virus particles are usually heterogeneous in length according to examination by electron microscopy. Following plaque purification under conditions of productive infections, virus particles that are homogeneous in length can be purified (8, 12).
Electron microscopic examination of the purified homogeneous virus particles (referred to as standard virus) indicates that the mean particle length is 414 nm. However, after several serial, high-multiplicity passages of standard virus, the amount of defective interfering particles increases significantly (8). The length of the defective interfering particles is variable, and they are generally shorter than standard particles. This may be due to deletions in the standard viral genome (8, 12). Later, it was found that persistently infected cell lines could be established from the few viable cells remaining after acute infections (9, 12, 13, 28). Subcultures of the established persistently infected cell lines may release infectious viruses into the medium (9, 32, 37). Nevertheless, since cells persistently infected with Hz-1 virus look normal and grow well, it is not known if virus particles are released from a small portion of cells that were spontaneously reactivated or from all cells but with relatively low virus yields per cell (44).
The host range of Hz-1 virus is broad. Insect cell lines from seven lepidopterans, including Trichoplusia ni (TN368), Spodoptera frugiperda (IPLB-SF-212), Heliothis zea (IPLB-1075), Mamestra brassicae, Porthetria dispar (IPLB-65Z), Lymantria dispar (LD252Y), and Heliothis virescens (BCIRL-HB-AM1) are susceptible to Hz-1 virus infection (44). Persistent Hz-1 virus infections have been established in three of these insect lines: H. zea, T. ni, and S. frugiperda (12, 13, 22, 44). Once host cells are persistently infected with Hz-1 virus, they are resistant to superinfection with the same virus (9), and such homologous interference occurs simultaneously with the induction of cellular apoptosis upon viral challenge (28). Further experiments showed that apoptosis can be blocked by the p35 gene (16) derived from Autographa californica multiple nuclear polyhedrosis virus (AcMNPV) and that homologous viral interference results either from a mechanism upstream from the function of the p35 gene or from a mechanism other than apoptosis induction (29).
Previously, differential Hz-1 viral transcriptions under conditions of productive and persistent infections were reported. During productive viral infections, more than 100 transcripts are detected, whereas only a single viral transcript, the persistence-associated transcript 1 (PAT1), has been detected during persistent viral infections (13). This provides an opportunity for the study of the mechanisms of differential viral gene expression during both viral infection cycles in insect cells. Currently, the physical status and the associations of the Hz-1 virus with persistently infected insect cells are still largely unknown. In this study, we have developed a novel technique to study the rate and status of viral reactivation. We have also applied pulsed-field gel electrophoresis (PFGE) and in situ hybridization techniques to analyze the physical status of viral genomes in persistently infected cells. Our results clearly show that some of the viral genomes do insert into the host chromosome, and this suggests that persistent Hz-1 viral infection should be more accurately referred to as latent viral infection.
MATERIALS AND METHODS
Cells and viruses.
The T. ni (TN368) and S. frugiperda (SF21AE and SF9) cell lines were maintained at 26°C in a modified TNM-FH medium as described by Burand et al. (8) and Chao et al. (12). Standard Hz-1 virus was derived by plaque purification with SF21 cells (8). Persistently infected cell lines TNP1, TNP2, TNP3, SFP2, and SFP4 were derived from serial high-multiplicity (multiplicity of infection [MOI] = 10) passages of the standard virus by the procedures of Burand and Wood (10). The TNP1, TNP2, and TNP3 cell lines were derived from TN368 cells, and the SFP2 and SFP4 cell lines were derived from SF21AE and SF9 cells, respectively.
Assays of viral release from fluorescence-labeled persistently infected cells.
The cell membranes of persistently infected cells were first labeled with CellTracker CM-DiI (Molecular Probes). CellTracker CM-DiI is a fluorescent carbocyanine dye which specifically stains the membranes of cells without obvious diffusion to the medium or other cells, as reported by the manufacturer’s instruction manual. We found that the fluorescent dye persists on insect cells for at least 5 days without any adverse effects on cell growth or on the process of reactivation of persistently infected viruses (data not shown).
A stock solution of CellTracker CM-DiI was resuspended in dimethyl sulfoxide at 10 mg/ml. The loading solution was diluted in serum-free TNM-FH medium at a concentration of 5 mM. TNP3 cells were labeled by incubation in loading solution for 5 min at room temperature and then for an additional 15 min at 4°C. After exposure to the dye, cells were pelleted twice at 800 × g for 10 min and washed with serum-free TNM-FH medium to remove residual dye.
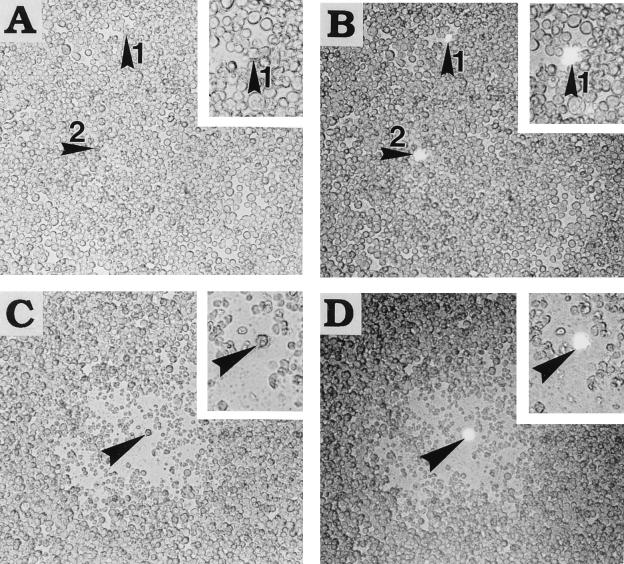
The assays were then performed as follows. Persistently infected cells (102 to 105 per well) were plated onto a lawn of healthy cells (105 per well) in 24-well plates. By calculating the number of seeded fluorescence-emitting persistently infected cells and the final number of plaques formed in the healthy lawn cells, the percentages of persistently infected cells which released viruses could be calculated. That is, if any of the virus-releasing persistently infected cells remain intact and divide, a colony of persistently infected cells should appear in the center of the plaque; if the cells lyse or stop growing during the release of viruses, a single fluorescence-labeled cell should be found at the center of the plaque.
Southern and Northern analyses.
Total cellular and viral DNAs were purified as previously described (12, 13). Purified DNAs were digested with restriction enzyme EcoRI and fractionated by electrophoresis through a 0.8% agarose gel for 44 h at 3 V/cm. After ethidium bromide staining and photography under short-wavelength illumination, the DNA was transferred to a GeneScreen filter (Dupont), hybridized with 32P-random-primer-labeled standard viral DNA, and autoradiographed. Northern hybridizations were performed as described previously (13). Briefly, samples containing 3 μg of total RNAs extracted from healthy and persistently infected cells were treated with glyoxal and fractionated through a 1% agarose gel. After blotting, the filter was hybridized with a 32P-random-primer-labeled probe prepared from subfragment D of the viral EcoRI-M fragment (13). For these experiments all of the persistently infected cells were assayed at passages 200 to 230, except SFP4 cells were used at passage 30.
Slot hybridizations.
Total genomic DNAs were purified from healthy (TN368 and SF21AE) and persistently infected (TNP1, TNP2, TNP3, and SFP2) cell lines and transferred to the GeneScreen filter by using MilliBlot (Millipore) according to the manufacturer’s instructions. The filter was hybridized with the 32P-labeled standard viral DNA, followed by autoradiography.
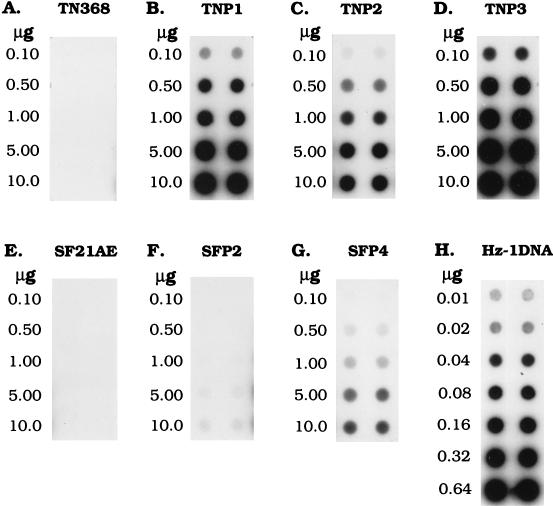
The blots were then scanned with a PhosphorImager (Molecular Dynamics), and the percentage of viral DNA content was determined by interpolating data into a standard curve obtained with known amounts of viral DNA ranging from 0.01 to 0.64 μg (see Fig. 4H). The copy number of viral DNA per cell was calculated as follows. (i) Total DNA was purified from 105 cells and measured with a spectrophotometer (Hitachi model U-1100). The average amount of total DNA per cell was calculated by dividing the total measured DNA by 105 for six independent experiments. (ii) The amount of viral DNA per cell (micrograms) was calculated as amount of total DNA per cell (micrograms) × percentage of viral DNA. (iii) The weight of a single viral DNA was calculated as follows: (228 × 103 × 660 × 106) (micrograms)/(6.02 × 1023) = 2.50 × 10⁻¹⁰ μg. In this equation, 228 kb is the size of viral DNA, 660 × 106 is the molecular weight of paired nucleotides, and 6.02 × 10²³ is Avogadro’s number. (iv) The copy number of viral DNA was derived as follows: total weight of viral DNA per cell/2.50 × 10−10 μg = viral copy number per cell.
FIG. 4.
Autoradiogram of a dot blot hybridization to calculate the percentage of viral DNA in persistently infected cells. The indicated amounts of total DNA extracted from two parental and five persistently infected cell lines were dot blotted onto filters and hybridized with 32P-labeled viral genomic DNA. The indicated amounts of Hz-1 viral DNA were also dot blotted onto filters and hybridized simultaneously to serve as standards for the calibration of viral DNA in different cell samples. The two lanes for each DNA species represent duplicate samples.
PFGE analyses.
Healthy or persistently infected TN368 and SF cell lines (2 × 10⁷ cells) were mixed with equal volumes of 1% low-melting-point agarose prepared in phosphate-buffered saline (PBS) and cooled to 45°C. These samples were then transferred to plug molds with a pipette and allowed to harden at 4°C. Sample blocks were transferred to Eppendorf tubes which contained 3 to 5 volumes of 0.5 M EDTA (pH 9)–1% sarcosyl–0.5 mg of proteinase K per ml. These blocks were digested for 1 to 2 days at 50°C with constant, gentle shaking. After digestion with SmaI or NotI restriction enzyme, PFGE was carried out with a CHEF-DRII pulsed-field electrophoresis system (Bio-Rad Laboratories) in a 1% agarose gel with 0.5× TBE buffer (40 mM Tris-borate, 1 mM EDTA) at 200 V with a switch time of 60 s for 15 h followed by a switch time of 90 s for 8 h at 14°C. The gel was stained in water containing 0.5 μg of ethidium bromide per ml and photographed under short-wavelength UV illumination. The gels were transferred to a GeneScreen filter (Du Pont), hybridized with 32P-labeled standard viral DNA, and autoradiographed. In these experiments, TNP1, TNP2, and TNP3, and SFP2 cells were assayed at passages 200 to 230, and SFP4 cells were assayed at passage 30.
Chromosomal fluorescence in situ hybridization.
For fluorescence in situ hybridization of viral DNA in persistently infected cells, an RNA probe was made as follows. A 0.3-kb HincII subfragment derived from HindIII-K of the viral genome (12) was cloned into plasmid pBluescript KSM(+) (Stratagene Cloning Systems), and a 0.3-kb RNA probe labeled with digoxigenin-11-UTP was produced from this plasmid by in vitro transcription with T3 RNA polymerase (Boehringer Mannheim).
Chromosomes were prepared by a modification of the method used by Delecluse et. al. (18). TN368 or TNP3 cells (at passages 200 to 230) were synchronized by incubation in an excess of thymidine (0.5 μg/ml) for 12 h. After two washings in TNM-FH medium, Colcemid (2.5 μg/ml; Sigma) was added 1 h before harvesting. The cells were treated with 0.06 M KCl for 6 min for swelling and were then fixed in ethanol-acetic acid (3:1). One drop each of cell suspension was allowed to fall from a height of 150 to 160 cm onto dry, 70% ethanol-cleaned slides. After cell spreading, slides were kept at −70°C until hybridization.
Slides were dehydrated in ethanol of increasing concentrations (70, 80, 90, and 100%). Chromosomes were denatured by incubation in 2× SSC (1× SSC is 0.15 M NaCl plus 0.015 M sodium citrate)–70% formamide (pH 7.0) for 2 min at 70°C. After being rinsed for 2 min in 2× SSC, slides were dehydrated as described above. Labeled RNA probes diluted in hybridization buffer (2× SSC, 5% dextran sulfate, 0.2% bovine serum albumin, and 50% formamide) were then denatured at 75°C for 5 min and chilled on ice. The buffer containing the RNA probes was then placed on the slide, and both AmpliCover Discs and AmpliCover Clips were reassembled according to instructions of the manufacturer (Perkin-Elmer). For hybridization, slides were placed at 40°C overnight in a GeneAmp In Situ PCR System 1000 thermal cycler (Perkin-Elmer) without PCR amplification. After hybridization, the slides were washed four times for 5 min each in 2× SSC–50% formamide at 60°C and three times for 10 min each in 1× SSC at 42°C. For the detection of the labeled probe, slides were incubated with PBS containing 0.3% Triton X-100 for 5 min and blocked for 30 min with 10% fetal bovine serum in PBS containing 0.3% Triton X-100. Subsequently, the slides were incubated with 0.4 μg of fluorescein-conjugated antidigoxigenin antibodies per ml diluted in 0.3% Triton X-100 in PBS at room temperature for 1 h and then washed in three changes of 0.3% Triton X-100 in PBS. Finally, slides were incubated in PBS containing 0.5 μg of propidium iodide (Molecular Probes) per ml for 5 min and washed briefly with PBS.
Electron microscopy.
SF9 cells at 17 h postinoculation with Hz-1 virus as well as TN368 and TNP3 persistently infected cells (106; at passages 200 to 230) were harvested and washed in 0.1 M sodium cacodylate buffer (pH 7.2). The cell pellets were fixed for 1 h with a mixture of 4% paraformaldehyde and 0.2% glutaraldehyde in 0.1 M sodium cacodylate buffer at 4°C and then postfixed for 1 h with buffered 1% osmium tetroxide at 4°C. After dehydration in a sequential ethanol series, the cells were infiltrated and embedded in LR white. Ultrathin sections were stained for 30 min in uranyl acetate and for 5 min in lead citrate. Grids were examined with an EM902 (Zeiss) electron microscope. Productively infected SF9 cells were also harvested at 17 h after viral infection (MOI = 5) and treated by the same procedure described above to show the size and morphology of viral particles under the same electron microscopic conditions.
RESULTS
Mature, infectious viruses are produced in only a small proportion of low-passage, persistently infected cells.
When five low-passage (passage 30) persistently infected cell lines, TNP1, TNP2, TNP3, SFP2, and SFP4, were analyzed, infectious viruses could be detected in the media; however, no infectious viruses were detected in any of the persistently infected cell lines after passage 200 (Table 1). Although newly established persistently infected cells produced viruses when seeded onto healthy cells as described in Materials and Methods, very few plaques were produced from all lines, ranging from 21 plaques/105 cells for TNP3 and SFP2 cells to 210 plaques/105 cells for TNP1 cells (Table 1). These results clearly show that within 5 days, the time needed for plaque formation, fewer than 0.2% of the persistently infected cells tested produced virus. However, plaques were generated by the viruses released from a small percentage of persistently infected cell lines, suggesting that mature, infectious viruses were indeed generated from these cells.
TABLE 1.
Characteristics of cells persistently infected by Hz-1 virus
| Cell line | Spontaneous reactivationa at passage:
|
Titer of virusb at passage:
|
Viral DNA content in host cells
|
PAT1 expression | Viral interferencec
|
||||
|---|---|---|---|---|---|---|---|---|---|
| 30 | 200–230 | 30 | 200–230 | % | Copies of viral genome/cell | Hz-1 virus | AcMNPV | ||
| TNP1 | 210 ± 90 | 0 | 8.2 × 10⁴ | 0 | 5.3 | 1,686 | +++ | Strong | None |
| TNP2 | 32 ± 8 | 0 | 4.4 × 10³ | 0 | 2.1 | 342 | + | Strong | None |
| TNP3 | 21 ± 6 | 0 | 2.6 × 10³ | 0 | 16.5 | 2,436 | ++ | Strong | None |
| SFP2 | 21 ± 8 | 0 | 1.4 × 10² | 0 | 0.12 | 20 | + | Strong | None |
| SFP4 | 81 ± 11 | NDd | 5.2 × 10³ | ND | 0.66 | 145 | ++++ | Strong | None |
Number of persistently infected cells undergoing spontaneous reactivation per 105 cells. SFP4, a newly established persistently infected cell line, was assayed only at passage 30. Results are means and standard deviations.
Titers of virus (PFU per milliliter per 48 h) released into the media.
After challenge by Hz-1 virus or AcMNPV, the titer of the released virus was estimated as a reference for the occurrence of viral interference.
ND, not done.
An interesting finding came from examination of the center of the plaque (Fig. 1). With use of the membrane-binding fluorescent dye CellTracker CM-DiI system to label and observe the persistently infected cells, the centers of all plaques contained a fluorescence-labeled cell that originated from the input of the persistently infected cell (Fig. 1C and D). No patches of persistently infected cells were observed, indicating that the persistently infected cells died or stopped growing upon the release of viral particles and that the resulting progeny virus initiated a productive infection in the surrounding control cells. In areas where viral plaques did not develop, the fluorescence-labeled persistently infected cells were found to be surrounded by the lawn of healthy control cells (Fig. 1A and B), suggesting that viruses were not released.
FIG. 1.
Focus-forming assay with fluorescently labeled, persistently infected cells. Fluorescence-labeled persistently infected TNP3 cells were mixed with healthy SF21AE cells. (A and C) Photographs taken with visible light; (B and D) photographs taken with a combination of visible and 530-nm excitation lights. (A and B) Cells taken from the same region, where plaques were not observed. In these regions, both healthy lawn SF21AE cells and labeled TNP3 cells (arrowheads) grew together without any sign of viral infection. A higher magnification of the labeled TNP3 cell is shown in the inset. (C and D) Plaque generated in a lawn of SF21AE cells following the release of viral progeny from a persistently infected TNP3 cell. The TNP3 cell (arrowhead) at the center of the plaque is also shown at a higher magnification in the insets.
All persistently infected cells express PAT1 and are highly resistant to superinfection.
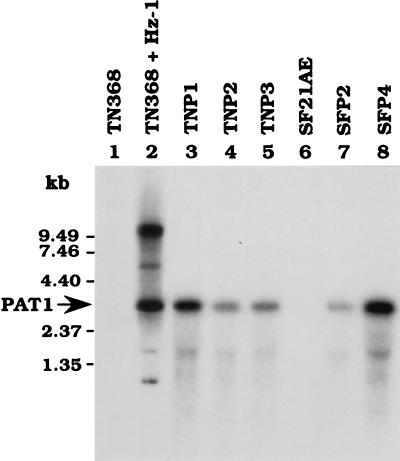
Total RNA was extracted from persistently infected cells and fractionated by agarose gel electrophoresis. After Northern blot hybridization, the PAT1 RNA, previously reported to be the only detectable persistence-associated transcript (11, 13), was found in all persistently infected cells. PAT1 was expressed more strongly in TNP1 and SFP4 cells than in TNP2, TNP3, and SFP2 cells (Fig. 2). We found that the intensity of PAT1 expression was higher in newly established SFP4 cells (passage 30) than in long-passaged persistently infected cells (passages 200 to 230). Currently it is not known if this is because of cell line variation or because a newly established persistently infected cell line usually tends to more strongly express PAT1 (29).
FIG. 2.
Detection of PAT1 expression in persistently infected cells. Total RNA was extracted from healthy (TN368 and SF21AE), productively infected (TN368 + Hz-1), and persistently infected (TNP1, TNP2, TNP3, SFP2, and SFP4) cells. The expression of PAT1 was detected by Northern hybridization with a 32P-labeled subfragment D of the viral EcoRI-M fragment, by which PAT1 is encoded (13), as a probe.
Previously, by using probes which can hybridize to PAT1, two viral gene expression patterns were observed. If the cells were persistently infected by Hz-1 virus, PAT1 was the only virus-specific transcript found; however, at least two additional transcripts other than PAT1, of 6.6 kb and >9.5 kb, were found if the cells were productively infected (13) (Fig. 2, lane 2). In the present experiment, bands other than PAT1 were not detected in the TNP1, TNP2, TNP3, SFP2, and SFP4 cell lines (Fig. 2), indicating that they were truly persistently infected cells.
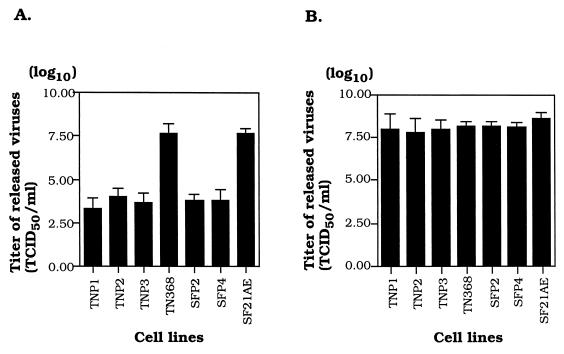
When a host cell is persistently infected with a virus, it often becomes resistant to challenge by the same or different viruses, a phenomenon known as homologous (resistant to the same virus) or heterologous (resistant to different viruses) interference (1, 2, 4, 17, 27, 38). Cells persistently infected with Hz-1 virus were challenged with Hz-1 virus and AcMNPV; the latter is the best-studied baculovirus (43). The results showed that all cells persistently infected with Hz-1 virus were resistant to superinfection by the same virus. The difference in the abilities of parental (TN368 and SF21) and persistently infected cells to produce viral progeny was about 3 to 4 orders of magnitude (Fig. 3A and Table 1). However, all of these cells persistently infected with Hz-1 virus were not significantly resistant to challenge by AcMNPV, as determined by comparing the viral progeny produced in parental and persistently infected cells (Fig. 3B and Table 1). These studies revealed that these five cell lines consist of typical persistently infected cells.
FIG. 3.
Viral interference assay of parental and persistently infected cells. Parental and persistently infected cells were challenged with either Hz-1 virus (A) or AcMNPV (B) at an MOI of 0.1. TN368 and SF21AE cells are healthy parental cells and serve as controls for viral infection. At 72 h postinfection, the titers of the viruses released into the media by the infection in two parental and five persistently infected cell lines were assayed. Data (means ± standard deviations) were collected from three sets of experiments with three independent analyses of the 50% tissue culture infective dose (TCID50).
High DNA content and coexistence of standard viral genomes and viral genomes with deletions in persistently infected cells.
The viral DNA contents of the persistently infected cell lines were determined by slot blot hybridization. Total DNA was purified from the TNP1, TNP2, TNP3, SFP2, and SFP4 cell lines. Increasing amounts of total cellular DNAs and standard viral genomic DNAs were slot blotted onto a nylon filter and hybridized with 32P-labeled viral genomic DNA for Southern blot analysis. The results showed that the percentages of viral DNAs in TNP1, TNP2, TNP3, SFP2, and SFP4 cells were 5.3, 2.1, 16.5, 0.12, and 0.66%, respectively (Fig. 4 and Table 1).
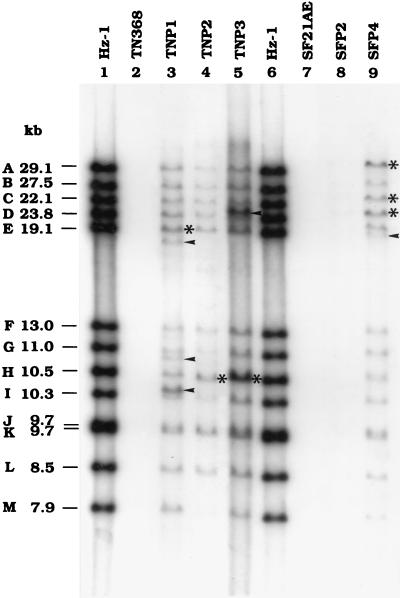
The viral DNA contained in these five cell lines was further analyzed. Total DNA purified from these persistently infected cell lines was digested with EcoRI and fractionated through an agarose gel. Digested DNA was transferred to a filter and hybridized with a 32P-labeled viral genomic DNA probe for Southern blot analysis. The data (Fig. 5) show that viral DNAs from the persistently infected cell lines contained most of the restriction enzyme fragments present in the standard viral genome. However, all of the lanes contained additional and multimolar DNA fragments (Fig. 5), indicating the possibility of deletions (9, 12) and duplications in certain regions of the viral genome, or integration into host DNA, under conditions of persistent infection.
FIG. 5.
Autoradiogram of Southern blots of viral and cellular genomic DNAs. Total genomic DNAs of parental and persistently infected cells were digested with the restriction enzyme EcoRI. After fractionation through an agarose gel, genomic DNAs were blotted onto a filter and then hybridized with a viral genomic DNA probe. Arrowheads indicate extra fragments, and asterisks indicate multimolar bands which were detected from the viral genome of persistently infected cells. Hz-1, EcoRI-digested standard viral DNA.
PFGE analysis of the physical state of the viral genome in persistently infected cells.
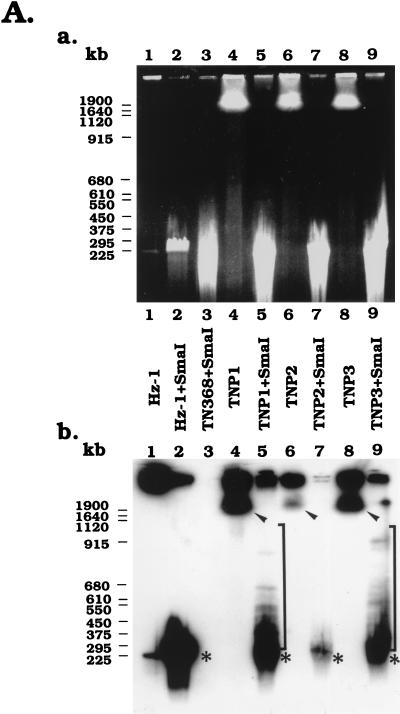
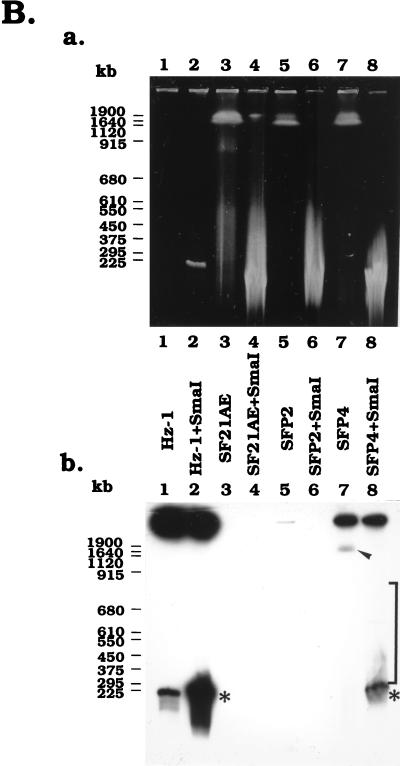
DNA samples from viral particles and different persistently infected cells were prepared in low-gelling-temperature agarose. The DNAs were separately incubated with and without two restriction enzymes, SmaI (for which Hz-1 viral DNA has only one recognition site) and NotI (for which Hz-1 viral DNA has no recognition site) (12). After restriction digestion, the samples were loaded onto the gel. Based on ethidium bromide staining results, the majority of viral DNAs remained in the well prior to SmaI digestion (Figs. 6A and B, panels a, lanes 1). Following SmaI digestion, a single-species DNA of about 228 kb migrated into the gels (Fig. 6A and B, panels a, lanes 2). By Southern hybridization analysis, the viral DNA was detected primarily in the wells prior to SmaI digestion; however, a small amount of viral DNA with a size of about 228 kb was detected (Fig. 6A and B, panels b, lanes 1). This minor 228-kb viral DNA may have resulted from nicking of some of the viral genomes during sample preparation. After SmaI digestion, the majority of DNA isolated from viral particles was converted to 228-kb linear molecules (Figs. 6A and B, panels b, lanes 2). A portion of the viral DNA remained at the origin, presumably representing viral genomes whose protein coats were not completely digested by proteinase K during sample preparation and were thus trapped in the sample wells.
FIG. 6.
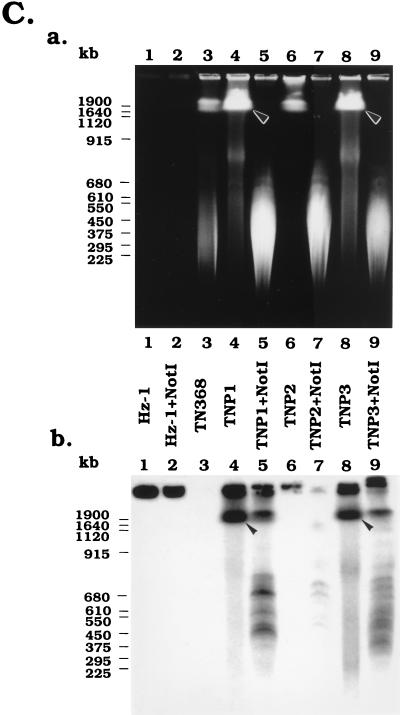
PFGE analysis of the physical status of viral genomes in persistently infected TN and SF cells. (A and C) Analysis of DNA isolated from persistently infected TNP1, TNP2, and TNP3 cells, TN368 control cells, and Hz-1 virions with and without SmaI (A) and NotI (C) restriction enzyme digestion. (B) Analysis of DNA isolated from persistently infected SFP2 and SFP4 cells, SF21AE control cells, and Hz-1 virions with and without SmaI restriction enzyme digestion. Panels a, ethidium bromide-stained electrophoreograms; panels b, Southern analyses of panels a probed with 32P-labeled genomic DNA of Hz-1 virus. Brackets, regions of autoradiograms containing viral DNA sequences larger than the linearized viral genome; arrowheads, positions of DNA molecules larger than 1 Mb; asterisks, positions of the linearized unit viral genome.
Total cellular DNAs from parental control and persistently infected cell lines were subjected to PFGE analyses before and after SmaI digestion (Fig. 6A and B). The ethidium bromide staining data with SmaI-digested TN368 (Fig. 6A, panel a, lane 3) and undigested SF21AE (Fig. 6B, panel a, lane 3) and TN368 (Fig. 6C, panel a, lane 3) DNA samples were similar to the data from the respective digested or undigested persistently infected cell lines. However, unlike the case for the persistently infected cells, these parental control samples did not hybridize with the labeled viral DNA probes, thereby providing a negative control (Fig. 6, panels a, lanes 3).
Prior to SmaI digestion, the total DNA samples from the persistently infected TNP1, TNP2, TNP3, SFP2, and SFP4 cells each exhibited two Southern hybridization signals. One was in the wells and the other was in the region larger than 1 Mb (Fig. 6A, panel b, lanes 4, 6, and 8, and B, panel b, lane 7). When the persistently infected total DNAs were digested with SmaI (Fig. 6A and B, panels a), the viral signals in the wells were greatly reduced and the signals in the regions larger than 1 Mb disappeared. Major new signals in the 228-kb region appeared for SmaI-digested DNAs (Fig. 6A, panel b, lanes 5, 7, and 9, and 6B, panel b, lane 8). Viral signals were weak in SFP2 cells and thus not clearly detectable (Fig. 6B, panel b, lane 6). Above those virus-specific bands, multiple fragments with sizes ranging from 300 to 900 kb were observed (Fig. 6A, panel b, lanes 5, 7, and 9, and B, panel b, lane 8). These DNA fragments were larger than the unit length of the viral genomic DNA (228 kb) and likely resulted from the insertion of viral DNA into the host genome.
The persistently infected TNP1, TNP2, and TNP3 cells were further digested with NotI, an enzyme which does not have a recognition site in the Hz-1 viral genome (12). All of the viral DNAs derived from purified virus stayed in the wells, with or without NotI digestion (Fig. 6C, lanes 1 and 2). Prior to NotI digestion of total DNA derived from persistently infected cells, Southern hybridization identified two bands, one in the sample wells and the other in a region comigrating with host chromosomal DNA (larger than 1 Mb) (Fig. 6C, panel b, lanes 4 and 8). These viral signals were not found with parental cellular DNAs (Fig. 6C, panel b, lane 3). The viral signal which comigrated with the cellular DNA was not clearly visible with the chromosomal DNA derived from TNP2 (Fig. 6C, panel b, lane 6), probably due to the relatively low viral DNA content in this cell line.
The host chromosomal DNAs derived from persistently infected TN368 cells were then digested with NotI. Figure 6C shows that the digestion was nearly complete, because the vast majority of chromosomal DNAs which migrated only short distances into the gel (Fig. 6C, panel a, lanes 4, 6, and 8) were removed to become DNA molecules with relatively lower molecular sizes as revealed by ethidium bromide staining (Fig. 6C, panel a, lanes 5, 7, and 9). Southern blot analysis of the NotI-digested DNA from persistently infected cells showed that a large proportion of the DNA containing viral sequences that comigrated with undigested host chromosomal DNAs (Fig. 6C, panel b) was digested with NotI and migrated to lower-molecular-size regions. However, unlike the pattern resulting from SmaI digestion, the major unit-length (228-kb) viral DNA bands were absent from the gel. Since the viral genome contains no recognition sites for NotI, the existence of viral signals in a broad region with molecular sizes ranging from about 228 kb to >1.9 Mb indicates that these viral DNAs were more likely to be inserted into chromosomes of the persistently infected host cells. These large-DNA signals are also unlikely to be those of free concatemaric viral genomes, because they could be digested by NotI and, in addition, large circular concatemers were shown to stay in the wells during PFGE.
Chromosomal in situ hybridization analysis further reveals the existence of both chromosomally inserted and free viral DNAs in persistently infected cells.
In order to further verify the physical status of the viral genomes in the nuclei of persistently infected cells, chromosomal in situ hybridization was performed. Persistently infected TNP3 cells were fluorescence in situ hybridized by using a probe derived from the HindIII-K region of the viral genome (12). The probe was labeled with fluorescein isothiocyanate-conjugated antibody, which resulted in a green color, whereas the host chromosomes were stained with propidium iodide, which resulted in a red color. When signals of the viral genome overlapped with those of host chromosomes, they turned yellow.
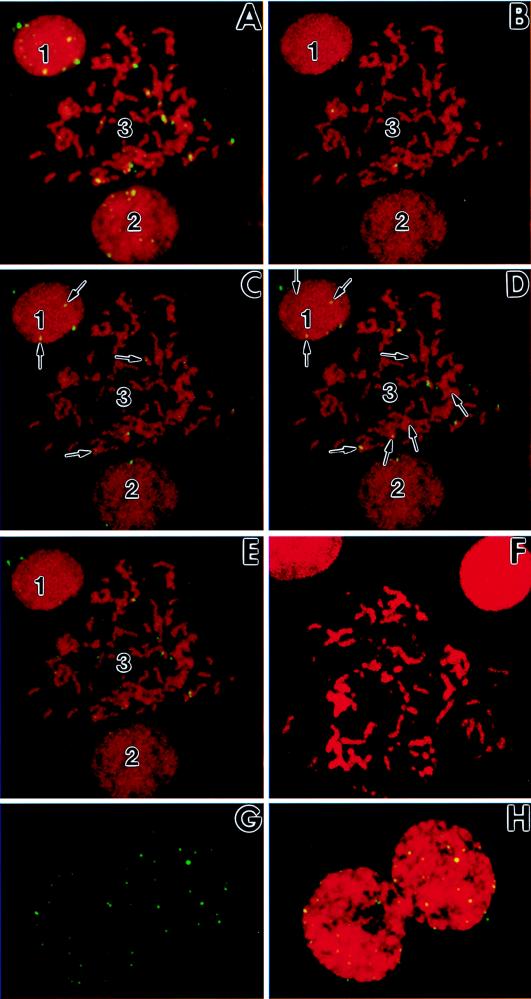
The results of in situ hybridization are shown in Fig. 7. Both green and yellow signals could be detected in cells where host chromosomes were not condensed, and thus the nucleus still existed in a well-defined rounded region (Fig. 7A, nuclei 1 and 2). Some green signals clearly existed outside, but close to, the chromosomal mass, revealing that they were likely episomal viral genomes. Several green or yellow signals were much larger than the other signals, suggesting that they were clusters of viral genomes. Many signals overlapped with the chromatin or chromosome regions and thus became yellowish. Two possibilities exist for these yellow signals. They either reflected viral DNAs that inserted into the host chromosomes or were viral DNAs that located on the top or bottom of the chromosomes. To explore these two possibilities, cells with a well-spread, condensed chromosomes were examined (Fig. 7A, nucleus 3). Many viral genomic signals were visualized as yellow and coincided well with the condensed host chromosomes. Thus, these yellow signals likely represented inserted viral DNA sequences in the host chromosomes, while those visualized in green were either inserted DNA or episomes.
FIG. 7.
Genomic analysis of Hz-1 virus by in situ hybridization with persistently infected TNP3 cells. Genomic signals of Hz-1 virus were detected in interphase (nuclei 1 and 2) and mitotic (nucleus 3) cellular chromosomes. The metaphase spread was counterstained with propidium iodide to outline chromosome morphology (red). The probe derived from the viral genomic DNA was labeled with fluorescein isothiocyanate-conjugated antibody, which resulted in a green color; the overlapping of the viral signal and host chromosome produced a yellow color. (A) Original unprocessed image. (B to E) Series of digitized images of the host chromosomes obtained by optical sectioning (z-axis spacing = 1 μm). Arrows indicate those viral signals which were detectable only in middle sections (C and D) and were thus embedded inside the host chromosomes. (F) In situ hybridization of interphase and mitotic chromosomes of healthy TN368 cells with the same viral probe as negative controls. (G and H) In situ hybridization of dividing TNP3 nuclei, showing equal viral DNA signals associated with the newly divided daughter chromosomes. (G) Viral signals only; (H) dual images of viral signals and propidium iodide-stained nuclei.
In order to further confirm whether viral DNAs were indeed inserted into the host genome, tightly condensed host chromosomes during metaphase were examined with a confocal microscope through optical sections (top [Fig. 7B], middle [Fig. 7C and D] and bottom [Fig. 7E] sections). Yellow signals that appeared only in middle sections (Fig. 7C and D) were examined. Although in nuclei 1 and 2 some yellow signals were observed only in the middle sections, this was merely weak evidence for viral insertion in the host genomes, because these were interphase cells and thus contained a relatively loose chromosomal structure. However, in the tightly condensed nucleus 3 of a mitotic cell, some viral signals were observed only in the middle sections (Fig. 7C and D), suggesting that host chromosomes contained inserted viral genomes. Some of the yellow signals detectable only on the top or bottom (Fig. 7B and E) of the sections may have reflected viral episomes or inserted viral DNAs which were situated at the peripheral regions of the chromosomes.
In our study, viral genomic signals were found in every TNP3 and SFP2 cell. The nuclei of newly divided cells were examined, and it was found that fluorescent viral DNA signals were roughly evenly distributed in the nuclei of both newly divided daughter cells (Fig. 7G and H), suggesting that the replication and segregation of the viral genome were well controlled during cell division. The coordinate replication and segregation of viral genomes together with host chromosomes thus resulted in long-term association between viral genomes and persistently infected cells.
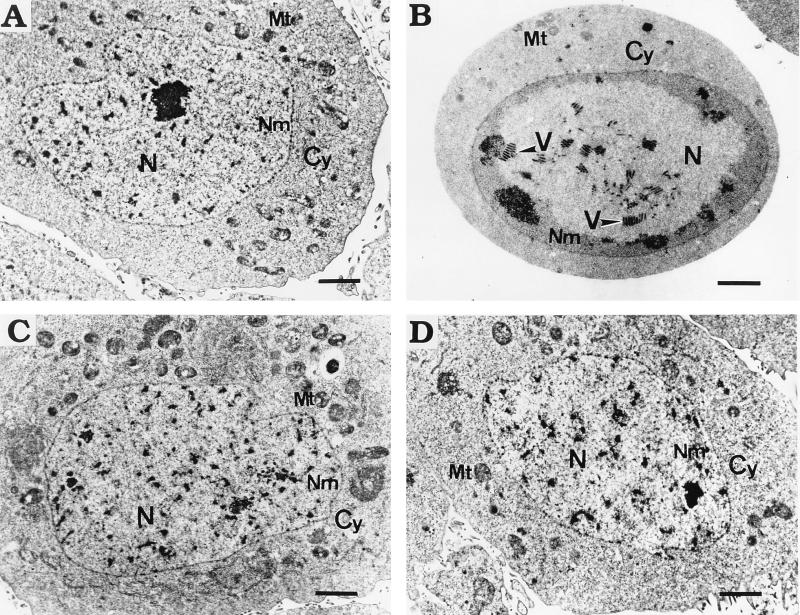
Although all cells persistently infected with Hz-1 virus contained multiple copies of the viral genome, virus particles were not detected. TNP3, the cell line with the highest viral content, was examined by electron microscopy and compared to control (Fig. 8A) and productively infected (Fig. 8B) cells. Although TNP3 contained approximately 2,400 copies of viral genomes per cell as determined by slot hybridization (Fig. 4 and Table 1) and fluorescent in situ hybridization experiments showed that all of the cells contained multiple single or clustered viral genomic DNA signals (Fig. 7 and data not shown), no viral particles were found in sections of more than 50 cells examined (Fig. 8C and D). This suggests that most, if not all, of these abundant persistent viral DNAs existed as episomes.
FIG. 8.
Electron microscopic view of cells productively and persistently infected with Hz-1 virus. (A) Uninfected TN368 cell. (B) SF9 cell productively infected with Hz-1 virus. Virus particles (V) are indicated with arrowheads. (C and D) Persistently infected TNP3 cells with no detectable virions. Nm, nuclear membrane; N, nucleus; Cy, cytoplasm; Mt, mitochondria. Bars, 2.5 μm.
DISCUSSION
In this study we demonstrated that relatively newly established cell lines persistently infected with Hz-1 virus produced virus, whereas the production of virus ceased after 200 passages. We do not rule out the possibility that viral reactivation may still occur after many passages due to physiological or environmental stimulation. In newly established cells persistently infected with Hz-1 virus, infectious virus was produced from a minor number of cells, and these cells died or stopped growing upon the release of viral progeny. This is a phenomenon very similar to that of latent herpesviruses.
Viral reactivation in herpesviruses is best studied by monitoring the appearance of the viral antigens associated with productive viral infection (6, 23, 33, 35). The infected cells used for experimentation are usually damaged from the fixation procedure necessary to detect viral antigens. As a result, whether the mature viruses are finally produced from particular reactivated cells and whether specific individual cells die or survive and become virus producers after reactivation can be elucidated only for populations of cells, not for individual cells (5, 42). By taking advantage of a viable long-term membrane-specific fluorescent dye, we designed a simple and reproducible plaque assay technique to verify the nature of viral reactivation and to examine the final fate of the cells in which virus is reactivated. It was found that during early stages of persistent infection, viral progeny were generated from only very small proportions of host cells, which is comparable to what occurs with herpesviruses (42).
Because the copy numbers of the Hz-1 viral genome are unusually high and because the genomes contain complicated genomic deletions or insertions (Fig. 5) (12), the physical status of viral DNA in persistently infected cells is an interesting yet difficult issue to study by conventional molecular biological techniques. In order to resolve these problems, PFGE techniques were applied. It has been reported that under the conditions of PFGE, circular DNA is trapped at the top of the gel; however, linear DNA is amenable to gel separation (30, 39). This explains why in the present analysis of virus particles, the intact viral DNA was trapped at the top of the gel but migrated to about the 228-kb region after SmaI digestion. Similar phenomena were also observed for the digestion of total genomic DNAs of various persistently infected cells, suggesting that circular viral DNAs may also exist in these cells. Our results show that viral DNA is inserted into the genomes of host cells due to its comigration with the host genome and the generation of fragments larger than the unit length of viral DNA after the digestion with SmaI (Fig. 6A and B). NotI digestion data (Fig. 6C) provided additional evidence for the insertion of viral DNA in the genomes of host cells. The combined results from the digestions with SmaI and NotI suggest that viral DNA exists as either circular or inserted forms. The circular viral DNA molecules may either exist as an episome or be encapsulated in the virion. However, viral particles were not visible under the electron microscope, suggesting that if viral particles exist during persistent viral infection, their numbers must be low.
The physical status of the viral genome was further studied by the fluorescent in situ hybridization of cells persistently infected with Hz-1 virus. Results similar to those from PFGE, i.e., the existence of extrachromosomal and inserted forms of viral genomes, were found. Hz-1 virus appears to be the first nonretroviral insect virus known to integrate its genome into host chromosomes during the infection process. The polyadnaviruses are unique insect viruses in that the genomic DNAs of the viruses are carried by the genomes of parasitoid wasps. These polyadenaviruses appear to be vertically transmitted within wasps, apparently as an integral part of their chromosomes (20). In mature females, the virus particles are released from the calyx cells into the oviduct lumen, either by budding or by cell lysis. Viruses are then injected with wasp eggs into parasitized insects (for a review, see reference 34). However, so far there is no evidence to suggest an active integration of the viral genome into host chromosomes of either the parasitic wasp or the parasitized lepidopteran larva through infection. Since the integration of Hz-1 viral DNA into an insect host chromosome can be achieved under laboratory conditions by viral infection, this model could serve as a useful tool for future engineering of insects or insect cells.
It was reported by Wood and Burand (44) that one of the persistently infected T. ni cell cultures contained approximately 500 viral genome copies per cell. The results of our dot blot hybridization experiments revealed that a host cell may harbor as much as 16% of the total DNA of the viral genome, and two of the T. ni cell lines, TNP1 and TNP3, contained very high numbers of viral copies (Table 1). Such a high viral DNA content could be burdensome to the T. ni host cells; however, these cells grew only slightly slower than the parental cells. Although the results of PFGE suggested that a portion of viral DNA may have been inserted into the host genome, it is still difficult to estimate how many copies of the viral DNA are inserted into the viral genome. Even if high copy numbers of viral DNA were inserted into the host genome, they may have been inserted as concatemers, thus reducing the insertion site and damage to host genomes.
Long-term association of Hz-1 virus and host cells has been referred to as persistent infection since the discovery of this virus (9, 22). In this study, we provided some new insights regarding the nature of persistent Hz-1 virus infection and found that persistent infection may not be the best terminology for describing such long-term Hz-1 virus-host associations. Persistent infections can be classified into three categories: latent, chronic, and slow infections. Latent infection is defined as the condition under which the virus is usually undetectable and intermittent acute symptoms may occur (44). Garcia-Blanco and Cullen (21) similarly proposed that latency is a reversible nonproductive infection of cells by a replication-competent virus. Latent infection of herpesviruses has also been defined as a type of persistent infection in which the viral genome is present but infectious virus is not produced except during intermittent episodes of reactivation (5, 40). Essentially the same definition was proposed by Ahmed (3). Similar to the case for herpesviruses, differential viral gene expression was observed in Hz-1 virus during productive and persistent viral infections (13). During persistent viral infection, the nuclear RNA PAT1 was the only virus-specific transcript that appeared to be expressed (11). In addition, infectious Hz-1 virus was not released during persistency unless a lytic reactivation took place (Fig. 1 and Table 1). These and many other features demonstrated in this study suggest that persistent infection of insect cells by Hz-1 virus is better referred to as latent viral infection.
Recently, Hughes et al. (25, 26) detected a low-level baculovirus infection in M. brassicae insects that resembles that of M. brassicae multiple nucleocapsid nuclear polyhedrosis virus. The virus was found to persist in the fat body and was detectable by PCR analysis or other sensitive indirect measures. In their work, viral protein was detectable and infectious viruses were present, suggesting that the occult virus may remain as a persistent infection. Further study of issues such as whether such occult baculovirus infection in insects is due to continuous viral production in every cell or is due to a reactivation of viruses in only some cells, and comparison of the molecular mechanism of persistent baculovirus infection with that of Hz-1 virus infection (11, 13), may generate important information for our understanding of persistent viral infection in insects.
Persistent/latent viral infection in insects is suspected to be a very common phenomenon naturally occurring in the field and in long-term laboratory colonies (9, 14, 15, 25, 28, 31, 36). Usually the virus can be easily detected during productive infection. However, between viral outbreaks, viruses may be harbored in insects as persistent/latent infections and be difficult to detect (7, 19). This study provided an opportunity for us to look further into virus-host associations in insect cells. An understanding of persistent/latent viral infections in insects may become useful in biological control programs. Furthermore, the Hz-1 virus has a broad host range and is easy to manipulate for both productive and latent infections in broad host cell lines in insects. Due to the general similarity of latent Hz-1 virus infection to latent infection by other viruses, i.e., differential viral gene expression, integration of viral DNA into the host genome, reactivation, and other characteristics, Hz-1 virus may be a useful tool for comparative studies of latent viral infections of vertebrates and invertebrates.
ACKNOWLEDGMENTS
Jin-Ching Lee and Chi-Long Lin contributed equally to this work.
We thank C. W. Chen for useful discussions, S. P. Lee for excellent technical assistance, and W. Chang, S. Wang, and D. Platt for critical reading of the manuscript.
This research is supported by Academia Sinica and grant NSC 88-2316-B-001-016 from the National Science Council, Taiwan, Republic of China.
REFERENCES
- 1.Abernathy E S, Wang C N, Frey T K. Effect of antiviral antibody on maintenance of long-term rubella virus persistent infection in Vero cells. J Virol. 1990;64:5183–5187. doi: 10.1128/jvi.64.10.5183-5187.1990. [DOI] [PMC free article] [PubMed] [Google Scholar]
- 2.Adams R H, Brown D T. BHK cells expressing Sindbis virus-induced homologous interference allow the translation of nonstructural genes of superinfecting virus. J Virol. 1985;54:351–357. doi: 10.1128/jvi.54.2.351-357.1985. [DOI] [PMC free article] [PubMed] [Google Scholar]
- 3.Ahmed R. Persistent viral infection. In: Webster R G, Granoff A, editors. Encyclopedia of virology. London, United Kingdom: Academic Press, Inc.; 1994. pp. 1089–1095. [Google Scholar]
- 4.Ahmed R, Stevens J G. Viral persistence. In: Field B N, Knipe D M, editors. Fields virology. 2nd ed. New York, N.Y: Raven Press; 1991. pp. 241–266. [Google Scholar]
- 5.Baichwal V R, Sugden B. Latency comes of age for herpesviruses. Cell. 1988;52:787–789. doi: 10.1016/0092-8674(88)90419-9. [DOI] [PubMed] [Google Scholar]
- 6.Bloom D C, Devi-Rao G B, Hill J M, Stevens J G, Wagner E K. Molecular analysis of herpes simplex virus type 1 during epinephrine-induced reactivation of latently infected rabbits in vivo. J Virol. 1994;68:1283–1292. doi: 10.1128/jvi.68.3.1283-1292.1994. [DOI] [PMC free article] [PubMed] [Google Scholar]
- 7.Briese D T. Insect resistance to baculoviruses. In: Granados R R, Federici B A, editors. The biology of baculovirus. II. Boca Raton, Fla: CRC Press, Inc.; 1986. pp. 237–265. [Google Scholar]
- 8.Burand J P, Wood H A, Summers M D. Defective particles from a persistent baculovirus infection in Trichoplusia ni tissue culture cells. J Gen Virol. 1983;64:391–398. [Google Scholar]
- 9.Burand J P, Kawanishi C Y, Huang Y S. Persistent baculovirus infections. In: Granados R R, Federici B A, editors. The biology of baculovirus. I. Boca Raton, Fla: CRC Press, Inc.; 1986. pp. 159–177. [Google Scholar]
- 10.Burand J P, Wood H A. Intracellular protein synthesis during standard and defective Hz-1 virus replication. J Gen Virol. 1986;67:167–173. [Google Scholar]
- 11.Chao Y-C, Lee S-T, Chang M-C, Chen H-H, Chen S-S, Wu T-Y, Liu F-H, Hsu E-L, Hou R-F. A 2.9-kilobase noncoding nuclear RNA functions in the establishment of persistent Hz-1 viral infection. J Virol. 1998;72:2233–2245. doi: 10.1128/jvi.72.3.2233-2245.1998. [DOI] [PMC free article] [PubMed] [Google Scholar]
- 12.Chao Y-C, Hamblin M, Wood H A. Physical map of Hz-1 baculovirus genome from standard and DI particles. J Gen Virol. 1990;71:1265–1270. [Google Scholar]
- 13.Chao Y-C, Wood H A, Chang C-Y, Lee H-J, Shen W-C, Lee H-T. Differential expression of Hz-1 baculovirus genes during viral productive and persistent infection. J Virol. 1992;66:1442–1448. doi: 10.1128/jvi.66.3.1442-1448.1992. [DOI] [PMC free article] [PubMed] [Google Scholar]
- 14.Chao Y C, Young S Y, Kim K S, Scott H A. A newly isolated densonucleosis virus from Pseudoplusia includens (Lepidoptera:Noctuidae) J Invertebr Pathol. 1985;46:70–82. [Google Scholar]
- 15.Chao Y C, Young S Y, Kim K S. Characterization of a picornavirus isolated from Pseudeplusia includens (Lepidoptera: Noctuidae) J Invertebr Pathol. 1986;47:247–257. [Google Scholar]
- 16.Clem R J, Fechheimer M, Miller L K. Prevention of apoptosis by a baculovirus gene during infection of insect cells. Science. 1991;254:1388–1390. doi: 10.1126/science.1962198. [DOI] [PubMed] [Google Scholar]
- 17.Condreay L D, Brown D T. Exclusion of superinfecting homologous virus by Sindbis virus-infected Aedes albopictus (mosquito) cells. J Virol. 1986;58:81–86. doi: 10.1128/jvi.58.1.81-86.1986. [DOI] [PMC free article] [PubMed] [Google Scholar]
- 18.Delecluse H J, Bartnizke S, Hammerschmidt W, Bullerdiek J, Bornkamm G W. Episomal and integrated copies of Epstein-Barr virus coexist in Burkitt lymphoma cell lines. J Virol. 1993;67:1292–1299. doi: 10.1128/jvi.67.3.1292-1299.1993. [DOI] [PMC free article] [PubMed] [Google Scholar]
- 19.Eans H F. Ecology and epizootiology of baculovirus. In: Granados R R, Federici B A, editors. The biology of baculovirus. II. Boca Raton, Fla: CRC Press, Inc.; 1986. pp. 89–132. [Google Scholar]
- 20.Fleming J G W, Summers M D. Polydnavirus DNA is integrated in the DNA of its parasitoid wasp host. Proc Natl Acad Sci USA. 1991;88:9770–9774. doi: 10.1073/pnas.88.21.9770. [DOI] [PMC free article] [PubMed] [Google Scholar]
- 21.Garcia-Blanco M A, Cullen B R. Molecular basis of latency in pathogenic human viruses. Science. 1991;254:815–820. doi: 10.1126/science.1658933. [DOI] [PubMed] [Google Scholar]
- 22.Granados R R, Nguyen T, Cato B. An insect cell line persistently infected with a baculovirus-like particle. Intervirology. 1978;10:309–317. doi: 10.1159/000148993. [DOI] [PubMed] [Google Scholar]
- 23.Heston L, Rabson M, Brown N, Miller G. New Epstein-Barr virus variants from cellular subclones of P3J-HR-1 Burkitt lymphoma. Nature. 1982;295:160–163. doi: 10.1038/295160a0. [DOI] [PubMed] [Google Scholar]
- 24.Huang Y, Hedberg J, Kawanishi C Y. Characterization of the DNA of a non-occluded baculovirus, Hz-1. J Virol. 1982;43:174–181. doi: 10.1128/jvi.43.1.174-181.1982. [DOI] [PMC free article] [PubMed] [Google Scholar]
- 25.Hughes D S, Possee R D, King L A. Activation and detection of a latent baculovirus resembling Mamestra brassicae nuclear polyhedrosis virus in M. brassicae insects. Virology. 1993;194:608–615. doi: 10.1006/viro.1993.1300. [DOI] [PubMed] [Google Scholar]
- 26.Hughes D S, Possee R D, King L A. Evidence for the presence of a low-level, persistent baculovirus infection of Mamestra brassicae insects. J Gen Virol. 1997;78:1801–1805. doi: 10.1099/0022-1317-78-7-1801. [DOI] [PubMed] [Google Scholar]
- 27.Knutson J C, Sugden B. Immortalization of B lymphocytes by Epstein-Barr virus: what does the virus contribute to the cell? Adv Viral Oncol. 1989;8:151–172. [Google Scholar]
- 28.Lee J C, Chen H H, Wei H L, Chao Y C. Superinfection-induced apoptosis and its correlation with the reduction of viral progeny in cells persistently infected with Hz-1 baculovirus. J Virol. 1993;67:6989–6994. doi: 10.1128/jvi.67.12.6989-6994.1993. [DOI] [PMC free article] [PubMed] [Google Scholar]
- 29.Lee J C, Chao Y C. Apoptosis resulting from superinfection of Hz-1 virus is inhibited by p35 and is not required for viral interference. J Gen Virol. 1998;79:2293–2300. doi: 10.1099/0022-1317-79-9-2293. [DOI] [PubMed] [Google Scholar]
- 30.Levene S D, Zimm B H. Separation of open-circular DNA using pulse-field gel electrophoresis. Proc Natl Acad Sci USA. 1987;84:4054–4057. doi: 10.1073/pnas.84.12.4054. [DOI] [PMC free article] [PubMed] [Google Scholar]
- 31.Longworth J F, Cunningham J C. The activation of occult nuclear polyhedrosis virus by foreign nuclear polyhedra. J Invertebr Pathol. 1968;10:361–367. [Google Scholar]
- 32.McIntosh A H, Ignoffo C M. Establishment of a persistent baculovirus infection in a lepidopteran cell line. J Invertebr Pathol. 1981;38:395–403. [Google Scholar]
- 33.Metzenberg S. Levels of Epstein-Barr virus DNA in lymphoblastoid cell lines are correlated with frequencies of spontaneous lytic growth but not with levels of expression of EBNA-1, EBNA-2, or latent membrane protein. J Virol. 1990;64:437–444. doi: 10.1128/jvi.64.1.437-444.1990. [DOI] [PMC free article] [PubMed] [Google Scholar]
- 34.Miller L K. Insect viruses. In: Fields B N, Knipe D M, Howley P M, editors. Fields virology. 3rd ed. New York, N.Y: Raven Press; 1996. pp. 533–556. [Google Scholar]
- 35.Openshaw H, Asher L V S, Wohlenberg C, Sekizawa T, Notkins A L. Acute and latent infection of sensory ganglia with herpes simplex virus: immune control and virus reactivation. J Gen Virol. 1979;44:205–215. doi: 10.1099/0022-1317-44-1-205. [DOI] [PubMed] [Google Scholar]
- 36.Podgwaite J D, Mazzone H M. Latency of insect viruses. Adv Virus Res. 1986;31:293–320. doi: 10.1016/s0065-3527(08)60266-3. [DOI] [PubMed] [Google Scholar]
- 37.Ralston A L, Huang Y, Kawanishi C Y. Cell culture studies with the IMC-Hz-1 nonoccluded virus. Virology. 1981;115:33–44. doi: 10.1016/0042-6822(81)90086-6. [DOI] [PubMed] [Google Scholar]
- 38.Riedel B, Brown D T. Novel antiviral activity found in the media of Sindbis virus-persistently infected mosquito (Aedes algopictus) cell cultures. J Virol. 1979;29:51–60. doi: 10.1128/jvi.29.1.51-60.1979. [DOI] [PMC free article] [PubMed] [Google Scholar]
- 39.Smith C L, Econome J G, Schutt A, Klco S, Cantor C R. A physical map of the Escherichia coli K12 genome. Science. 1987;236:1448–1453. doi: 10.1126/science.3296194. [DOI] [PubMed] [Google Scholar]
- 40.Stevens J G. Human herpesviruses: a consideration of the latent state. Microbiol Rev. 1989;53:318–332. doi: 10.1128/mr.53.3.318-332.1989. [DOI] [PMC free article] [PubMed] [Google Scholar]
- 41.Volkman L E. Virus taxonomy: the classification and nomenclature of viruses. In: Murphy F A, Fauquet C M, Bishop D H L, Ghabrial S A, Javis A W, Martelli G P, Mayo M A, Summers M D, editors. The sixth report of the ICTV. New York, N.Y: Springer-Verlag Wien, Inc.; 1995. pp. 104–113. [Google Scholar]
- 42.Weigel R, Miller G. Major EB virus-specific cytoplasmic transcripts in a cellular clone of the HR-1 Burkitt lymphoma line during latency and after induction of viral replicative cycle phorbol esters. Virology. 1983;125:287–298. doi: 10.1016/0042-6822(83)90202-7. [DOI] [PubMed] [Google Scholar]
- 43.Wilson M. The family and groups of Baculoviridae. In: Francki R I B, Fauquet C M, Knudson D L, Brown F, editors. Classification and nomenclature of viruses. Fifth report of the International Committee on Taxonomy of Viruses. New York, N.Y: Springer-Verlag Wien, Inc.; 1991. pp. 117–123. [Google Scholar]
- 44.Wood H A, Burand J P. Persistent and productive infections with the Hz-1 baculovirus. Curr Top Microbiol Immunol. 1986;131:119–134. doi: 10.1007/978-3-642-71589-1_7. [DOI] [PubMed] [Google Scholar]


