

Abstract
Background
The symptom for identification of pulmonary arterial hypertension (PAH) is dyspnea on exertion, with a concomitant decrease in exercise capacity. Even patients with hemodynamically improved PAH may have impaired exercise tolerance; however, the effect of central and peripheral factors on exercise tolerance remains unclear. We explored the factors contributing to exercise capacity and ventilatory efficiency in patients with hemodynamically normalized PAH after medical treatment.
Methods and Results
In total, 82 patients with PAH (age: median 46 [interquartile range, 39–51] years; male:female, 23:59) and mean pulmonary arterial pressure ≤30 mm Hg at rest were enrolled. The exercise capacity, indicated by the 6‐minute walk distance and peak oxygen consumption, and the ventilatory efficiency, indicated by the minute ventilation versus carbon dioxide output slope, were assessed using cardiopulmonary exercise testing with a right heart catheter. The mean pulmonary arterial pressure was 21 (17–25) mm Hg, and the 6‐minute walk distance was 530 (458–565) m, whereas the peak oxygen consumption was 18.8 (14.8–21.6) mLꞏmin−1ꞏkg−1. The multivariate model that best predicted 6‐minute walk distance included peak arterial mixed venous oxygen content difference (β=0.46, P<0.001), whereas the best peak oxygen consumption predictors included peak cardiac output (β=0.72, P<0.001), peak arterial mixed venous oxygen content difference (β=0.56, P<0.001), and resting mean pulmonary arterial pressure (β=−0.25, P=0.026). The parameter that best predicted minute ventilation versus carbon dioxide output slope was the resting mean pulmonary arterial pressure (β=0.35, P=0.041). Quadriceps muscle strength was moderately correlated with exercise capacity (6‐minute walk distance; ρ=0.57, P<0.001; peak oxygen consumption: ρ=0.56, P<0.001) and weakly correlated with ventilatory efficiency (ρ=−0.32, P=0.007).
Conclusions
Central and peripheral factors are closely related to impaired exercise tolerance in patients with hemodynamically normalized PAH.
Keywords: 6‐minute walk distance, exercise capacity, hemodynamics, muscle strength, pulmonary arterial hypertension, ventilatory efficiency
Subject Categories: Pulmonary Hypertension
Nonstandard Abbreviations and Acronyms
- 6‐MWD
6‐minute walk distance
- C(a‐v)O2
peak arterial mixed venous oxygen content difference
- PAH
pulmonary arterial hypertension
- PAP
pulmonary artery pressure
- PAWP
pulmonary artery wedge pressure
- RHC
right heart catheterization
- SaO2
oxygen saturation in arterial blood
- VCO2
carbon dioxide output
- VE
minute ventilation
- VO2
oxygen consumption
Clinical Perspective.
What Is New?
Exercise tolerance remains impaired in patients with pulmonary arterial hypertension with normalized hemodynamics.
The 6‐minute walk distance performance was strongly associated with muscular O2 extraction, the peak oxygen consumption was associated with both peripheral and hemodynamic parameters, and the ventilatory parameter (minute ventilation versus carbon dioxide output slope) was primarily associated with the hemodynamic parameter in low‐risk patients with hemodynamically normalized pulmonary arterial hypertension.
Quadriceps muscle strength was moderately correlated with exercise capacity (6‐minute walk distance and peak oxygen consumption) and weakly correlated with ventilatory efficiency (minute ventilation versus carbon dioxide output slope).
What Are the Clinical Implications?
The present study revealed that peripheral function is important even after hemodynamic improvement, suggesting that peripheral function could be a therapeutic target to improve functional capacity.
Interventions that target the skeletal muscle, such as cardiac rehabilitation, may assist in improving exercise capacity in patients with pulmonary arterial hypertension with normalized hemodynamics after medical treatment.
Our study also revealed the fact that exercise capacity was associated with mean pulmonary artery pressure in patients with mildly elevated mean pulmonary artery pressure, supporting data that the diagnostic criteria for pulmonary arterial hypertension was changed from mean pulmonary artery pressure 25 to 20 mm Hg.
Pulmonary arterial hypertension (PAH) is characterized by a progressive increase in pulmonary artery pressure (PAP) and pulmonary vascular resistance (PVR), eventually leading to right heart failure and death. 1 Although PAH‐specific therapies have recently been established to improve patient survival, 2 there are cases wherein exercise intolerance persists despite these treatments; therefore, it is common to encounter patients with PAH and clinically normal hemodynamics who have decreased physical capacity. Moreover, exercise intolerance is associated with a decline in quality of life. 3
Although the pathophysiology underlying exercise intolerance is usually characterized by central and peripheral factors, several peripheral abnormalities have been described as key determinants of exercise intolerance in patients with PAH. 3 We previously reported the importance of peripheral function with similar results in the population with chronic thromboembolic pulmonary hypertension. 4 Researchers have identified several important factors related to limited exercise tolerance in patients with PAH, including skeletal and respiratory muscle dysfunction, 5 , 6 reduced maximal volitional and nonvolitional strength of the quadriceps, 7 , 8 , 9 and reduced oxygen (O2) extraction in the peripheral skeletal muscles. 10 Morphological, microcirculation‐related, and mitochondrial functional abnormalities in skeletal muscle are known to be involved in skeletal muscle weakness (ie, PAH‐related myopathy). 3 , 11 Notably, these reports focus on moderate to severe PAH, and the effect of central and peripheral factors on exercise tolerance in patients with hemodynamically improved PAH after medical treatment remains unclear.
Although skeletal myopathy in patients with left heart failure causes an increased ergoreflex sensitivity resulting in ventilatory inefficiency and autonomic imbalance with adrenergic activation and vagal withdrawal, 12 it has not been clearly described in patients with PAH. Therefore, it is important to identify the factors that contribute to exercise tolerance, including exercise capacity and ventilatory efficiency, in patients with hemodynamically improved PAH. As skeletal muscle alterations appear to be modifiable and reversible, a better understanding of whether PAH‐related myopathy is related to exercise capacity and ventilatory efficiency will help in development of effective therapeutic approaches.
Despite the recent proposal to redefine PAH by lowering the mean PAP (mPAP) threshold from 25 to 20 mm Hg, the association of pulmonary hemodynamic parameters with functional capacity among patients with PAH and a mPAP of <25 mm Hg remains unknown. The determinants for functional capacity can be potential targets for interventions aimed at improving the functional capacity among patients with PAH.
The purpose of this study was to identify the factors contributing to exercise capacity (ie, 6‐minute walk distance [6‐MWD], peak oxygen consumption [peak VO2]), and ventilatory efficiency (ie, minute ventilation [VE] versus carbon dioxide output [VCO2] slope) in low‐risk patients with hemodynamically normalized PAH after medical treatment using invasive exercise stress testing. We also clarify the relation of hemodynamic and functional parameters to skeletal muscle strength.
METHODS
Study Approval
All protocols were performed in accordance with the tenets of the World Medical Association Declaration of Helsinki and approved by the ethics committee of Kyorin University School of Medicine. Patients provided written informed consent before the commencement of the study. The data, analytic methods, and study materials that support the findings of this study are available from the corresponding author upon reasonable request.
Study Participants
Consecutive patients with PAH who underwent cardiopulmonary exercise testing with right heart catheterization (RHC), demonstrating near‐normal PAP (≤30 mm Hg) at rest, between May 2013 and March 2021, were included in the study. These data were obtained in clinical routine, and the analysis was retrospective. Exclusion criteria were as follows: collagen tissue disease‐associated PAH (exercise tolerance is affected by a variety of factors), a high mPAP (>30 mm Hg), or pulmonary artery wedge pressure (PAWP) elevation (≥15 mm Hg) at rest.
Right Heart Catheterization and Cardiopulmonary Exercise Testing
RHC was performed with a 6‐French double‐lumen balloon‐tipped flow‐directed Swan‐Ganz catheter (Harmac Medical Products, Inc., Buffalo, NY), using the transjugular approach. Baseline hemodynamic data were recorded; the zero‐reference level (midchest) was adjusted before pressure measurement, and the PAWP was obtained as the mean value of the arterial trace during occlusion. Measurements were obtained at the end of normal expiration with patients in the supine position in the resting state, to assess the right chamber, PAP (mean, systolic, and diastolic PAP), and PAWP. 13
An incremental, symptom‐limited, cardiopulmonary exercise test was performed in the supine position, using an electromagnetically braked cycle ergometer (Nuclear Imaging Table with Angio Ergometer; Lode BV, Groningen, The Netherlands) according to the ramp protocol. During cycling, the patient's legs were elevated. The test comprised a 3‐minute rest period, followed by a 3‐minute warmup at an ergometer setting of 10 W (60 rpm) and testing with a 1 W increase in exercise load every 6 seconds (totaling 10 W/min).
During exercise, VO2, VCO2, and VE were measured using a metabolic cart (Cpex‐1; Inter Reha Co. Ltd., Tokyo, Japan). Before calculating the parameters from the respiratory gas analysis, an 8‐point moving average of the breath‐by‐breath data was obtained. Peak VO2 was defined as the average value obtained during the last 30 seconds of exercise. Percent (%)‐predicted peak VO2 was calculated according to Japanese normative values. 14 The VE versus VCO2 slope was calculated from the start of incremental exercise to the respiratory compensation point using least‐squares linear regression. 15 Heart rate and arterial blood pressure in the radial artery were recorded directly, and electrocardiographic findings were continuously monitored during testing. The PAP and PAWP during RHC were also measured every minute.
O2 saturation in arterial blood (SaO2) and the pulmonary artery were measured at rest, and during warmup, submaximal, and peak exercises. Cardiac output (CO) was determined by the Fick method using the following formula: CO (L/min)=VO2/{1.34×hemoglobin level×(SaO2−oxygen saturation in pulmonary artery)}. The arterial mixed venous oxygen content difference (C(a‐v)O2) was calculated as follows: 1.34×hemoglobin level×(SaO2−oxygen saturation in pulmonary artery)/1000. PVR was calculated as: PVR (Wood units)=(mPAP−PAWP)/CO. All measurements during exercise testing were performed without supplemental O2. The slope of the mPAP‐flow relationship (mPAP‐CO slope) was calculated from the multipoint plots of the mPAP and CO using least‐squares linear regression. 16
Six‐Minute Walk Distance
The 6‐MWD test was performed according to the American Thoracic Society guidelines, without supplemental O2 on the day before RHC. 17
Strength of the Quadriceps
Knee extensor muscle strength was measured using quadriceps strength by a standardized method using a handheld dynamometer (μTas F‐1; Anima Corp., Tokyo, Japan), following the manufacturer's instructions. Patients were asked to sit on a bench to which the foot of the dynamometer was attached; the dynamometer was then fixed to the distal part of the patient's lower leg while keeping the knee and hip joints bent at a 90° angle. The maximum isometric quadriceps strength value was measured twice for both lower limbs, and the greater values were recorded; the right and left quadriceps strength values were then averaged. The torque (N·m) was calculated as follows: peak force (N)×mechanical arm length (cm)/100; the mechanical arm length was represented by the distance from ankle to the knee joint. Finally, the value was divided by the body weight for normalization.
Statistical Analysis
Data are presented as median (interquartile range) values, as appropriate; categorical variables are expressed as numbers and percentages. The preliminary model was calculated for 6‐MWD as the dependent variable in the univariate linear regression analysis, with the following explanatory variables: patient demographics and hemodynamic parameters obtained through conventional RHC; and mPAP, CO, PVR, SaO2, and C(a‐v)O2 at rest and peak exercise. The same approach was taken for the models of peak VO2 and VE versus VCO2 slope. Multiple linear regression analysis was then performed using the significant variables from the univariate models. The assumptions of normality, constant variance, independence, and linearity of the model were checked in each model. The correlations between quadriceps muscle strength and functional and hemodynamic parameters were determined using Spearman's rank correlation.
Statistical comparisons were considered significant at P<0.05; all analyses were performed using R version 4.0.2 (Foundation for Statistical Computing, Vienna, Austria) software. 18
RESULTS
Baseline Data
The data of 82 patients (age: 46 [39–51] years; female: 59 [72%]) were analyzed; baseline characteristics of the study group are shown in Table 1. The underlying pathologies included the following types of PAH: idiopathic (N=67), hereditary (N=2), portal (N=5), atrial septal defect (after repair) (N=5), drug‐induced (N=2), and HIV‐associated (N=1). The patient fractions of World Health Organization functional classes I and II were 95% and 5%, respectively. A total of 16 patients (20%) required ambulatory oxygen therapy. The prescription rates of intravenous prostaglandin I2, endothelin receptor antagonists, phosphodiesterase type V inhibitors, oral prostacyclin analogs, and soluble guanylate‐cyclase stimulators were 57%, 90%, 59%, 23%, and 23%, respectively. The median time from diagnosis to the exercise test was 96 (48–144) months. The mPAP and 6‐MWD at initial diagnosis were 50 (41–62) mm Hg and 426 (280–514) m, respectively. In patients with RHC, the mPAP was 21 mm Hg, 17 , 18 , 19 , 20 , 21 , 22 , 23 , 24 , 25 CO was 4.9 (4.4–6.0) L/min, and PVR was 2.3 (1.5–3.4) Wood units at rest, suggesting near‐normal hemodynamics. The median 6‐MWD was 530 (458–565) m. Quadriceps muscle strength was 1.3 (1.1–1.6) N·m/kg, suggesting muscle weakness when compared with normal participants.
Table 1.
Baseline Patient Characteristics
| No.=82 | |
|---|---|
| Age, y | 46 (39–51) |
| Sex (male/female), N | 23/59 |
| Body mass index, kg/m2 | 21.5 (19.0–23.2) |
| B‐type natriuretic peptide level, pg/mL | 10 (6–22) |
| Hemoglobin level, g/dL | 13.1 (12.0–13.9) |
| Cause (idiopathic pulmonary artery hypertension/portal/congenital/others), N | 67/5/5/5 |
| World Health Organization functional class (I/II), N | 78/4 |
| HOT all day, N | 8 (10%) |
| HOT night‐time only, N | 8 (10%) |
| Duration of the disease, months | 96 (48–144) |
| Mean PAP at initial diagnosis, mm Hg | 50 (41–62) |
| 6‐MWD at initial diagnosis, m | 426 (280–514) |
| Medical treatment | |
| Intravenous prostaglandin I2, N | 47 (57%) |
| Endothelin receptor antagonist, N | 74 (90%) |
| Phosphodiesterase type V inhibitor, N | 48 (59%) |
| Oral prostacyclin analog, N | 19 (23%) |
| Soluble guanylate cyclase stimulator, N | 21 (26%) |
| Right heart catheterization at flat position | |
| Systolic PAP, mm Hg | 33 (29–38) |
| Diastolic PAP, mm Hg | 11 (7–14) |
| Mean PAP, mm Hg | 21 (17–25) |
| Pulmonary artery wedge pressure, mm Hg | 7 (6–9) |
| Arterial oxygen saturation, % | 96 (95–97) |
| Mixed venous oxygen saturation, % | 76 (73–79) |
| Cardiac output, L/min | 4.9 (4.4–6.0) |
| Pulmonary vascular resistance, Wood units | 2.3 (1.5–3.4) |
| Quadriceps strength, Nm/kg | 1.3 (1.1–1.6) |
| 6‐MWD, m | 530 (458–565) |
| Echocardiography | |
| Left ventricular ejection fraction, % | 66 (63–69) |
| Tricuspid annular plane systolic excursion, mm | 22 (19–25) |
| Right ventricular fractional area change, % | 38 (35–42) |
| Systolic tricuspid valve lateral annular velocity | 12.7 (11.5–14.2) |
Values are presented as median (interquartile range) or number (%), as appropriate. 6‐MWD indicates 6‐minute walk distance; HOT, home oxygen therapy; and PAP, pulmonary artery pressure.
Exercise Data
The exercise test responses at rest (after leg raises) and during submaximal and peak exercises are listed in Table 2. Peak VO2, % predicted peak VO2, and peak workload were 18.8 (14.8–21.6) mLꞏmin−1ꞏkg−1, 69 (57–78)%, and 70 (62–93) W, respectively. The mPAPs during exercise were 34 (28–40) mm Hg and 40 (34–47) mm Hg during submaximal and peak exercises, respectively. The COs during exercise were 11.0 (9.1–13.4) L/min and 13.0 (10.9–15.6) L/min during submaximal and peak exercises, respectively. The C(a‐v)O2 values were 6.7 (5.6–7.3) mL/dL and 7.9 (7.0–8.6) mL/dL during submaximal and peak exercises, respectively. The median VE versus VCO2 slope was 32.4 (29.2–36.6).
Table 2.
Changes in Parameters During Different Exercise States in Right Heart Catherization
| Characteristic | Rest (leg raise) | Submaximal | Peak |
|---|---|---|---|
| Workload, W | 0 | 40 (35–42) | 70 (62–93) |
| Heart rate, bpm | 74 (65–80) | 106 (92–112) | 125 (110–135) |
| Systolic BP, mm Hg | 117 (104–130) | 146 (127–164) | 161 (147–182) |
| Diastolic BP, mm Hg | 67 (62–73) | 78 (71–87) | 81 (72–96) |
| Mean BP, mm Hg | 81 (76–92) | 105 (94–115) | 108 (94–125) |
| Systolic PAP, mm Hg | 36 (31–42) | 55 (48–62) | 64 (53–75) |
| Diastolic PAP, mm Hg | 13 (9–16) | 17 (13–21) | 20 (16–26) |
| Mean PAP, mm Hg | 23 (20–28) | 34 (28–40) | 40 (34–47) |
| Pulmonary artery wedge pressure, mm Hg | 10 (8–12) | 13 (10–18) | 14 (11–19) |
| VO2, mL/min | 239 (205–279) | 690 (580–851) | 974 (774–1171) |
| VCO2, mL/min | 214 (170–245) | 670 (576–826) | 1077 (952–1336) |
| VE, L/min | 8.5 (7.3–9.9) | 22.8 (19.5–28.2) | 40.7 (34.6–47.4) |
| VE/VO2 | 35.3 (32.5–40.2) | 33.8 (30.4–36.9) | 41.8 (37.6–46.5) |
| VE/VCO2 | 42.1 (37.8–45.9) | 34.5 (32.3–38.1) | 36.1 (33.1–40.6) |
| Respiratory exchange ratio | 0.85 (0.80–0.91) | 1.00 (0.96–1.06) | 1.14 (1.08–1.23) |
| CO, L/min | 6.4 (5.2–7.9) | 11.0 (9.1–13.4) | 13.0 (10.9–15.6) |
| Pulmonary vascular resistance, Wood units | 2.0 (1.3–3.3) | 1.6 (1.1–2.6) | 1.8 (1.3–2.6) |
| Arterial oxygen saturation, % | 96 (95–98) | 96 (94–97) | 95 (93–96) |
| Mixed venous oxygen saturation, % | 74 (71–78) | 58 (52–63) | 50 (44–55) |
| Arterial mixed venous oxygen content difference, mL/dL | 3.7 (3.4–4.2) | 6.7 (5.6–7.3) | 7.9 (7.0–8.6) |
| Peak VO2, mLꞏmin−1ꞏkg−1 | 18.8 (14.8–21.6) | ||
| % predicted peak VO2, % | 69 (57–78) | ||
| VE vs VCO2 slope | 32.4 (29.2–36.6) | ||
| Mean PAP‐CO slope | 2.3 (1.7–3.3) |
Data are presented as median (interquartile range). BP indicates blood pressure; CO, cardiac output; O2, oxygen; PAP, pulmonary artery pressure; VCO2, carbon dioxide output; VE, minute ventilation; and VO2, oxygen consumption.
Factors Contributing to Exercise Capacity and Ventilatory Efficiency
The results of the univariate regression analysis are shown in Table 3. Among the cohort, 6‐MWD was associated with female sex (β=−0.29, P=0.013), hemoglobin level (β=0.26, P=0.037), and peak C(a‐v)O2 (β=0.46, P<0.001). Peak VO2 was associated with female sex (β=−0.39, P<0.001), mPAP (β=−0.46, P<0.001) and PVR (β=−0.36, P=0.001) at rest, mPAP‐CO slope (β=−0.23, P=0.039), SaO2 (β=0.28, P=0.012) and CO (β=0.55, P<0.001) during peak exercise, and peak C(a‐v)O2 (β=0.50, P<0.001). The VE versus VCO2 slope was associated with mPAP (β=0.39, P<0.001) and PVR (β=0.27, P=0.013) at rest and peak C(a‐v)O2 (β=−0.22, P=0.044).
Table 3.
Association Between Hemodynamic Variables and Physical Function
| Univariate regression | Multiple regression | |||||||||||
|---|---|---|---|---|---|---|---|---|---|---|---|---|
| 6‐MWD | Peak VO2 | VE vs VCO2 slope | 6‐MWD (R 2=0.23, P<0.001) | Peak VO2 (R 2=0.66, P<0.001) | VE vs VCO2 slope (R 2=0.14, P=0.002) | |||||||
| Coefficient (95% CI) | P value | Coefficient (95% CI) | P value | Coefficient (95% CI) | P value | Coefficient (95% CI) | P value | Coefficient (95% CI) | P value | Coefficient (95% CI) | P value | |
| Age | 0.01 (−0.23–0.25) | 0.937 | −0.17 (−0.39–0.05) | 0.133 | −0.01 (−0.23–0.21) | 0.931 | ||||||
| Female sex | −0.29 (−0.52– −0.07) | 0.013 | −0.39 (−0.60– −0.19) | <0.001 | −0.04 (−0.26– −0.18) | 0.730 | −0.23 (−0.45– −0.02) | 0.033 | 0.17 (−0.01–0.35) | 0.064 | ||
| Body mass index | 0.01 (−0.22–0.24) | 0.931 | ‐0.02 (−0.24–0.21) | 0.875 | 0.08 (−0.14–0.31) | 0.454 | ||||||
| Hemoglobin | 0.26 (0.02–0.51) | 0.037 | 0.18 (−0.04–0.39) | 0.110 | 0.03 (−0.20–0.25) | 0.820 | −0.06 (−0.34–0.20) | 0.618 | ||||
| Mean PAP at rest | −0.17 (−0.40–0.06) | 0.152 | −0.46 (−0.66– −0.26) | <0.001 | 0.39 (0.18–0.59) | <0.001 | −0.25 (−0.47– −0.03) | 0.026 | 0.35 (0.01–0.68) | 0.041 | ||
| Pulmonary vascular resistance at rest | −0.18 (−0.41–0.05) | 0.120 | −0.36 (−0.57–‐0.15) | 0.001 | 0.27 (0.06–0.49) | 0.013 | 0.17 (−0.07–0.41) | 0.157 | 0.02 (−0.31–0.34) | 0.926 | ||
| CO at rest | −0.05 (−0.29–0.18) | 0.545 | 0.18 (−0.04–0.43) | 0.109 | 0.00 (−0.22–0.22) | 0.997 | ||||||
| C(a‐v)O2 at rest | 0.17 (−0.07–0.41) | 0.169 | 0.05 (−0.17–0.28) | 0.635 | 0.01 (−0.21–0.23) | 0.916 | ||||||
| Mean PAP at peak | −0.07 (−0.30–0.16) | 0.536 | −0.16 (−0.38–0.06) | 0.145 | 0.22 (−0.003–0.43) | 0.053 | ||||||
| Mean PAP‐CO slope | −0.07 (−0.31–0.18) | 0.591 | −0.23 (−0.45– −0.01) | 0.039 | 0.10 (−0.12–0.31) | 0.379 | −0.02 (−0.19–0.15) | 0.828 | ||||
| Arterial oxygen saturation at peak | 0.14 (−0.09–0.37) | 0.227 | 0.28 (0.06–0.49) | 0.012 | −0.13 (−0.35–0.09) | 0.253 | 0.06 (−0.08–0.20) | 0.419 | ||||
| CO at peak | 0.17 (−0.06–0.15) | 0.153 | 0.55 (0.36–0.74) | <0.001 | −0.16 (−0.38–0.06) | 0.151 | 0.72 (0.52–0.92) | <0.001 | ||||
| C(a‐v)O2 at peak | 0.46 (0.25–0.67) | <0.001 | 0.50 (0.31–0.70) | <0.001 | −0.22 (−0.44– −0.01) | 0.044 | 0.46 (0.21–0.71) | <0.001 | 0.56 (0.41–0.72) | <0.001 | −0.16 (−0.38–0.06) | 0.142 |
6‐MWD indicates 6‐minute walk distance; C(a‐v)O2, arterial mixed venous oxygen content difference; CO, cardiac output; PAP, pulmonary artery pressure; VCO2, carbon dioxide output; VE, minute ventilation; and VO2, oxygen consumption.
The results of the multivariate regression analysis are also shown in Table 3. The multivariate model that best predicted 6‐MWD included peak C(a‐v)O2 (β=0.46, P<0.001) and female sex (β=−0.23, P=0.033), whereas the best peak VO2 predictor included peak CO (β=0.72, P<0.001), peak C(a‐v)O2 (β=0.56, P<0.001), and mPAP at rest (β=−0.25, P=0.026). The parameter that best predicted the VE versus VCO2 slope was the mPAP at rest (β=0.35, P=0.041). The variance inflation factors in the models were all <2.
Relationships Between Quadriceps Strength and Functional Parameters
Both quadriceps muscle strength and peak C(a‐v)O2 were positively correlated (ρ=0.31, P=0.008; Figure 1). The correlations between quadriceps muscle strength, exercise capacity, and ventilatory efficacy are shown in Figure 2. The 6‐MWD and peak VO2 were positively correlated with quadriceps muscle strength (6‐MWD: ρ=0.57, P<0.001, and peak VO2: ρ=0.56, P<0.001; Figure 2A and 2B, respectively), and the VE versus VCO2 slope was negatively correlated with quadriceps muscle strength (ρ=−0.32, P=0.007; Figure 2C). In addition, quadriceps muscle strength was also negatively correlated with resting mPAP (ρ=−0.38, P<0.001; Figure 3).
Figure 1. Correlation between quadriceps muscle strength and peak C(a‐v)O2.
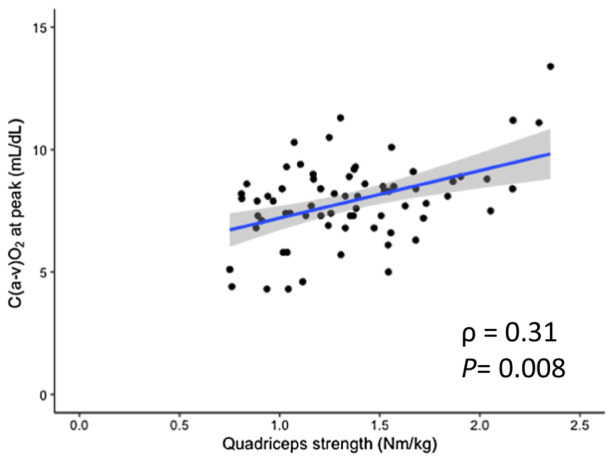
The quadriceps muscle strength was positively correlated with peak C(a‐v)O2. C(a‐v)O2 indicates arterial mixed venous oxygen content difference.
Figure 2. Correlations between quadriceps muscle strength and (A) 6‐MWD, (B) peak VO2, and (C) ventilatory efficiency (VE vs VCO2 slope).
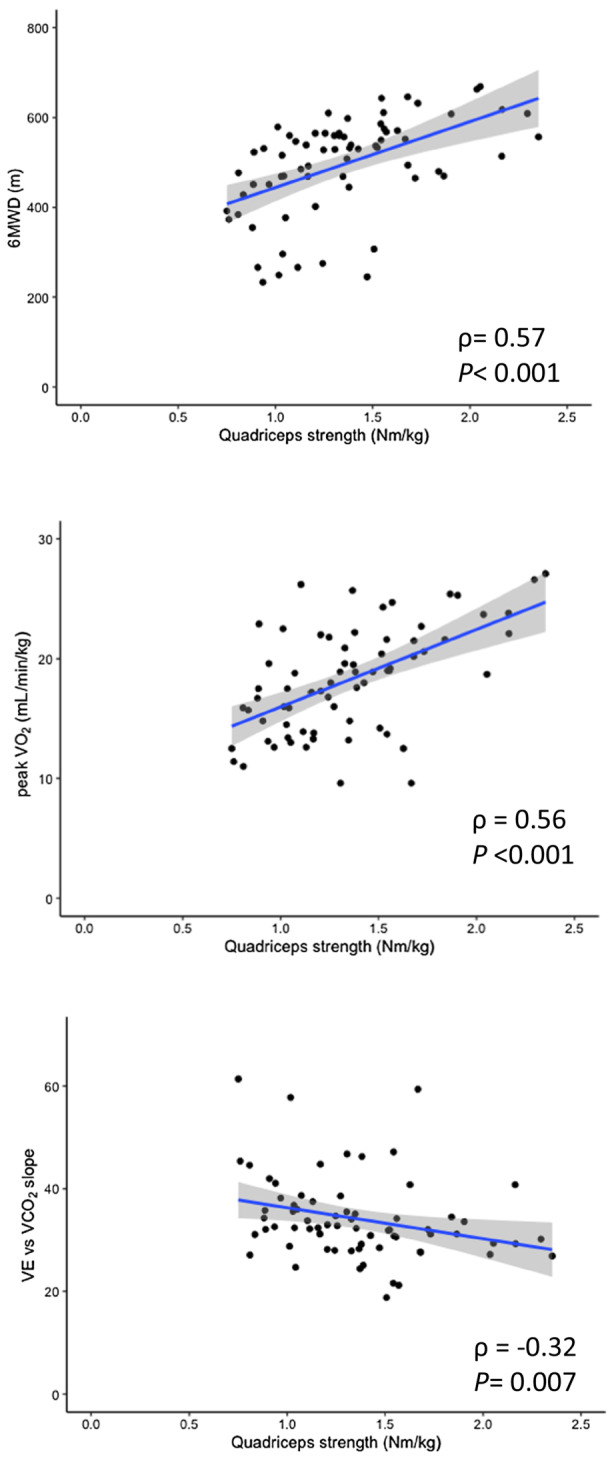
The 6‐MWD and peak VO2 were positively correlated with quadriceps muscle strength, and the VE vs VCO2 slope was negatively correlated with quadriceps muscle strength. 6‐MWD indicates 6‐minute walk distance; peak VO2, peak oxygen consumption; VCO2, carbon dioxide output; and VE, minute ventilation.
Figure 3. Correlation between quadriceps muscle strength and resting mean PAP.
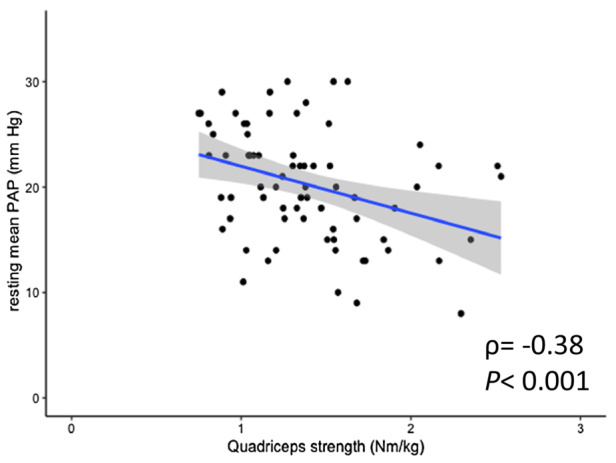
The quadriceps muscle strength was negatively correlated with resting mean PAP. PAP indicates pulmonary artery pressure.
DISCUSSION
The present study revealed that the 6‐MWD performance was strongly associated with muscular O2 extraction, peak VO2 was associated with both peripheral and hemodynamic parameters, and the ventilatory parameter (VE versus VCO2 slope) was primarily associated with hemodynamic function in low‐risk patients with hemodynamically normalized PAH. Quadriceps muscle strength was moderately correlated with exercise capacity and weakly correlated with ventilatory efficiency, suggesting that peripheral function may improve exercise tolerance in patients with hemodynamically normalized PAH. In addition, quadriceps muscle strength was also correlated with the hemodynamic parameter, even in low‐risk patients.
This study revealed the major contributing factors to 6‐MWD, peak VO2, and VE versus VCO2 slope in patients with low‐risk PAH. Central and peripheral factors are closely related to impaired exercise tolerance.
Relationship Between Exercise Capacity and Peripheral Factors in Patients With PAH
Recently, the life expectancy of patients with PAH has improved remarkably. 19 Consequently, patient‐oriented values, such as quality of life and exercise tolerance, have garnered attention as treatment goals. It is widely accepted that exercise intolerance is regulated by both central (eg, hemodynamics at rest and during exercise) and peripheral (eg, O2 extraction/use by skeletal muscle and skeletal muscle strength) factors 3 ; however, several studies have highlighted that peripheral abnormalities may contribute to exercise intolerance in patients with PAH. Inflammatory activation, impaired insulin/anabolic signaling, hypoxemia, and abnormalities in mitochondrial function finally culminate to present a broad spectrum of cellular abnormalities in PAH muscles, thereby causing muscle atrophy and reduced contractility. 11 Researchers have revealed the presence of PAH‐related myopathy with the following pathophysiology: reduced skeletal muscle mass and strength, reduced volitional and nonvolitional contractility, a fiber switch from “resistant” type‐I to “fast” type‐II fibers, increased muscle protein degradation, decreased capillary density, impaired mitochondrial function, and altered excitation‐contraction coupling. 3 , 20
Regarding patients with PAH, several researchers have reported a relationship between exercise capacity and muscle strength. Bauer et al 7 found that forearm muscle strength was reduced by 30%, whereas muscle strength had a linear correlation with 6‐MWD in patients with idiopathic PAH. Mainguy et al 8 reported that quadriceps strength was positively correlated with exercise capacity (peak VO2), further suggesting that the disease duration and fraction of type‐I fibers were negatively correlated. Breda et al 21 reported that the coexistence of ventilatory dysfunction and quadriceps weakness resulted in exercise intolerance in patients with PAH; they further demonstrated an independent association between muscular type and maximum exercise capacity, independent of hemodynamics. We demonstrated that exercise capacity (6‐MWD and peak VO2) was correlated with quadriceps muscle strength, which was consistent with these results. Thus, this study adds knowledge regarding low‐risk patients with hemodynamically normalized PAH.
Regarding O2 metabolism in patients with PAH, Tolle et al 10 revealed that the systemic O2 extraction at peak exercise was more impaired in patients with PAH than in those with left heart failure.
Impaired muscular O2 use has been reported to be caused by skeletal muscle morphological (muscle mass and strength), microcirculatory, and mitochondrial function abnormalities and is associated with exercise intolerance. 7 , 20 , 22
Malenfant et al 22 observed both muscle O2 desaturation and increased deoxyhemoglobin‐myoglobin during normoxic and hyperoxic submaximal exercises despite near‐normal systemic O2 delivery, suggesting a decline in total systemic O2 extraction and use in exercising muscles. Consistent with the findings in patients with PAH, this study revealed that exercise capacity (6‐MWD and peak VO2) is associated with peripheral O2 extraction.
Reduced cardiovascular function leads to deconditioning and causes muscle atrophy. Morphological abnormalities of skeletal muscle (muscle mass and strength) themselves cause impaired O2 extraction in the muscle. In addition, the decrease in capillary density is considered to be due to the downregulation of microRNA‐126. 20 This decrease in capillary density reduces O2 supply to the skeletal muscle, resulting in exercise intolerance. By contrast, muscular dysfunction involves decreased activity of oxidative enzymes. 8
The present study demonstrated that peripheral factors, including O2 extraction and muscle strength, could be the chief determinants of exercise capacity, even in low‐risk patients with hemodynamically normalized PAH. Many cases in our study had a long disease duration; therefore, peripheral functions may have become more damaged throughout the disease course, as demonstrated in a previous study. 8
In our previous study, we reported the determinants of exercise tolerance in patients with hemodynamically normalized chronic thromboembolic pulmonary hypertension. 4 The importance of peripheral factors is consistent in terms of determinants of exercise tolerance, especially in 6‐MWD, in both populations with chronic thromboembolic pulmonary hypertension and PAH. The current population with PAH was younger and had a better exercise tolerance than the population with chronic thromboembolic pulmonary hypertension; however, about half of them received continuous intravenous infusion therapy, and many of them had been affected by a long disease duration, which may have had a stronger effect on peripheral functions.
Ventilatory Efficiency in Patients With PAH
PAH is characterized by a heightened ventilatory response to exercise (VE versus VCO2 slope); this is partially attributed to pulmonary vascular remodeling, leading to an increased physiological dead space (dead‐space ventilation/tidal ventilation) ratio and high ventilation‐perfusion mismatch. 23 A higher VE versus VCO2 slope is associated with disease severity and poor prognostic markers. 24 Ventilatory inefficiency is explained by increased dead‐space ventilation/tidal ventilation ratio and central chemoreflex sensitivity. It is known that the VE versus VCO2 slope is higher and exercise oscillatory ventilation is lower in patients with PAH rather than in those with left heart disease. Additionally, the mechanism of exercise hyperpnea appears different; however, the cause of this difference remains unclear. 25
It has been frequently reported that skeletal myopathy in left heart failure causes increased ergoreflex sensitivity, resulting in dyspnea on exertion and autonomic imbalance with adrenergic activation and vagal withdrawal. 12 Thus, hemodynamic changes contribute to the progression of cardiac dysfunction and muscle wasting. In contrast, the involvement of ergoreflex in the ventilation efficiency of patients with PAH remains unclear. Our results reveal that the VE versus VCO2 slope was mainly correlated with hemodynamic parameters, demonstrating a weak but negative correlation with peripheral muscle strength. While ventilation is mainly controlled by chemoreflex in patients with PAH, ergoreflex may also be involved; thus, interventions through ergoreflex may have a positive effect on ventilation efficiency. Further studies are needed to confirm this hypothesis.
Relationship Between Exercise Capacity and Hemodynamic Parameters in Patients With Low‐Risk PAH
Recently, the lowering of mPAP threshold from 25 to mPAP 20 mm Hg has been proposed as the diagnostic criteria for PAH. 26 This is based on the fact that mildly elevated mPAP is correlated with poor prognosis. 27 It is also known that patients with mildly elevated mPAP have lower exercise capacity (6‐MWD and peak VO2) compared with patients with normal PAP, 28 as revealed by our study. Even in such a low‐risk population, there was a significant weak correlation between mPAP and quadriceps muscle strength, suggesting deconditioning is caused by the disease. Even mildly elevated resting mPAP continues to cause exertional limitations, supporting the validity of lowering the mPAP threshold in the guideline. Whether further PAP reduction could improve exercise tolerance needs to be elucidated in future studies.
Effects of Exercise Training on Peripheral Factors
The mechanisms underlying the beneficial effects of exercise training in patients with PAH have been shown to improve exercise capacity (6‐MWD and peak VO2) and quality of life. 8 , 29 , 30 Exercise is regarded as an important adjunctive medical therapy. It has been shown that the expression of muscular enzymes recovers in parallel with the amount of exercise training 8 , 24 , 31 ; moreover, exercise training reverses some skeletal muscle abnormalities, such as mitochondrial respiratory capacity. 32 Randomized controlled trials on skeletal muscle training reported by González‐Saiz et al, and whole‐body vibration therapy reported by Gerhardt et al, showed improvements in muscle strength, suggesting that exercise tolerance becomes better by peripheral function improvement in patients with PAH. 33 , 34 The present study revealed that peripheral function is important even after hemodynamic improvement, suggesting that peripheral function can be a therapeutic target to improve functional capacity. Thus, individualized rehabilitation programs based on peripheral function should be considered.
Limitations
This study has 4 limitations. First, our study population did not include patients with an mPAP >30 mm Hg; therefore, the relationships between the parameters in these patients are unclear. Second, respiratory function tests and muscle data are lacking; thus, the effects of respiratory function and muscles are unknown. Third, upfront combination therapy, which improves hemodynamics early in the course of the disease and is expected to shorten the time to hemodynamic normalization, has become more widespread in recent years; therefore, this treatment strategy may have different effects on the peripheral functions observed in this study. Lastly, despite attempting various models, the multiple models did not follow some assumptions required for multivariate linear regression.
CONCLUSIONS
Our study showed that 6‐MWD performance in PAH patients may be significantly influenced by peripheral factors, and peak VO2 is related to hemodynamic and peripheral factors. In contrast, VE versus VCO2 slope is related to hemodynamic factors. Both central and peripheral factors may contribute to exercise intolerance in low‐risk patients with hemodynamically normalized PAH.
Sources of Funding
None.
Disclosures
None.
Acknowledgments
The authors would like to thank Momoko Masuda and Hayato Sakamoto for their technical assistance. Dr Goda, Nishida, and Tobita designed the study, analyzed the data, and wrote the article. Dr Kohno, Dr Tashiro, Dr Yamada, Dr Satoh, and Dr Soejima reviewed the data and edited the article. Dr Takeuchi, Dr Kikuchi, Dr Goda, and Dr Inami performed the exercise tests. Dr Teruya provided statistical advice.
This article was sent to Alexandros Briasoulis, MD, PhD, Guest Editor, for review by expert referees, editorial decision, and final disposition.
For Sources of Funding and Disclosures, see page 9.
REFERENCES
- 1. Humbert M, Guignabert C, Bonnet S, Dorfmüller P, Klinger JR, Nicolls MR, Olschewski AJ, Pullamsetti SS, Schermuly RT, Stenmark KR, et al. Pathology and pathobiology of pulmonary hypertension: state of the art and research perspectives. Eur Respir J. 2019;53:53. doi: 10.1183/13993003.01887-2018 [DOI] [PMC free article] [PubMed] [Google Scholar]
- 2. Hoeper MM, Markevych I, Spiekerkoetter E, Welte T, Niedermeyer J. Goal‐oriented treatment and combination therapy for pulmonary arterial hypertension. Eur Respir J. 2005;26:858–863. doi: 10.1183/09031936.05.00075305 [DOI] [PubMed] [Google Scholar]
- 3. Malenfant S, Lebret M, Breton‐Gagnon É, Potus F, Paulin R, Bonnet S, Provencher S. Exercise intolerance in pulmonary arterial hypertension: insight into central and peripheral pathophysiological mechanisms. Eur Respir Rev. 2021;30:30. doi: 10.1183/16000617.0284-2020 [DOI] [PMC free article] [PubMed] [Google Scholar]
- 4. Tobita K, Goda A, Nishida Y, Takeuchi K, Kikuchi H, Inami T, Kohno T, Yamada S, Soejima K, Satoh T. Factors contributing to exercise capacity in chronic thromboembolic pulmonary hypertension with near‐normal hemodynamics. J Heart Lung Transplant. 2021;40:677–686. doi: 10.1016/j.healun.2021.03.003 [DOI] [PubMed] [Google Scholar]
- 5. Batt J, Ahmed SS, Correa J, Bain A, Granton J. Skeletal muscle dysfunction in idiopathic pulmonary arterial hypertension. Am J Respir Cell Mol Biol. 2014;50:74–86. doi: 10.1165/rcmb.2012-0506OC [DOI] [PubMed] [Google Scholar]
- 6. Panagiotou M, Peacock AJ, Johnson MK. Respiratory and limb muscle dysfunction in pulmonary arterial hypertension: a role for exercise training? Pulm Circ. 2015;5:424–434. doi: 10.1086/682431 [DOI] [PMC free article] [PubMed] [Google Scholar]
- 7. Bauer R, Dehnert C, Schoene P, Filusch A, Bärtsch P, Borst MM, Katus HA, Meyer FJ. Skeletal muscle dysfunction in patients with idiopathic pulmonary arterial hypertension. Respir Med. 2007;101:2366–2369. doi: 10.1016/j.rmed.2007.06.014 [DOI] [PubMed] [Google Scholar]
- 8. Mainguy V, Maltais F, Saey D, Gagnon P, Martel S, Simon M, Provencher S. Peripheral muscle dysfunction in idiopathic pulmonary arterial hypertension. Thorax. 2010;65:113–117. doi: 10.1136/thx.2009.117168 [DOI] [PubMed] [Google Scholar]
- 9. Manders E, Rain S, Bogaard HJ, Handoko ML, Stienen GJM, Vonk‐Noordegraaf A, Ottenheijm CAC, De Man FS. The striated muscles in pulmonary arterial hypertension: adaptations beyond the right ventricle. Eur Respir J. 2015;46:832–842. doi: 10.1183/13993003.02052-2014 [DOI] [PubMed] [Google Scholar]
- 10. Tolle J, Waxman A, Systrom D. Impaired systemic oxygen extraction at maximum exercise in pulmonary hypertension. Med Sci Sports Exerc. 2008;40:3–8. doi: 10.1249/mss.0b013e318159d1b8 [DOI] [PubMed] [Google Scholar]
- 11. Marra AM, Arcopinto M, Bossone E, Ehlken N, Cittadini A, Grünig E. Pulmonary arterial hypertension‐related myopathy: an overview of current data and future perspectives. Nutr Metab Cardiovasc Dis. 2015;25:131–139. doi: 10.1016/j.numecd.2014.10.005 [DOI] [PubMed] [Google Scholar]
- 12. Aimo A, Saccaro LF, Borrelli C, Fabiani I, Gentile F, Passino C, Emdin M, Piepoli MF, Coats AJS, Giannoni A. The ergoreflex: how the skeletal muscle modulates ventilation and cardiovascular function in health and disease. Eur J Heart Fail. 2021;23:1458–1467. doi: 10.1002/ejhf.2298 [DOI] [PMC free article] [PubMed] [Google Scholar]
- 13. Hoeper MM, Bogaard HJ, Condliffe R, Frantz R, Khanna D, Kurzyna M, Langleben D, Manes A, Satoh T, Torres F, et al. Definitions and diagnosis of pulmonary hypertension. J Am Coll Cardiol. 2013;62:D42–D50. doi: 10.1016/j.jacc.2013.10.032 [DOI] [PubMed] [Google Scholar]
- 14. Itoh H, Ajisaka R, Koike A, Makita S, Omiya K, Kato Y, Adachi H, Nagayama M, Maeda T, Tajima A, et al. Committee on exercise prescription for patients (CEPP) members. Heart rate and blood pressure response to ramp exercise and exercise capacity in relation to age, gender, and mode of exercise in a healthy population. J Cardiol. 2013;61:71–78. doi: 10.1016/j.jjcc.2012.09.010 [DOI] [PubMed] [Google Scholar]
- 15. Chua TP, Ponikowski P, Harrington D, Anker SD, Webb‐Peploe K, Clark AL, Poole‐Wilson PA, Coats AJ. Clinical correlates and prognostic significance of the ventilatory response to exercise in chronic heart failure. J Am Coll Cardiol. 1997;29:1585–1590. doi: 10.1016/S0735-1097(97)00078-8 [DOI] [PubMed] [Google Scholar]
- 16. Kovacs G, Herve P, Barbera JA, Chaouat A, Chemla D, Condliffe R, Garcia G, Grünig E, Howard L, Humbert M, et al. An official European Respiratory Society statement: pulmonary haemodynamics during exercise. Eur Respir J. 2017;50:50. doi: 10.1183/13993003.00578-2017 [DOI] [PubMed] [Google Scholar]
- 17. ATS Committee on Proficiency Standards for Clinical Pulmonary Function Laboratories. ATS statement: guidelines for the six‐minute walk test. Am J Respir Crit Care Med. 2002;166:111–117. doi: 10.1164/ajrccm.166.1.at1102 [DOI] [PubMed] [Google Scholar]
- 18. R Core Team . R: A Language and Environment for Statistical Computing. R Foundation for Statistical Computing; 2020. https://www.r‐project.org/ [Google Scholar]
- 19. Tamura Y, Kumamaru H, Satoh T, Miyata H, Ogawa A, Tanabe N, Hatano M, Yao A, Abe K, Tsujino I, et al. Effectiveness and outcome of pulmonary arterial hypertension‐specific therapy in Japanese patients with pulmonary arterial hypertension. Circ J. 2017;82:275–282. doi: 10.1253/circj.CJ-17-0139 [DOI] [PubMed] [Google Scholar]
- 20. Potus F, Malenfant S, Graydon C, Mainguy V, Tremblay È, Breuils‐Bonnet S, Ribeiro F, Porlier A, Maltais F, Bonnet S, et al. Impaired angiogenesis and peripheral muscle microcirculation loss contribute to exercise intolerance in pulmonary arterial hypertension. Am J Respir Crit Care Med. 2014;190:318–328. doi: 10.1164/rccm.201402-0383OC [DOI] [PubMed] [Google Scholar]
- 21. Breda AP, Pereira de Albuquerque AL, Jardim C, Morinaga LK, Suesada MM, Fernandes CJC, Dias B, Lourenço RB, Salge JM, Souza R. Skeletal muscle abnormalities in pulmonary arterial hypertension. PLoS One. 2014;9:e114101. doi: 10.1371/journal.pone.0114101 [DOI] [PMC free article] [PubMed] [Google Scholar]
- 22. Malenfant S, Potus F, Mainguy V, Leblanc E, Malenfant M, Ribeiro F, Saey D, Maltais F, Bonnet S, Provencher S. Impaired skeletal muscle oxygenation and exercise tolerance in pulmonary hypertension. Med Sci Sports Exerc. 2015;47:2273–2282. doi: 10.1249/MSS.0000000000000696 [DOI] [PubMed] [Google Scholar]
- 23. Farina S, Correale M, Bruno N, Paolillo S, Salvioni E, Badagliacca R, Agostoni P. “Right and left heart failure study group” of the Italian Society of Cardiology. The role of cardiopulmonary exercise tests in pulmonary arterial hypertension. Eur Respir Rev. 2018;27:27. doi: 10.1183/16000617.0134-2017 [DOI] [PMC free article] [PubMed] [Google Scholar]
- 24. Schwaiblmair M, Faul C, von Scheidt W, Berghaus TM. Ventilatory efficiency testing as prognostic value in patients with pulmonary hypertension. BMC Pulm Med. 2012;12:23. doi: 10.1186/1471-2466-12-23 [DOI] [PMC free article] [PubMed] [Google Scholar]
- 25. Caravita S, Faini A, Deboeck G, Bondue A, Naeije R, Parati G, Vachiéry J‐L. Pulmonary hypertension and ventilation during exercise: role of the pre‐capillary component. J Heart Lung Transplant. 2017;36:754–762. doi: 10.1016/j.healun.2016.12.011 [DOI] [PubMed] [Google Scholar]
- 26. Maron BA, Wertheim BM, Gladwin MT. Under pressure to clarify pulmonary hypertension clinical risk. Am J Respir Crit Care Med. 2018;197:423–426. doi: 10.1164/rccm.201711-2306ED [DOI] [PMC free article] [PubMed] [Google Scholar]
- 27. Lam CSP, Borlaug BA, Kane GC, Enders FT, Rodeheffer RJ, Redfield MM. Age‐associated increases in pulmonary artery systolic pressure in the general population. Circulation. 2009;119:2663–2670. doi: 10.1161/CIRCULATIONAHA.108.838698 [DOI] [PMC free article] [PubMed] [Google Scholar]
- 28. Kovacs G, Maier R, Aberer E, Brodmann M, Scheidl S, Tröster N, Hesse C, Salmhofer W, Graninger W, Gruenig E, et al. Borderline pulmonary arterial pressure is associated with decreased exercise capacity in scleroderma. Am J Respir Crit Care Med. 2009;180:881–886. doi: 10.1164/rccm.200904-0563OC [DOI] [PubMed] [Google Scholar]
- 29. Pandey A, Garg S, Khunger M, Garg S, Kumbhani DJ, Chin KM, Berry JD. Efficacy and safety of exercise training in chronic pulmonary hypertension: systematic review and meta‐analysis. Circ Heart Fail. 2015;8:1032–1043. doi: 10.1161/CIRCHEARTFAILURE.115.002130 [DOI] [PubMed] [Google Scholar]
- 30. Buys R, Avila A, Cornelissen VA. Exercise training improves physical fitness in patients with pulmonary arterial hypertension: a systematic review and meta‐analysis of controlled trials. BMC Pulm Med. 2015;15:15. doi: 10.1186/s12890-015-0031-1 [DOI] [PMC free article] [PubMed] [Google Scholar]
- 31. Grünig E, Eichstaedt C, Barberà J‐A, Benjamin N, Blanco I, Bossone E, Cittadini A, Coghlan G, Corris P, D'Alto M, et al. ERS statement on exercise training and rehabilitation in patients with severe chronic pulmonary hypertension. Eur Respir J. 2019;53:53. doi: 10.1183/13993003.00332-2018 [DOI] [PubMed] [Google Scholar]
- 32. Daussin FN, Zoll J, Dufour SP, Ponsot E, Lonsdorfer‐Wolf E, Doutreleau S, Mettauer B, Piquard F, Geny B, Richard R. Effect of interval versus continuous training on cardiorespiratory and mitochondrial functions: relationship to aerobic performance improvements in sedentary subjects. Am J Physiol Regul Integr Comp Physiol. 2008;295:R264–R272. doi: 10.1152/ajpregu.00875.2007 [DOI] [PubMed] [Google Scholar]
- 33. González‐Saiz L, Fiuza‐Luces C, Sanchis‐Gomar F, Santos‐Lozano A, Quezada‐Loaiza CA, Flox‐Camacho A, Munguía‐Izquierdo D, Ara I, Santalla A, Morán M, et al. Benefits of skeletal‐muscle exercise training in pulmonary arterial hypertension: the WHOLEi + 12 trial. Int J Cardiol. 2017;231:277–283. doi: 10.1016/j.ijcard.2016.12.026 [DOI] [PubMed] [Google Scholar]
- 34. Gerhardt F, Dumitrescu D, Gärtner C, Beccard R, Viethen T, Kramer T, Baldus S, Hellmich M, Schönau E, Rosenkranz S. Oscillatory whole‐body vibration improves exercise capacity and physical performance in pulmonary arterial hypertension: a randomised clinical study. Heart. 2017;103:592–598. doi: 10.1136/heartjnl-2016-309852 [DOI] [PMC free article] [PubMed] [Google Scholar]