Abstract
This study was performed in order to understand the effect of climatological variables on the malaria situation in the north-east region of India, which is prolonged by the disease. Time-series analysis of major climate parameters like rainfall, maximum temperature, minimum temperature, mean temperature, relative humidity, and soil moisture distributions is carried out, and their correlation with the malaria incidence is quantified state-wise, which is the unique part of the study. The correlation analysis reveals that malaria is significantly related with the maximum temperature and soil moisture in three out of eight states in NE India. To assess the climate variability, the inter-dependency between the meteorological parameters is obtained and the state wise correlation matrix for all states are reported. The analysis shows that maximum and mean temperature has highest positive correlation whereas minimum temperature and relative humidity has negative correlation. The climate-malaria relation is being carried out in the study region using the regression analysis and the results revealed that the regional climate has the most impact for the malaria incidence in the state of Arunachal Pradesh, Meghalaya, Tripura and Nagaland and in other states the impact is moderate. Analysis of variance modelling in the regions also indicates the degree of the fitment of both the data sets with the regression model and it is observed that the relation is also significant in the same 4 states. As a case study the impact of large scale oscillations like El Niño-Southern Oscillation on the malaria load is also assessed which can be a good indicator in the prediction of the climate and in turn the malaria incidences over the region.
Keywords: Malaria, North east India, Temperature, Rainfall, Soil moisture, Correlation analysis, ANOVA
Introduction
Malaria, a vector-borne epidemic, is one of the dangerous diseases affecting the entire world. Complete eradication has still been a challenge to many infected countries. Except for the areas above 1700 m mean sea level, a major portion of the Indian subcontinent is under constant risk of malaria outbreak (INC 2004). In India, the peak season of malaria risk is observed during monsoon/wet season as it provides the optimal weather conditions needed for vector development and transmission. However, there is a constant risk of the disease throughout the year. Malaria is caused by the protozoan Plasmodium parasite. Out of the 5 parasite species that harm humans, P. falciparum and P.vivax are of the greatest threat. Two of the most efficient malaria vectors are An.minimus and An.baimaii with strong predilection for the human host (Dev et al. 2013).
The transmission and prevalence of malaria parasites depends on the meteorological factors and long term change in climate variables (Kovats et al. 2001; Patz 1998). Climate change affects the survival rate, reproduction rates, intensity, temporal variability and development of vectors and the pathogens they transmit (Kovats et al. 2001). In the past 100 years, the surface temperature has increased by 0.3 °C and variation in rainfall distribution with increased extreme rainfall events is seen in India (INC 2004). The incubation period of P.vivax and P.falciparum is approximately 12–17 and 9–14 days respectively (Dhiman et al. 2008). Survival temperature of the P.vivax parasite in Anopheline mosquitoes was found to be 14.5–16.5 °C and for P.falciparum, it varied between 16.5 and 19 °C (Macdonald 1957; Martens et al. 1995). Temperature range 20–30 °C and 60% relative humidity were observed congenial for parasite development in vector host (Bruce-Chwatt 1985). As the malaria vectors are poikilothermic, the lifespan of mosquitoes can increase by more than a week, if an anomaly of only 1 °C is observed (Jepson 1947). Even an increase in average global temperature by 1–3.5 °C, can trigger the risk of vector-borne diseases in new regions across the globe (Githeko 2000). A significant effect of soil moisture conditions on malaria breeding is observed (Malone et al. 2003; Patz 1998). Also, the survival of malaria mosquitoes depend on the seasons (Russell et al. 1963). The life cycle of mosquitoes strongly depends on ambient temperature and available water bodies. Several studies showed that the floods/rainfall are likely to increase the spread of vector-borne diseases by significant increase of the breeding habitats of vectors (Hussien et al. 2019; Mahendran et al. 2020; Sadoine et al. 2018). The ambient temperature of a region can also aid in faster development of vectors leading to an epidemic outburst (Fischer et al. 2020).
In addition to the weather parameters, deforestation also plays an important role in the increase of malaria risk. Deforestation leads to a rise in temperature (Lindblade et al. 2000), more sunlight and more stagnant water (Patz et al. 2000). These factors affect the life cycle of malaria mosquitoes and help in rapid pupation and growth rate also increases survival time and biting rate (Afrane et al. 2005; Munga 2006; Petney 2001; Vittor et al. 2006; Zhong 2016). The effect of deforestation on malaria vector transmission is characteristic of the region and species responsible for the epidemic (Burkett-Cadena and Vittor 2018; Kar et al. 2014; Yasuoka et al. 2007). Deforestation in Africa and Latin America resulted in a rise in malaria cases but in Asia, it decreased (Guerra et al. 2006). A number of studies done across the globe, has given different correlation between malaria incidence and climate parameters. In some West African countries, model output showed a negative correlation with temperature, rainfall and malaria in some parts and the same correlation is found to be positive in some other (Arab et al. 2014). In southwest Ethiopia, a positive dependence between rainfall and relative humidity is seen in some of the places (Sena et al. 2015). It is very much evident that the correlation between these parameters and malaria outburst is very much region specific.
As per 2014–15 annual report of National vector borne disease control programme (NVBDCP), about 91% of malaria cases and 99% of deaths due to malaria are reported from high disease burden states namely North-Eastern States, Andhra Pradesh, Chhattisgarh, Gujarat, Jharkhand, Karnataka, Madhya Pradesh, Maharashtra, Orissa, Rajasthan and West Bengal. However, other states too are subjected to the malaria outburst. Even if after several steps carried out, the complete eradication of the risk of malaria emergence and transmission is not possible (Ray et al. 1988). North east India has a subtropical/tropical climate and is characterized by rich biodiversity, heavy precipitation and high seismicity. The seasons are divided into hot, humid summers, severe monsoons and mild winters (Procter et al. 1998). The region receives heavy to extreme heavy rain during the south-west monsoon (June to September) with a minimum threshold of 100 cm. Mawsynram in the NE India receives a mean annual rainfall of 1150 cm, highest in the entire world. Due to varied terrain location the region witnesses high climate variability. The signature of climate change is also seen in this region through the frequent calamities such as droughts, floods and melting Himalayan glaciers in recent years (Das et al. 2009). In summer, temperature in plains is between 30 and 33 °C whereas hilly region has a temperature range of 15–20 °C. Mean January temperature is around 16 °C in Assam and the mountainous region has a temperature varying between a sub-zero to a maximum of 14 °C (Dikshit et al. 2014). The mean relative humidity lies between 70 and 85% almost around the year which is the maximum in the country (Jhajharia et al. 2009). The major focal disease outbreaks are seen in areas where the dense forest cover is observed; states such as Odisha, Chhattisgarh, states of north-east India etc. and these states witness high morbidity and mortality (Dash et al. 2008).
The heavy rainfall and relative humidity of the north-eastern states provide the ecology needed for the malaria proliferation, survival and longevity (Dev et al. 2003). Many studies have suggested that the P.falciparum is the main contributor in malaria spread in the NE India region (Dash et al. 2008; Dhiman et al. 2010; Patra and Dev 2004; Sharma 1999). P.vivax also contributes to malaria outbreaks throughout the year, having peak outburst during the rainy season. The highest cases are observed in the states of Arunachal Pradesh and Nagaland (Sharma et al. 2015).
As ENSO controls the global weather and climate system, a number of studies have also been carried out to understand the effect of ENSO on malaria incidence across the globe. This will help in the measures to be taken to mitigate the malaria transmission and outbreak during ENSO years. Comparing the number of cases in a year with the decadal average, it had been observed that, during El-nino the cases were more and during La-nina, the incidences were less (Bhattacharya et al. 2006). The results of a study carried out over many countries in South America gave a statistically significant effect of dry years on malaria (Gagnon et al. 2002). Similar results were observed in another study over the southern region of Africa, where the epidemic was predominant during La-nina years when compared to normal incidence (Mabaso et al. 2007). Observations in regions of Punjab showed that malaria was more endemic in a wet monsoon year followed by dry El-nino and in Ceylon, the incidence was significantly more widespread during El-nino year than the other years (Bouma and Kaay 1996). An intense El-nino supported the increase in malaria cases in Meghalaya and La-nina supported the outbreak in Manipur, Mizoram and Sikkim (Dhiman and Sarkar 2017). Thus, to control and minimize the risk of epidemic, understanding the factors affecting the mechanism of the disease at regional level is of greater importance. The main objective of the present study is to understand the inter dependency of major meteorological parameters which in turn could influence the Malaria outburst and secondly quantify and classify the role of each of the parameters which influences more to the Malaria load at state scale in the NE India. This study emphasizes the regional aspect rather than the whole NE state.
Study area, data and methodology
Study area
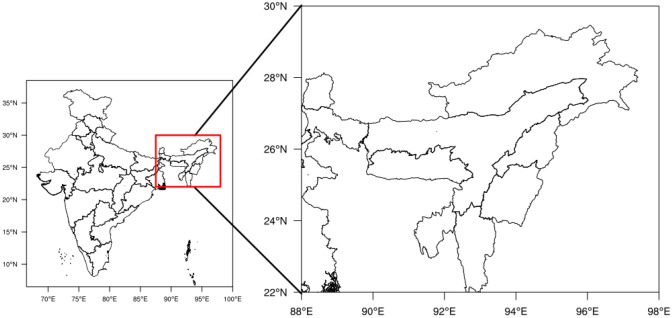
The area under the study is the whole north eastern region of India spread between 22° and 29°75′ north latitude and 88°–97°25′ east longitude. It comprises 8 states namely Arunachal Pradesh, Assam, Manipur, Meghalaya, Mizoram, Sikkim and Tripura (Fig. 1), covering an area of 2,55,168 km2. Geographically these states share their boundaries with eastern Himalaya, river basins and neighbouring countries.
Fig. 1.
Study area, north-east states of India
Data collection
The meteorological data needed for the study is obtained from Indian Meteorological Department (IMD), Pune for the years 1993–2018 (http://www.imdpune.gov.in). Meteorological parameters included daily rainfall (0.25° × 0.25°) mean temperature, maximum temperature and minimum temperature (1° × 1° each), relative humidity (2.5° × 2.5°) and soil moisture (2° × 2°). The malaria data used for years 1993–2018 was collected from National Vector Borne Disease Control Programme (NVBDCP), Ministry of Health & Family Welfare, Government of India (https://www.nvbdcp).
Methodology
Annual time series analysis and Pearson’s coefficient of correlation (CC) calculations for malaria incidence and the meteorological parameters were carried for all the 8 states in north-east India. For robust estimation, the analysis is done at 95% confidence level and if the two-tailed probability value was less than this confidence level (p ≤ 0.05), the CC was considered statistically significant. Apart from this, to understand the interdependency of weather parameters in each of the 8 states, correlation matrix is calculated for each of the NE states.
Regression analysis
Multiple regression models were used to understand the strength of relationship between the malaria incidence and different meteorological parameters. Coefficient of determination (R2) was obtained to know the overall accuracy of the regression done for each of the states. From the One-way analysis of variance (ANOVA) table, F-values were calculated, for each state. F-Test signifies the fit of the regression model with the available datasets. If the observed p-value of F-test was less than the significance level (0.05), then the regression model fits the data better than the intercept-only model.
The number of malaria cases was modelled as a function of weather parameters in terms of regression analysis. The correlation analysis between malaria incidence and meteorological parameters were ascertained during the ENSO (El-nino and La-nina) episodes to understand the effect of large scale climate patterns on malaria incidence and transmission.
Results and discussion
Correlation analysis was carried for each state between malaria cases and meteorological parameters (Figs. 2,3,4,5,6,7,8,9). The interdependence of every parameter in each state was understood using correlation matrix. In the following discussions, RF stands for rainfall, Tmax, Tmin and Tmean stands for maximum, minimum and mean temperature respectively, RH is relative humidity and SM is soil moisture. Also, AP is Arunachal Pradesh, AS is Assam, MA is Manipur, ME is Meghalaya, MZ is Mizoram, NA is Nagaland, SK is Sikkim and TR is Tripura. The state wise results are summarized below.
Fig. 2.
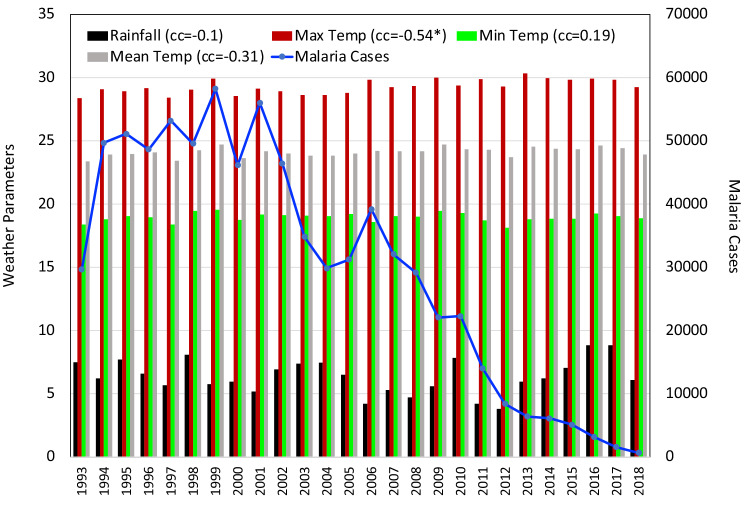
Time series analysis and coefficient of correlation between meteorological parameter and malaria cases in Arunachal Pradesh. * indicates that the values are statistically significant at 95% confidence level
Fig. 3.
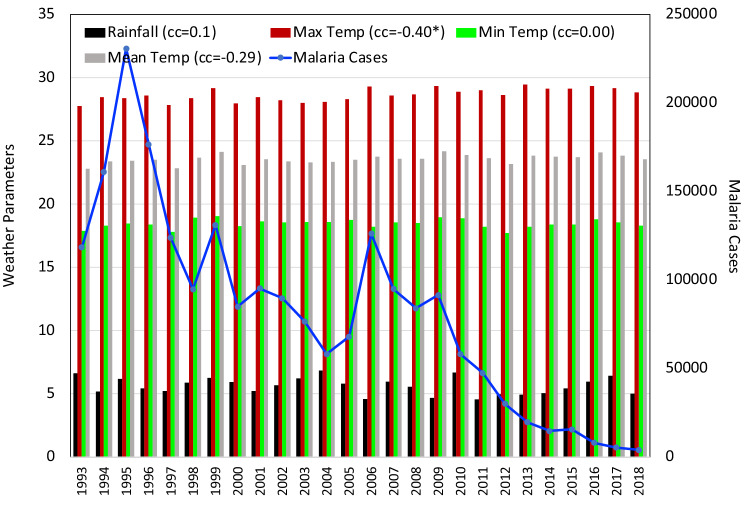
Same as Fig. 2 for the state of Assam
Fig. 4.
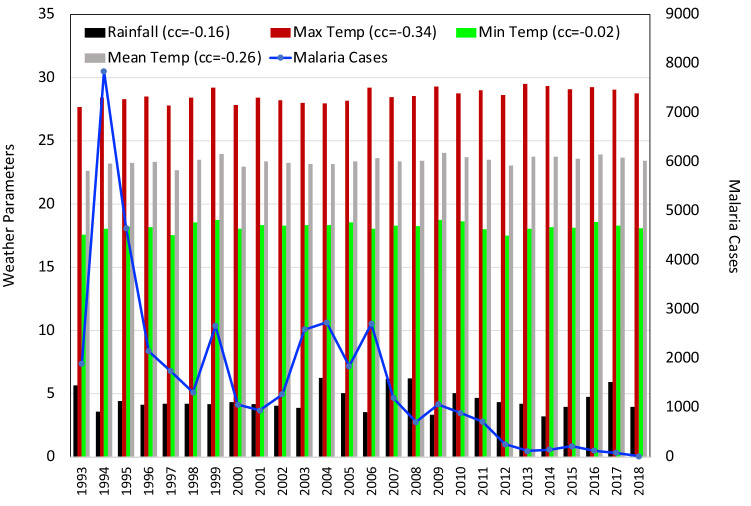
Same as Fig. 2 for the state of Manipur
Fig. 5.
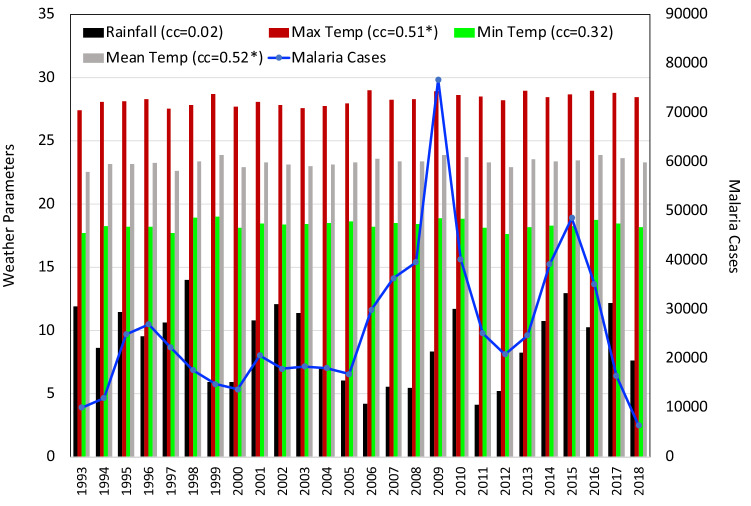
Same as Fig. 2 for the state of Meghalaya
Fig. 6.
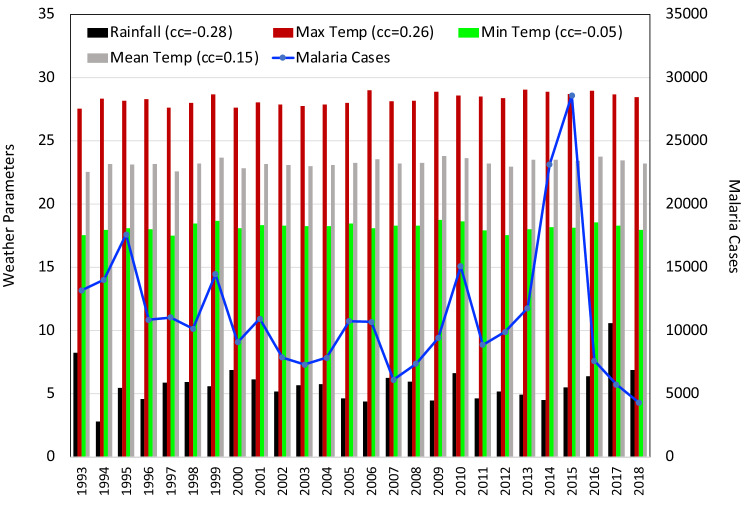
Same as Fig. 2 for the state of Mizoram
Fig. 7.
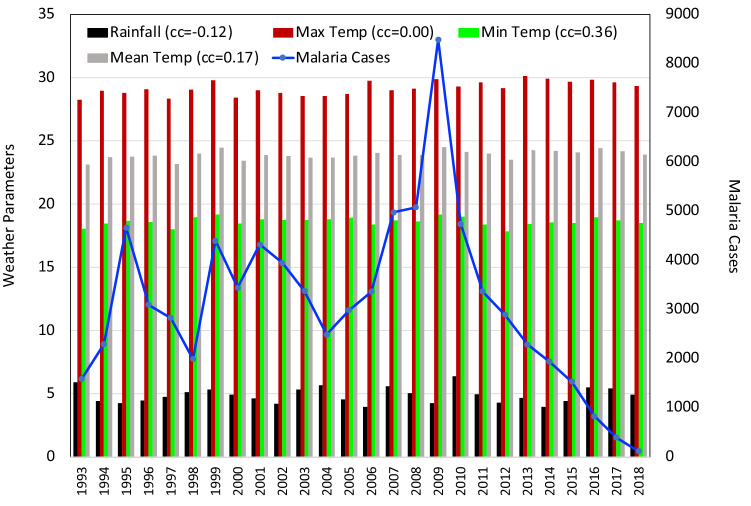
Same as Fig. 2 for the state of Nagaland
Fig. 8.
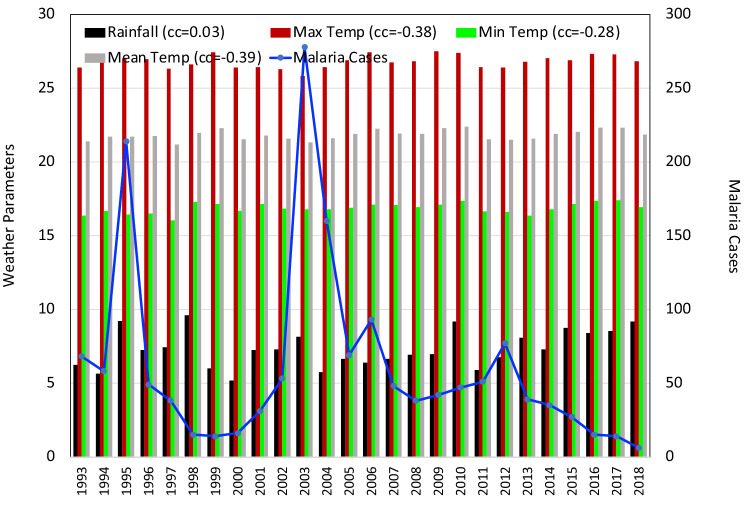
Same as Fig. 2 for the state of Sikkim
Fig. 9.
Same as Fig. 2 for the state of Tripura
Arunachal Pradesh
The interdependency of climate parameters in terms of a correlation analysis showed that maximum positive correlation was observed between Tmax and Tmean (+ 0.88). Weakest positive correlation was seen between RF and Tmean (+ 0.08). Weakest negative correlation was observed between SM and Tmean ( − 0.03) and moderate negative dependence was found between RH and Tmean ( − 0.59) in the state of Arunachal Pradesh. In Arunachal Pradesh the number of malaria cases varied between 30,000 and 60,000 from 1993 to 2010. But, cases showed a sharp decrease from 2011 to 2018. Correlation analysis presented in Fig. 2 revealed that the climate parameters are negatively correlated to malaria cases except for the Tmin (+ 0.19). Out of these, parameters that are observed to be significant are Tmax ( − 0.54) and SM ( − 0.46). There was hardly any relation between the annual malaria situation and RH.
Assam
In the state of Assam also strong positive correlation was observed between Tmax and Tmean (+ 0.88). Least negative correlation was observed between RF and Tmean ( − 0.14) and a moderate negative coefficient between RH and Tmin ( − 0.52). Among north-eastern states, Assam had registered the highest number of malaria cases, with over 2,00,000 cases and the highest death toll in the year 1995. Analysis presented in Figs. 3 indicates that only statistically significant negative correlation in state was observed between malaria cases and Tmax ( − 0.40). Tmin has shown no correlation at all with the malaria numbers. A bare minimum positive correlation was obtained in case of RF (+ 0.1) received over the state of Assam. Very weak to weak negative correlation was obtained between malaria cases and the Tmean ( − 0.29), RH ( − 0.09) and SM ( − 0.30) in the state of Assam.
Manipur
The correlation matrix for the state of Manipur showed a strong positive correlation between Tmax and Tmean (+ 0.90) only. RH and Tmax ( − 0.07) revealed the weakest negative correlation in the state of Manipur and a moderate negative correlation was detected between RH and Tmin ( − 0.47). The state of Manipur had witnessed a violent malaria outbreak in the year 1994. A total of 7,845 cases were reported. Apart from this, the number of cases were less for the rest of the years under study (Fig. 4). Only during the 1994 outbreak, the death toll reached a maximum of 55. Correlation analysis as presented in Fig. 4 revealed that no meteorological parameter played a statistically significant role in the malaria situation. RH was the only positively correlated parameter and the correlation was very weak (+ 0.15) with the malaria outbreak. All the other parameters were negatively correlated. Among these, Tmax had a relatively moderate correlation with the malaria epidemic ( − 0.34).
Meghalaya
The correlation matrix for the state of Meghalaya revealed a strong positive correlation between Tmax and Tmean (+ 0.88) and a negligible correlation between SM and Tmean(+ 0.08). The negative correlation observed between Tmean and rainfall was negligible ( − 0.09) and a moderately weak negative correlation between RH and Tmean ( − 0.32). In Meghalaya (Fig. 5), the maximum number of malaria cases reported were 76,759 in 2009. The decrease in malaria cases in the state was not considerable. In 2018, 6,394 cases were reported with 6 casualties. A statistically significant moderate positive correlation was seen in case of Tmax (+ 0.51) and Tmean (+ 0.52) with the malaria numbers in the state of Meghalaya. RF showed a negligibly small correlation with malaria occurrence (+ 0.02). RH( − 0.26) and SM( − 0.17) showed a very weak negative correlation.
Mizoram
The correlation matrix shows Tmax and Tmean (+ 0.88) has a strong relation in the state of Mizoram and no correlation at all between RF and Tmin. Negative correlation between RH and Tmean and between SM and Tmax ( − 0.08) was also observed. The correlation between RH and Tmin was moderately negative ( − 0.34). In the state of Mizoram (Fig. 6) in the years 1995, 2010, 2014 and 2015 the number of malaria cases crossed a margin of 15,000. For the rest of the years under study, the cases varied from 4000 to 15,000. There was no sharp decrease in the number of cases as seen in Arunachal Pradesh and Assam. No parameter had a statistically significant effect on the malaria outburst in the state of Mizoram. The coefficient values observed were either very weak or weak or moderate. The positive correlation observed in case of Tmax can be considered small (+ 0.26) and the negative value observed in case of SM ( − 0.37) can be associated with epidemic moderately.
Nagaland
In Nagaland, the correlation matrix showed that a solid positive correlation between Tmax and Tmean (+ 0.89) and a weak correlation between RF and RH and also between Tmean and SM (+ 0.16). A very weak negative correlation was observed between RF and Tmean ( − 0.07) and a moderately negative correlation between RH and Tmin ( − 0.38). In Nagaland (Fig. 7) the cases reported of malaria were much less than 5000 except for the year 2009. In this year, a total of 8,489 cases were reported. In 1994, a death toll of 253 was reported in the state which was highest in all of the north-eastern states till 2018. After this outbreak, the number of cases had decreased greatly. In 2018, 113 cases were reported with zero casualties. In the state of Nagaland, meteorological parameters that were statistically significant were RH ( − 0.42) and SM ( − 0.59). Very small negative correlation ( − 0.12) was observed in case of RF. Tmax displays no correlation in the state. Tmin and Tmean showed a moderate and small (+ 0.36) and weak (+ 0.17) correlation with vector-borne malaria respectively.
Sikkim
The correlation matrix for Sikkim revealed that a very strong positive correlation between Tmax and Tmean (+ 0.90) and no correlation between SM and Tmean ( − 0.01) and a very small negative correlation between RH and Tmax ( − 0.18). For Sikkim (Fig. 8), the number of cases reported and the deaths due to malaria were extremely less in comparison with all the other north-eastern states. The maximum cases reported were 278 in 2008. But there were no deaths that year. Only one death due to malaria was reported so far in the state which was in 2009. The correlation analysis done in the state of Sikkim revealed that the coefficient values were mostly negative with an exception of positively correlated RF. This positive correlation was also negligibly small (+ 0.03). In the case of the meteorological parameters Tmax ( − 0.38), Tmin ( − 0.28), Tmean ( − 0.39) and SM ( − 0.24), a moderate negative correlation was seen. It can be understood that no parameter plays a statistically significant role in the malaria situation in the state.
Tripura
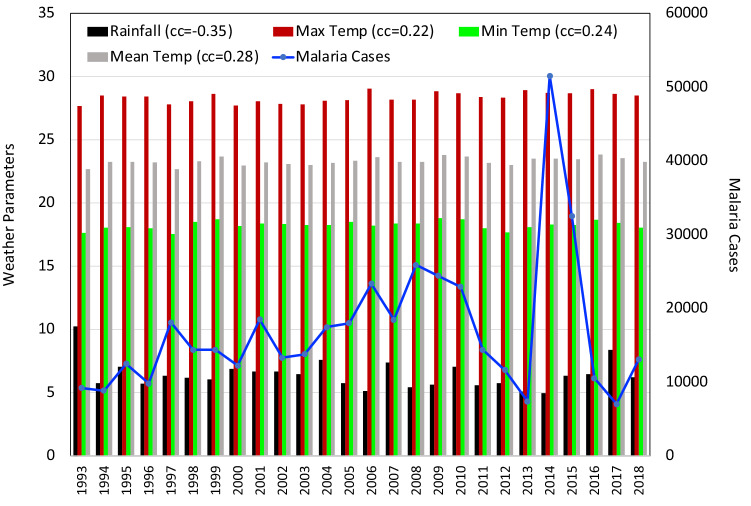
In the state of Tripura the interdependency results showed a strong positive correlation between Tmax and Tmean (+ 0.87) and negligibly small correlation between RH and Tmax (+ 0.03). SM and Tmin were correlated very weakly ( − 0.10) and a moderate negative correlation was seen between RF and Tmax ( − 0.46). Tripura witnessed (Fig. 9), the maximum number of cases reported 51,540 in the year 2014 with maximum malaria deaths of 96 persons in the year. In this states, only significant parameter was SM ( − 0.49) which was associated with the malaria cases but negatively. RF ( − 0.35) and RH ( − 0.32) too have seen a moderate negative correlation with the malaria epidemic in the state of Tripura. The correlation seen in case of Tmax (+ 0.22), Tmin (+ 0.28) and Tmean (+ 0.28) temperatures was moderately small.
Based on the correlation matrix analysis for all the states to quantify the interrelation of the meteorological parameters, it is inferred that a very strong correlation was observed between Tmax and Tmean in all the states of the north eastern region in India, with values varying between 0.87 and 0.90. Among these, highest positive correlation was observed in the states Manipur and Sikkim. Similarly rainfall had a positive link with the RH and SM in most of the states.
The results (as presented in Figs. 2,3,4,5,6,7,8,9) summarized that malaria cases had significant negative relation with Tmax (in Arunachal Pradesh and Assam), SM (Arunachal Pradesh, Nagaland and Tripura), RH (Nagaland) and strong positive association only with Tmax and Tmean in the state of Meghalaya. Based on correlation analysis (Figs. 2,3,4,5,6,7,8,9) observed in the year of maximum malaria cases in every state of the north-east region, it could be possible to give a favourable range of these parameters that could possibly account for the malaria outbreak. For rainfall, the highest number of malaria cases were reported when the annual rainfall was between 1500 and 2600 mm. In case of Tmax, Tmin and Tmean, malaria cases were highest for the thermometer reading 28°–30 °C, 18°–19 °C and 23°–25 °C respectively. The suitable percentage of relative humidity found to be 70 to 90% for the malaria incidences and transmission in the study region, which was also observed in earlier work (Bhattacharya et al. 2006) during the months May to Oct in the Indian region. RH observed to be varies from 70 to 92% with high variability in states like Arunachal Pradesh (86–92%), Nagaland (80–89%) and Assam (80–88%) whereas other states witnessed RH varies from 75 to 85%. The SM ranged between 0.26 and 0.34, and was observed to be fit for malaria incidence and outbreak in NE India. Annual averaged Soil Moisture seems to be high in Sikkim, Arunachal Pradesh (0.34–0.36) and in other six states it ranges from 0.27 to 0.32.
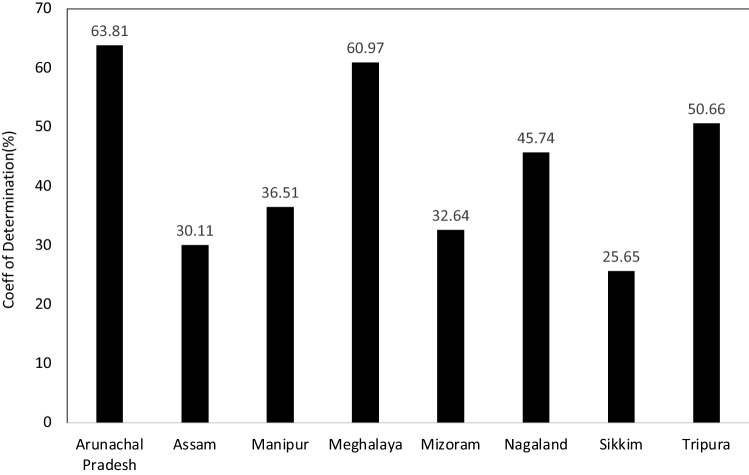
The variation in the number of malaria cases because of the combined impact of all the climate parameters are classified for each of the states in NE India in terms of the coefficient of determination i.e. R2 (Fig. 10). The figure clearly indicates that the malaria cases were associated with climate mostly in the state of Arunachal Pradesh (64%), Meghalaya (61%), Tripura (51%) and Nagaland (46%) whereas, the dependency was least in Assam (30%) and Sikkim (26%). Hence the predictability of malaria cases using the predicted weather parameters can be easily integrated for the states like Arunachal Pradesh, Meghalaya, Tripura and Nagaland.
Fig. 10.
State wise analysis of coefficient of determination which represents the net impact of weather parameters on malaria cases in north-east India
One-Way Analysis of Variance (ANOVA) which reveals if there are any statistical differences between the means of the climate parameters and malaria cases is presented in Table 1 and the results for north-eastern states are also given in the same table. It represents the impact of climate parameters on malaria cases in 8 different states. The degrees of freedom for the calculation are 6 and 19. The observed p-value is considered to be significant for p ≤ 0.05. Arunachal Pradesh, Meghalaya, Nagaland and Tripura have seen a statistically significant impact of climate parameters on the malaria situation across the state which are also supported in the determination analysis. Out of these states, malaria in Arunachal Pradesh and Meghalaya was observed to be most significantly impacted by the meteorological parameters under study. For the states of Assam, Manipur, Mizoram and Sikkim, the effect of meteorological parameters on the state-wide malaria was not of statistical significance based on the ANOVA results.
Table 1.
ANOVA results for north-eastern states
| States | Arunachal Pradesh | Assam | Manipur | Meghalaya | Mizoram | Nagaland | Sikkim | Tripura |
|---|---|---|---|---|---|---|---|---|
| F(6,19) | 5.58 | 1.36 | 1.82 | 4.95 | 1.53 | 2.66 | 1.09 | 3.25 |
| p-value | .001* | .278 | .148 | .003* | .220 | .047* | .402 | .022* |
*Bold indicates the values are statistically significant at 95% confidence level
Climate-malaria correlation during El-nino and La-nina years in NE India
The results of correlation analysis between malaria cases and climate parameters during composite El-nino and La-nina years are presented in Table 2 and 3respectively. During El-nino years, the statistically strongest correlation was observed between Tmax and number of malaria cases (+ 0.94) in the state Meghalaya. For the same state, the impact of Tmean was also of statistical significance (+ 0.88). A strong negative correlation was observed between RH and malaria cases in Nagaland ( − 0.89) during the el-Nino years. Similarly, during La-nina years, only RH was observed to have a strong negative correlation with the malaria outbreak ( − 0.84) in the state of Manipur. Rest of the parameters were of no statistical significance indicating least/no association of la-nina with the regional malaria incidence.
Table 2.
The coefficients of correlation between malaria and climate parameters in states in NE India during the El-nino years
| Rainfall | Maximum temp | Minimum temp | Mean temp |
Relative humidity | Soil moisture | |
|---|---|---|---|---|---|---|
| Arunachal Pradesh | − 0.28 | − 0.81 | − 0.37 | − 0.73 | 0.26 | − 0.10 |
| Assam | − 0.32 | − 0.49 | − 0.25 | − 0.43 | − 0.46 | − 0.76 |
| Manipur | 0.82 | − 0.69 | − 0.09 | − 0.50 | 0.34 | 0.13 |
| Meghalaya | − 0.07 | 0.94* | 0.61 | 0.88* | − 0.36 | − 0.04 |
| Mizoram | 0.15 | 0.47 | − 0.15 | 0.22 | 0.63 | − 0.58 |
| Nagaland | − 0.46 | 0.49 | 0.69 | 0.63 | − 0.89* | − 0.49 |
| Sikkim | − 0.83 | − 0.24 | − 0.04 | − 0.16 | 0.05 | 0.55 |
| Tripura | − 0.49 | 0.80 | 0.33 | 0.62 | 0.47 | 0.13 |
*Bold indicates the values are statistically significant at 95% confidence level
Table 3.
The coefficients of correlation between malaria and climate parameters in states in NE India during the La-nina years
| Rainfall | Maximum temp | Minimum temp | Mean temp | Relative humidity | Soil moisture | |
|---|---|---|---|---|---|---|
| Arunachal Pradesh | 0.30 | − 0.23 | 0.54 | 0.07 | − 0.31 | − 0.33 |
| Assam | 0.43 | 0.12 | 0.57 | 0.32 | − 0.77 | − 0.36 |
| Manipur | − 0.36 | 0.48 | 0.65 | 0.60 | − 0.84* | 0.29 |
| Meghalaya | 0.12 | 0.23 | 0.06 | 0.29 | 0.49 | 0.55 |
| Mizoram | 0.07 | 0.39 | 0.74 | 0.78 | − 0.20 | 0.32 |
| Nagaland | 0.65 | 0.17 | 0.18 | 0.24 | − 0.44 | 0.04 |
| Sikkim | 0.05 | − 0.24 | − 0.12 | − 0.04 | 0.21 | 0.37 |
| Tripura | 0.54 | 0.14 | 0.50 | 0.62 | 0.44 | 0.61 |
*Bold indicates the value is statistically significant at 95% confidence level
Conclusion
Correlation analysis between the number of cases and major meteorological parameters revealed that a negative correlation of statistical significance was observed for maximum temperature and soil moisture in three out of eight states in the North East Indian region, which is prone to malaria disease. Two states Nagaland and Meghalaya showed a significant correlation of mean temperature and relative humidity with the malaria situation. Correlation of rainfall (Akhtar et al. 1996; Bhattacharya et al. 2006; Singh et al. 2002) and minimum temperature with malaria epidemic did not show statistically significant effect. The study was successful in giving a favourable meteorological condition for the vector production and transmission. The results of correlation matrix presenting interdependency of weather parameters showed that a very high positive coefficient of correlation was observed between maximum and mean temperature in the entire region of north eastern states and, except for three states, a minimum negative coefficient of correlation was observed between minimum temperature and relative humidity. ANOVA results showed that malaria in Arunachal Pradesh is observed to be most significantly impacted by the net effect of all the meteorological parameters followed by Meghalaya, Tripura and Nagaland. El-nino has some impact while la-nina seems to be not affecting the malaria situations in the region. These findings will surely help the researchers in modelling the malaria incidences and preparing the mitigation strategies at state and regional level in place of taking a unilateral approach for the whole NE India region for pro-active health care.
Author contribution
Conceptualization: KC and NP; Analysis and Investigation: All authors; Writing- Original draft preparation: KC, NP and MB; Supervision: KC.
Funding
The author would like to acknowledge DST/ICPS for the project funding and IMD for providing the climate data and National Vector Borne Disease Control Programme (NVBDCP), Ministry of Health & Family Welfare, Government of India, for the malaria data. Also acknowledge Head, CSIR 4PI for support and encouragement.
Data availability
Data is collected from IMD and NVBDCP.
Declarations
Conflict of interest
The authors declare no competing interests.
Footnotes
Publisher's Note
Springer Nature remains neutral with regard to jurisdictional claims in published maps and institutional affiliations.
References
- Afrane YA, Lawson BW, Githeko AK, Yan G. Effects of microclimatic changes caused by land use and land cover on duration of gonotrophic cycles of Anopheles gambiae (Diptera: Cilicidae) in Western Kenya Highlands. J Med Entomol. 2005;42(6):974–980. doi: 10.1093/jmedent/42.6.974. [DOI] [PubMed] [Google Scholar]
- Akhtar R, McMichael AJ. Rainfall and malaria outbreaks in Western Rajasthan. Lancet. 1996;348(9039):1457–1458. doi: 10.1016/S0140-6736(04)70109-9. [DOI] [PubMed] [Google Scholar]
- Arab A, Jackson MC, Kongoli C. Modelling the effects of weather and climate on malaria distributions in West Africa. Malar J. 2014;13:1–9. doi: 10.1186/1475-2875-13-126. [DOI] [PMC free article] [PubMed] [Google Scholar]
- Bhattacharya S, Sharma C, Dhiman RC, Mitra AP. Climate change and malaria in India. Curr Sci. 2006;90(3):369–375. [Google Scholar]
- Bouma MJ, van der Kaay HJ. The El Niño Southern Oscillation and the historic malaria epidemics on the Indian subcontinent and Sri Lanka: An early warning system for future epidemics? Trop Med Int Health. 1996;1(1):86–96. doi: 10.1046/j.1365-3156.1996.d01-7.x. [DOI] [PubMed] [Google Scholar]
- Bruce-Chwatt LJ. Essential malariology. William Heinemann Medical Books Ltd; 1985. [Google Scholar]
- Burkett-Cadena ND, Vittor AY. Deforestation and vector-borne disease: forest conversion favors important mosquito vectors of human pathogens. Basic Appl Ecol. 2018;26:101–110. doi: 10.1016/j.baae.2017.09.012. [DOI] [PMC free article] [PubMed] [Google Scholar]
- Das A, Ghosh PK, Choudhury BU, Patel DP, Munda GC, Ngachan SV, Chowdhury P (2009) Climate change in North East India: recent facts and events–worry for agricultural management. In: Proceedings of the workshop on impact of climate change on agriculture (Vol 2009, pp 32–37).
- Dash AP, Valecha N, Anvikar AR, Kumar A. Malaria in India: challenges and opportunities. J Biosci. 2008;33:583–592. doi: 10.1007/s12038-008-0076-x. [DOI] [PubMed] [Google Scholar]
- Dev V, Bhattacharyya PC, Talukdar R. Transmission of Malaria and its Control in The Northeastern Region of India. J Assoc Phys India. 2003;51:1073–1082. [PubMed] [Google Scholar]
- Dev V, Sharma VP (2013) The dominant mosquito vectors of human malaria in India. In: Manguin S, editor. Anopheles mosquitoes- New insights into malaria vectors. IntechOpen.
- Dhiman RC, Sarkar S. El Niño Southern Oscillation as an early warning tool for malaria outbreaks in India. Malar J. 2017;16(1):1–7. doi: 10.1186/s12936-017-1779-y. [DOI] [PMC free article] [PubMed] [Google Scholar]
- Dhiman S, Baruah I, Singh L. Military malaria in northeast region of India. Def Sci J. 2010;60(2):213. doi: 10.14429/dsj.60.342. [DOI] [Google Scholar]
- Dhiman RC, Pahwa S, Dash AP (2008) Climate change and malaria in India: Interplay between temperature and mosquitoes. In Regional Health Forum (Vol. 12, No. 1, pp. 27–31). New Delhi, India: World Health Organization South-East Asia Region.
- Dikshit KR, Dikshit JK. North-east India: Land, people and economy. Dordrecht: Springer, Netherlands; 2014. [Google Scholar]
- Fischer L, Gültekin N, Kaelin MB, Fehr J, Schlagenhauf P. Rising temperature and its impact on receptivity to malaria transmission in Europe: a systematic review. Travel Med Infect Dis. 2020;36:101815. doi: 10.1016/j.tmaid.2020.101815. [DOI] [PubMed] [Google Scholar]
- Gagnon AS, Smoyer-Tomic KE, Bush AB. The El Niño southern oscillation and malaria epidemics in South America. Int J Biometeorol. 2002;46:81–89. doi: 10.1007/s00484-001-0119-6. [DOI] [PubMed] [Google Scholar]
- Githeko AK, Lindsay SW, Confalonieri UE, Patz JA. Climate change and vector-borne diseases: a regional analysis. Bull World Health Organ. 2000;78(9):1136–1147. [PMC free article] [PubMed] [Google Scholar]
- Guerra CA, Snow RW, Hay SI. A global assessment of closed forests, deforestation, and malaria risk. Ann Trop Med Parasitol. 2006;100(3):189–204. doi: 10.1179/136485906X91512. [DOI] [PMC free article] [PubMed] [Google Scholar]
- Hussien HH. Malaria's association with climatic variables and an epidemic early warning system using historical data from Gezira State Sudan. Heliyon. 2019;5(3):e01375. doi: 10.1016/j.heliyon.2019.e01375. [DOI] [PMC free article] [PubMed] [Google Scholar]
- India’s Initial National Communication (INC) (2004) India’s Initial National Communication (INC) to UNFCCC. Ministry of Environment and Forests, Government of India, New Delhi
- Jepson WF, Moutia A, Courtois C. The malaria problem in Mauritius: the bionomics of Mauritian anophelines. Bull Entomol Res. 1947;38(1):177–208. doi: 10.1017/S0007485300030273. [DOI] [PubMed] [Google Scholar]
- Jhajharia D, Shrivastava SK, Sarkar D, Sarkar S. Temporal characteristics of pan evaporation trends under the humid conditions of northeast India. Agric for Meteorol. 2009;149(5):763–770. doi: 10.1016/j.agrformet.2008.10.024. [DOI] [Google Scholar]
- Kar NP, Kumar A, Singh OP, Carlton JM, Nanda N. A review of malaria transmission dynamics in forest ecosystems. Parasit Vectors. 2014;7:1–12. doi: 10.1186/1756-3305-7-265. [DOI] [PMC free article] [PubMed] [Google Scholar]
- Kovats RS, Campbell-Lendrum DH, McMichael AJ, Woodward A, Cox JSH. Early effects of climate change: Do they include changes in vector-borne diseases? Philosophical transactions of the royal society of London. Series B Biol Sci. 2001;356(1411):1057–1068. doi: 10.1098/rstb.2001.0894. [DOI] [PMC free article] [PubMed] [Google Scholar]
- Lindblade KA, Walker ED, Onapa AW, Katungu J, Wilson ML. Land use change alters malaria transmission parameters by modifying temperature in a highland area of Uganda. Trop Med Int Health. 2000;5(4):263–274. doi: 10.1046/j.1365-3156.2000.00551.x. [DOI] [PubMed] [Google Scholar]
- Mabaso ML, Kleinschmidt I, Sharp B, Smith T. El Niño Southern Oscillation (ENSO) and annual malaria incidence in Southern Africa. Trans R Soc Trop Med Hyg. 2007;101(4):326–330. doi: 10.1016/j.trstmh.2006.07.009. [DOI] [PubMed] [Google Scholar]
- Macdonald, G. (1957). The epidemiology and control of malaria. The Epidemiology and Control of Malaria
- Mahendran R, Pathirana S, Piyatilake ITS, Perera SSN, Weerasinghe MC. Assessment of environmental variability on malaria transmission in a malaria-endemic rural dry zone locality of Sri Lanka: the wavelet approach. PLoS ONE. 2020;15(2):115. doi: 10.1371/journal.pone.0228540. [DOI] [PMC free article] [PubMed] [Google Scholar]
- Malone JB, Poggi E, Igualada FJ, Sintasath D, Ghebremeskel T, Corbett JD et al (2003). Malaria environmental risk assessment in Eritrea. In: IGARSS 2003. 2003 IEEE international geoscience and remote sensing symposium. Proceedings (IEEE Cat. No. 03CH37477) (Vol 2, pp 1000–1003). IEEE
- Martens WJ, Niessen LW, Rotmans J, Jetten TH, McMichael AJ. Potential impact of global climate change on malaria risk. Environ Health Perspect. 1995;103(5):458–464. doi: 10.1289/ehp.95103458. [DOI] [PMC free article] [PubMed] [Google Scholar]
- Munga S, Minakawa N, Zhou G, Mushinzimana E, Barrack OOJ, Githeko AK, Yan G. Association between land cover and habitat productivity of malaria vectors in Western Kenyan Highlands. Am J Trop Med Hyg. 2006;74(1):69–75. doi: 10.4269/ajtmh.2006.74.69. [DOI] [PubMed] [Google Scholar]
- Patra SS, Dev V. Malaria related morbidity in central reserve police force personnel located in the north-eastern states of India. J Hum Ecol. 2004;15(4):255–259. doi: 10.1080/09709274.2004.11905702. [DOI] [Google Scholar]
- Patz JA. Predicting key malaria transmission factors, biting and entomological inoculation rates, using modelled soil moisture in Kenya. Trop Med Int Health Trop Med Int Health. 1998;3(10):818–827. doi: 10.1046/j.1365-3156.1998.00309.x. [DOI] [PubMed] [Google Scholar]
- Patz JA, Graczyk TK, Geller N, Vittor AY. Effects of environmental change on emerging parasitic diseases. Int J Parasitol. 2000;30(12–13):1395–1405. doi: 10.1016/S0020-7519(00)00141-7. [DOI] [PubMed] [Google Scholar]
- Petney TN. Environmental, cultural, and social changes and their influence on parasite infections. Int J Parasitol. 2001;31(9):919–932. doi: 10.1016/S0020-7519(01)00196-5. [DOI] [PubMed] [Google Scholar]
- Procter J, Haridasan K. How far north does lowland tropical rainforests go? Global Ecol Biogeogr Lett. 1998;7:141–146. doi: 10.2307/2997817. [DOI] [Google Scholar]
- Ray AP, Narasimham MVVL, Kondrachin AV, Bill AK (1988) P. falciparum containment programme (PFCP). Ten years of operation in India (1978–1988). Delhi: Directorate of National Anti Malarial Programme, 290
- Russell PF, West LS, Manwell RD, MacDonald G (1963) Practical malariology. Practical Malariology, Edn 2
- Sadoine ML, Smargiassi A, Ridde V, Tusting LS, Zinszer K. The associations between malaria, interventions, and the environment: a systematic review and meta-analysis. Malar J. 2018;17(1):1–11. doi: 10.1186/s12936-018-2220-x. [DOI] [PMC free article] [PubMed] [Google Scholar]
- Sena L, Deressa W, Ali A. Correlation of climate variability and malaria: a retrospective comparative study, southwest Ethiopia. Ethiop J Health Sci. 2015;25(2):129–138. doi: 10.4314/ejhs.v25i2.5. [DOI] [PMC free article] [PubMed] [Google Scholar]
- Sharma VP. Current scenario of malaria in India. Parassitologia. 1999;41(1–3):349–353. [PubMed] [Google Scholar]
- Sharma VP, Dev V, Phookan S. Neglected Plasmodium vivax malaria in northeastern States of India. Indian J Med Res. 2015;141(5):546. doi: 10.4103/0971-5916.159511. [DOI] [PMC free article] [PubMed] [Google Scholar]
- Singh N, Sharma VP. Patterns of rainfall and malaria in Madhya Pradesh, central India. Ann Trop Med Parasitol. 2002;96(4):349–359. doi: 10.1179/000349802125001113. [DOI] [PubMed] [Google Scholar]
- Vittor AY, Gilman RH, Tielsch J, Glass G, Shields T, Lozano WS, et al. The effect of deforestation on the human-biting rate of Anopheles darlingi, the primary vector of falciparum malaria in the Peruvian Amazon. Am J Trop Med Hyg. 2006;74(1):3–11. doi: 10.4269/ajtmh.2006.74.3. [DOI] [PubMed] [Google Scholar]
- Yasuoka J, Levins R. Impact of deforestation and agricultural development on anopheline ecology and malaria epidemiology. Am J Trop Med Hyg. 2007;76(3):450–460. doi: 10.4269/ajtmh.2007.76.450. [DOI] [PubMed] [Google Scholar]
- Zhong D, et al. Effects of microclimate condition changes due to land use and land cover changes on the survivorship of malaria vectors in China Myanmar border region. PLoS ONE. 2016;11(5):e0155301. doi: 10.1371/journal.pone.0155301. [DOI] [PMC free article] [PubMed] [Google Scholar]
Associated Data
This section collects any data citations, data availability statements, or supplementary materials included in this article.
Data Availability Statement
Data is collected from IMD and NVBDCP.


