

Abstract
The mTORC1 signaling pathway regulates cell growth and metabolism in a variety of organisms from yeast to human, and inhibition of the mTORC1 pathway has the prospect to treat cancer or achieve longevity. The tuberous sclerosis protein complex (TSCC) is a master negative regulator of the mTORC1 signaling pathway through hydrolyzing the GTP loaded on the small GTPase Rheb, which is a key activator of mTOR. However, the large size (~700 kDa) and complex structural organization of TSCC render it vulnerable to degradation and inactivation, thus limiting its potential application. In this work, based on thorough analysis and understanding of the structural mechanism of how the stabilization domain of TSC2 secures the association of TSC2‐GAP with Rheb and thus enhances its GAP activity, we designed two proteins, namely SSG‐MTM (short stabilization domain and GAP domain‐membrane targeting motif) and SSG‐TSC1N, which were able to function like TSCC to negatively regulate Rheb and mTORC1, but with much‐reduced sizes (~1/15 and ~ 1/9 of the size of TSCC, respectively). Biochemical and cell biological assays demonstrated that these designed proteins indeed could promote the GTPase activity of Rheb to hydrolyze GTP, inhibit the kinase activity of mTORC1, and prevent mTORC1 from down‐regulating catabolism and autophagy.
Keywords: mTORC1, protein engineering, Rheb, SSG‐MTM, SSG‐TSC1N, TSC2‐GAP, tuberous sclerosis protein complex
1. INTRODUCTION
The mechanistic target of rapamycin complex 1 (mTORC1) signaling pathway is a major signal transduction pathway regulating cell growth and metabolism in various organisms, including yeasts, nematodes, fruit flies, and mammals. The mTORC1 pathway mainly functions to positively regulate anabolism such as protein translation and lipid synthesis, as well as negatively regulate anabolism such as autophagy (Lin et al., 2021; Liu & Sabatini, 2020; Ramlaul & Aylett, 2018). Since metabolic homeostasis is progressively undermined with aging so that the rate of catabolism cannot match with that of anabolism in aged animals, inhibition of the mTORC1 pathway has been shown to restore the metabolic balance and effectively extend lifespan in various organisms such as C. elegans and D. melanogaster (Bjedov et al., 2010; Harrison et al., 2009; Powers et al., 2006; Zhou et al., 2019). In addition, in a variety of cancer types, there have been found mutations of genes in the mTORC1 signaling pathway, such as mtor, tsc1, and tsc2, suggesting that the mTORC1 pathway plays a key role in tumorigenesis (Gomez et al., 1999; Sato et al., 2010).
In the mTORC1 signaling pathway, the mTOR kinase plays a central role by forming a multi‐subunit protein complex, mTORC1 (Saxton & Sabatini, 2017). A small GTPase, Rheb, is the major positive regulator of mTORC1 signaling when it is loaded with GTP. On the other hand, the tuberous sclerosis protein complex (TSCC), consisting of the 130 kDa subunit TSC1/Hamartin, the 200 kDa subunit TSC2/Tuberin, and the 34 kDa subunit TBC1D7, functions as the main negative regulator of mTORC1 signaling (Dibble et al., 2012; Hoogeveen‐Westerveld et al., 2012). By employing the GTPase‐activating protein (GAP) domain located at the C‐terminal part of TSC2, which is homologous to RapGAP (Slegtenhorst et al., 1997), TSCC catalyzes the hydrolysis of the GTP molecule carried by Rheb to GDP, thus inhibiting Rheb and inactivating mTORC1 (Inoki et al., 2003). Mutations in TSC1 or TSC2 are underlying causes of the tuberous sclerosis complex syndrome, characterized by multiple benign tumors in brain, lung, heart, kidney, and skin, as well as a high incidence of neurological symptoms like autism, mental retardation, and epilepsy (Bjornsson et al., 1996; Henske et al., 2016).
Because of its central role in regulating metabolism and cell proliferation, mTORC1 has been a promising therapeutic target to treat cancer, diabetes, and autoimmune diseases. The classical small‐molecule mTORC1 inhibitor rapamycin and its derivatives such as everolimus, as well as other lately developed small‐molecule mTORC1 inhibitors such as torin, have been approved by Food and Drug Administration or under clinical trials for treatment of tumor and other diseases (Chen & Zhou, 2020; Meng & Zheng, 2015). However, therapeutic intervention targeting other key molecules in the mTORC1 signal transduction pathway (e.g., Rheb) has been lacking and underdeveloped.
In our previous work, we have determined the cryogenic electron microscopy (cryo‐EM) structure of human TSCC (Ramlaul et al., 2021). We found that TSCC forms an elongated scorpion‐like structure consisting of three major parts: a body, a pincer, and a tail. The “body” is mainly formed by the HEAT repeats of TSC2 on which the coiled coils from two TSC1 molecules run along and the GAP domains from two TSC2 molecules. The “pincer” is composed of the TSC1 core domains and the N‐terminal parts of TSC2 HEAT repeats domains, while the “tail” mainly comprises of TBC1D7 and the C‐terminal parts of TSC1 coiled coils (Gai et al., 2016; Ramlaul et al., 2021). Interestingly, some previous work (Hansmann et al., 2020; Marshall et al., 2009; Scrima et al., 2008) showed the TSC2‐GAP domain alone could stimulate hydrolysis of GTP on Rheb, but some other work found that the GAP domain of TSC2 alone did not exhibit similar capability to hydrolyze GTP on Rheb as holo‐TSCC (e.g., fig. 1(d) of Inoki et al., 2003) (Inoki et al., 2003; Yang et al., 2021).
In this work, based on a thorough structural analysis of the TSC2‐Rheb protein complex, we designed two proteins, namely SSG‐MTM (short stabilization domain and GAP domain‐membrane targeting motif [MTM]) and SSG‐TSC1N which possess potent GAP activities in vivo, but with much‐reduced sizes compared with holo‐TSCC. The SSG‐MTM protein is only 48 kDa, almost one‐fifteenth of the size of TSCC, which is ~700 kDa; while the SSG‐TSC1N protein is 77.4 kDa, about one‐ninth of TSCC. We have performed various biochemical and cell biological assays to corroborate that our designed proteins were indeed able to hydrolyze GTP on Rheb to GDP, down‐regulate the kinase activity of mTORC1, and promote catabolism and autophagy. In summary, we applied structure‐based protein engineering to design minimal TSC proteins with much reduced sizes which showed robust inhibiting activity toward Rheb and mTORC1.
2. RESULTS
2.1. Rationale for the design of proteins with potent GAP activity for Rheb but with much‐reduced sizes of TSCC
2.1.1. Analysis of the interaction between the stabilization domain and the GAP domain of TSC2
Our previous cryo‐EM structure of TSCC showed that two TSC2 molecules form a dimer, with the GAP domain of each TSC2 protein located next to the dimerization interface (Ramlaul et al., 2021). For reasons below, we renamed the domain mediating dimerization of TSC2 in TSCC as the stabilization domain. In agreement with our previous cryo‐EM structure, our alphafold2 calculation result also showed that two stabilization domain‐GAP domain fragments from two TSC2 molecules form a structure extremely similar to that in our cryo‐EM structure, which resides in the center of the “body” part of TSCC (Figure 1a) (Ramlaul et al., 2021). The stabilization domain of TSC2 consists of three fragments: the N‐segment (residues 1045–1082), the M‐segment (residues 1180–1242), and the C‐segment (residues 1494–1523) whose amino acid sequences are conserved from yeast to human (Figure S1). These three segments are separated in primary sequence (Figure S1) but are close in tertiary structure (Figure 1b). In between these three segments are intrinsically disordered loops that do not exhibit much conservation or possess any secondary structure (Figure S1).
FIGURE 1.

The stabilization domain and the GAP domain of TSC2 interact with each other. (a) Two stabilization domains (named as dimerization domain in Ramlaul et al.) and two GAP domains reside in the center of the “body” of human TSCC structure. Upper: cryo‐EM structure, lower: alphafold2‐predicted structure. (b) The alphafold2‐predicted structure of the stabilization domain, including the two long non‐conserved loops connecting the N‐, M‐, and C‐segments. (c) The alphafold2‐predicted structure of the GAP domain of TSC2. The N‐ and C‐helices, which do not exist in other GAP proteins such as RasGAP and RhoGAP, are shown in blue and red, respectively. (d) The TSC2‐GAP domain employs its N‐ and C‐helices to pack against the stabilization domain. (e) The stabilization domain uses the loops between the β strands of the N‐ and M‐segments as well as the C‐terminal end of the C‐segment to interact with the GAP domain. (f) Close‐up view of the binding interface between the stabilization domain and the GAP domain of TSC2. (g) Tumor‐targeting residues of the stabilization domain are mapped onto the surface of its structure, showing that many of them interact with the GAP domain (cyan). (h) Tumor‐targeting residues of the N‐ and C‐helices of the GAP domain are mapped onto its structural surface, which shows that many of them bind to the stabilization domain (magenta). (i) The GAP‐binding surface on the structure of the stabilization domain of TSC2 is highly conserved.
In TSC2, right next to the stabilization domain is the GAP domain (Figure 1a). It differs from canonical GAP domains (such as RapGAP) in that it possesses two additional α‐helices located at the N‐terminus and C‐terminus of the globular part of the GAP domain. Therefore, we named these two helices as the N‐helix and the C‐helix, respectively (Figure 1c). The TSC2‐GAP domain employs its N‐ and C‐helices to pack against the stabilization domain (Figure 1d). On the other hand, from the point of view of the stabilization domain, it uses the loops between the β strands of its N‐segment and M‐segment, as well as the C‐terminal end of its C‐segment, to interact with the GAP domain (Figure 1e). The stabilization domain and the GAP domain of TSC2 mainly use hydrophobic interaction to mediate their association, with non‐polar residues from both domains such as L1061, L1066, P1202, T1203, I1518, L1520, P1521 from the stabilization domain, and F1527, V1531, L1534, W1740, L1744, I1747, L1750, and I1754 from the GAP domain participating in the interaction (Figure 1f). In addition, the positively charged R1200 from the stabilization domain forms electrostatic interaction with the negatively charged D1535 from the GAP domain, and the amide group of N1205 from the stabilization domain accepts a hydrogen bond from the guanidine group of R1743 from the GAP domain (Figure 1f). Interestingly, these residues mediating the interaction between the stabilization domain and the GAP domain are targeted by tumorigenic mutations in patients with tuberous sclerosis syndrome. For the stabilization domain, R1200 is the most highly targeted residue, which is mutated as often as 46 times in the Leiden Open Variation Database (Figure 1g and Figure S2a). T1203, P1202, L1061, and L1066 from the stabilization domain are also mutated no less than five times in tuberous sclerosis complex patients (Figure 1g and Figure S2a). For the GAP domain, R1743 on the C‐helix is the most frequently mutated tumorigenic residue, with more than 130 entries recorded in the tuberous sclerosis database (Figure 1h and Figure S2b). D1535 on the N‐helix and L1750 on the C‐helix of the GAP domain is also mutated no less than five times in tuberous sclerosis patients (Figure 1h and Figure S2b). The GAP‐binding surface on the structure of the stabilization domain of TSC2 is highly conserved (Figure 1i). In addition, Inoki et al. verified that tumorigenic mutations of TSC2 targeting the stabilization domain and the GAP domain, such as R1200W and R1743P (which is R1745P in their numbering) displayed decreases in the ability to inhibit S6K phosphorylation, compared with wild‐type TSC2 (Inoki et al., 2002). Therefore, these results suggest that the stabilization domain and the GAP domain of TSC2 interact with each other, and the GAP activity of TSCC depends on this interaction.
2.1.2. The stabilization domain of TSC2 stabilizes the association between the GAP domain of TSC2 and Rheb
The Ras superfamily of small GTPases normally employs their switch I and II motifs to mediate the association with their corresponding GAP proteins. For example, in the crystal structure of Rap in complex with RapGAP, Tyr32 on the switch I loop and Thr61/Gln63/Phe64 on the switch II helix of Rap play key roles in recognizing RapGAP (Figure 2a) (Scrima et al., 2008). In the crystal structures of most of the small GTPases, for example, Ras, Rap, and Rho, the switch II motifs form fully developed three turns of α helices (Figure 2b), which would serve as robust anchoring points for the binding of their respective GAP proteins, such as RasGAP, RapGAP, and RhoGAP, respectively. In contrast, the switch II motif of Rheb only forms a half‐developed one turn of α helix (Figure 2b), which presumably would weaken the binding affinity between Rheb and its GAP protein, that is, TSC2 or TSCC. Using the alphafold2 method, we predicted the structure of Rheb in complex with TSC2‐GAP (Figure 2c). Interestingly, in this structure, we found that besides switch I and switch II, Rheb further uses another α helix (named as helix α3) to pack with the N‐ and C‐helices of TSC2‐GAP (Figure 2c), so as to compensate for the weakened interaction with TSC2‐GAP due to its half‐formed α helix of switch II. At this binding interface between the α3 helix of Rheb and the N‐ and C‐helices of TSC2‐GAP, non‐polar residues from both proteins, including TSC2‐L1533, TSC2‐P1538, TSC2‐A1742, Rheb‐Y67, and Rheb‐I69, form hydrophobic interactions among each other. In addition, negatively charged Rheb‐D105 makes electrostatic interaction with positively charged TSC2‐R1753 and hydrogen bonding interaction with TSC2‐S1530 (Figure 2d). Hence, the rather unique N‐ and C‐helices of TSC2‐GAP play a critical role in mediating the association between TSC2 and Rheb. On one hand, these two helices interact with Rheb, in particular its helix α3, in one direction. On the other hand, the stabilization domain of TSC2 packs against the N‐ and C‐helices of TSC2‐GAP from the opposite direction to Rheb (Figure 2e). In the absence of the stabilization domain of TSC2, the N‐ and C‐helices of TSC2‐GAP would tend to dissociate from Rheb due to spontaneous vibration. However, in the presence of the stabilization domain, the vibrational motion of the N‐ and C‐helices of TSC2‐GAP is restricted and thus their dissociation from Rheb is obstructed. Therefore, the stabilization domain functions to stabilize the interaction between TSC2‐GAP and Rheb. Indeed, when we analyzed the vibrational mode of the TSC2‐GAP using normal mode analysis (NMA), we found that the oscillation angle of the N‐ and C‐helices of TSC2‐GAP was as large as almost 90° in the absence of the stabilization domain (Figure 2f, left panel, Supplementary Movie 1). In contrast, in the presence of the stabilization domain, the oscillation range of the N‐ and C‐helices of the TSC2‐GAP was drastically decreased to ~48° (Figure 2f, right panel, Supplementary Movie 2).
FIGURE 2.

The stabilization domain of TSC2 stabilizes the association between the GAP domain of TSC2 and Rheb, as suggested by structure prediction and normal mode analysis modeling. (a) Rap employs its switch I and II motifs to associate with RapGAP in the crystal structure (PDB code 3BRW). (b) In the crystal structures of Rheb (PDB code 1XTS), Rap (PDB code 3BRW), Ras (PDB code 1WQ1), and Rho (PDB code 5M6X), the switch II motifs of Ras, Rap, and Rho form fully developed α helices, whereas the switch II motif of Rheb only forms a half‐developed α helix. (c) Besides switch I and switch II motifs, Rheb further uses its helix α3 to interact with the N‐helix and C‐helix of TSC2‐GAP in our alphafold2‐predicted structure of Rheb in complex with TSC2‐GAP. (d) Close‐up view of the interaction interface between TSC2‐GAP and Rheb. (e) The stabilization domain of TSC2 packs against the N‐ and C‐helices of TSC2‐GAP in the opposite direction to Rheb, thus restricts the movement of the N‐ and C‐helices of TSC2‐GAP and obstructs their dissociation from Rheb. (f) Normal mode analysis showed that the presence of the stabilization domain of TSC2 decreased the oscillation angle of the N‐ and C‐helices of TSC2‐GAP from 89.8° to 47.6°.
In summary, we conclude that because Rheb is an uncanonical small GTPase with a much‐shortened switch II helix, it has to reply on its α3 helix to interact with the N‐ and C‐helices of TSC2‐GAP in order to make compensation for the stability of the TSC2‐GAP–Rheb complex. The stabilization domain of TSC2 enhances the binding affinity between Rheb and TSC2‐GAP by preventing the dissociation of the N‐ and C‐helices of TSC2‐GAP from Rheb. This is consistent with the previous reports that TSC2‐GAP alone did not exhibit a potent activity to hydrolyze GTP carried by Rheb (fig. 1(d) of Inoki et al, 2003) (Inoki et al., 2003; Yang et al., 2021).
2.1.3. Design of the SSG‐MTM and SSG‐TSC1NTD proteins
TSCC, which is the GAP for Rheb, has a complicated structural organization (two copies of TSC1, two copies of TSC2, and one or two copies of TBC1D7) and a humongous size (~700 kDa), which render it biochemically difficult to work with (Sun et al., 2013). Based on our thorough understanding of the mechanism that the stabilization domain of TSC2 enhances the binding affinity of TSC2‐GAP for Rheb, we endeavored to design a protein to replace the function of TSCC but with a much‐reduced size. Since the stabilization domain of TSC2 plays a key role in stabilizing the binding between TSC2‐GAP and Rheb based on our analysis above, we supposed that a protein with the stabilization domain and the GAP domain of TSC2 would suffice to function as a minimal GAP protein for Rheb. With the observation that the N‐, M‐, and C‐segments of the stabilization domain are connected by long loops with very low conservation and almost no secondary structure, we thus used artificial short linkers to substitute for these two long loops to connect the three segments of the stabilization domain together (Figure 3a). This designed short stabilization domain has only 196 amino acids, but possesses a three‐dimensional structure almost the same as the original stabilization domain of human TSC2, as predicted by alphafold2 (Figure 3a). We used this artificial stabilization domain to assemble with the GAP domain of TSC2 and named the resulting protein as short stabilization domain‐GAP domain (SSG) protein. Considering that one of the major functions of the TSC1 subunit is to provide the lysosome‐localization capability for TSCC (Fitzian et al., 2021), we used two approaches to preserve this function of localizing to lysosomes. One approach is to use a short peptide derived from human Rheb, with a sequence of Cys‐Ser‐Val‐Met, which is employed by Rheb as a lysosomal membrane localization sequence (Takahashi et al., 2005). We named this sequence as the MTM and placed it at the C‐terminal end of the SSG protein designed above. Therefore, the SSG‐MTM protein consists of a shortened stabilization domain, the GAP domain, and a MTM at the C‐terminal end (Figure 3b). The molecular weight of the SSG‐MTM protein designed in this way is as low as 48.4 kDa, which is ~1/15 of the size of the TSCC protein complex. By alphafold2 prediction, the MTM of SSG‐MTM would point toward the same direction as that of Rheb (Figure 3c), which presumably would facilitate the binding of SSG‐MTM with Rheb when they are both localized on the lysosomal membrane. The other approach we used to localize SSG to lysosomes was to exploit the N‐terminal domain (NTD, residues 1–268) of human TSC1, which has been shown to be responsible for TSCC's localization to lysosomes (Fitzian et al., 2021). We placed human TSC1‐NTD at the C‐terminal end of SSG, thus forming an SSG‐TSC1N fusion protein (Figure 3d), which is 77.4 kDa. We expected that either approach would be able to localize the designed SSG protein to the lysosomal membrane so that it could interact with the lysosome‐located Rheb.
FIGURE 3.

Design of the SSG‐MTM and SSG‐TSC1N proteins which can negatively regulate Rheb and mTORC1. (a) The alphafold2‐predicted three‐dimensional structure of our designed short stabilization domain, with the two long loops between the N‐, M‐, and C‐segments replaced by short artificial linker sequences. (b) The three‐dimensional structure of the designed SSG‐MTM protein, as predicted by alphafold2. (c) The lysosomal membrane‐binding site of SSG‐MTM would point toward the same direction as that of Rheb, which presumably would facilitate the binding of SSG‐MTM with lysosomal membrane localized Rheb. (d) The three‐dimensional structure of the designed SSG‐TSC1N protein, as predicted by alphafold2.
2.2. Inhibition of Rheb and mTORC1 by the designed SSG‐MTM and SSG‐TSC1N proteins
As the next step, we performed biochemical and cell biological assays to verify that our designed SSG proteins indeed could function like GAP proteins for Rheb and inhibit the kinase activity of mTORC1.
First, we performed a GTPase activity assay in vitro. Our result showed that the GAP domain of human TSC2 alone did not possess the same GAP activity to hydrolyze GTP loaded on Rheb to GDP as strongly as the holo‐TSCC protein complex purified from human embryonic kidney 293f cells, which is similar to a previous finding (fig. 1(d) of Inoki et al., 2003), although it did stimulate the hydrolysis of GTP (Figure 4) (Inoki et al., 2003; Yang et al., 2021). Strikingly, our purified SSG‐MTM protein displayed an even higher GAP activity compared with TSC2‐GAP alone (Figures 4, S3).
FIGURE 4.
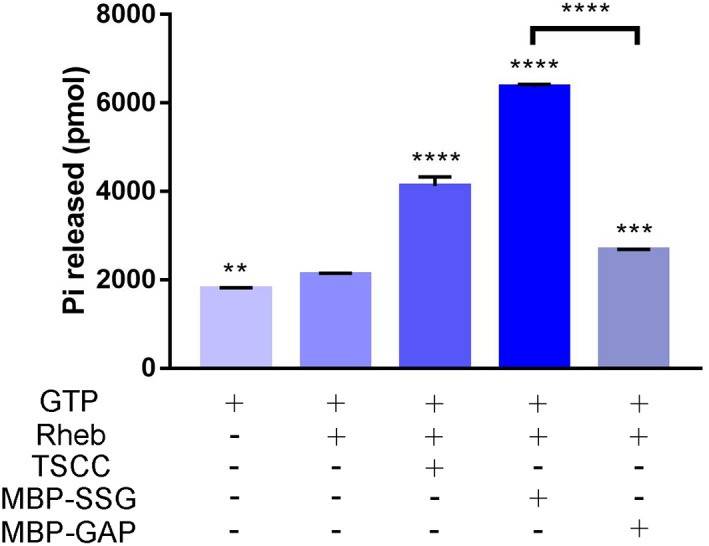
In vitro GTPase activity showed that the purified SSG protein displayed a higher GAP activity toward Rheb compared with TSC2‐GAP domain alone. Ordinary one‐way ANOVA was used to compare statistical significance between the experimental groups and the control group. *: p ≤ 0.05, **: p ≤ 0.01, ***: p ≤ 0.001, and ****: p ≤ 0.0001. Experiments were repeated three times. Quantification is presented as mean ± standard deviation (SD).
Second, we investigated whether the SSG protein could inhibit the mTORC1 activity, as indicated by the phosphorylation level of its substrate S6K1. As expected, overexpression of Rheb boosted the kinase activity of mTORC1 and enhanced the phosphorylation of S6K1 (Figure 5a, lane 2, and Figure 5b). In addition, expression of TSCC inhibited the activation of mTORC1 by Rheb, as shown by a lowered phosphorylated S6K1 level (Figure 5a, lane 3, and Figure 5b). To our expectation, the expression of the SSG protein decreased the phosphorylation level of S6K1, although the difference was not significantly large enough (Figure 5a, lanes 6, and Figure 5b).
FIGURE 5.

Inhibition of Rheb and mTORC1 by the designed SSG‐MTM and SSG‐TSC1N. (a) When overexpressed, the SSG construct tended to inhibit the phosphorylation level of S6K1. (b) Quantification of the results (repeated three times) from (a) and presented as mean ± SD. (c) MTM‐TSC2, which has a membrane targeting motif at the N‐terminus of TSC2, reduced the phosphorylation of S6K1 when overexpressed. (d) Quantification of the results (repeated three times) from (c) and presented as mean ± SD. (e) When expressed at the same level as that of TSCC, both SSG‐MTM and SSG‐TSC1N also exhibited strong inhibition of the activation of mTORC1 by Rheb. (f) Quantification of the results (repeated four or five times) from (e) and presented as mean ± SD. (g) When overexpressed, GAP‐MTM was not able to prevent Rheb from activating mTORC1 and reducing the phosphorylation of S6K1 to the same extent as SSG‐MTM. (h) Quantification of the results (repeated three or four times) from (g) and presented as mean ± SD. Ordinary one‐way ANOVA was used to compare statistical significance between the experimental groups and the control group. *: p ≤ 0.05, **: p ≤ 0.01, ***: p ≤ 0.001, and****: p ≤ 0.0001.
Then, to test our idea of localizing our engineered SSG protein to the lysosomal membrane would facilitate the inhibition of Rheb and mTORC1, we added a MTM (with a sequence of Cys‐Ser‐Val‐Met), which was derived from the C‐terminal end of human Rheb to the N‐terminus of TSC2, and tested its ability to inhibit the activity of mTORC1. Indeed, the MTM‐TSC2 protein reduced the phosphorylation of S6K1 when overexpressed (Figure 5c, d), although it had to be expressed at a high enough level.
Next, as a crucial test, we examined whether our designed SSG‐MTM and SSG‐TSC1N proteins (Figure S4) could negatively regulate the activity of mTORC1. Strikingly, both SSG‐MTM and SSG‐TSC1N exhibited stronger inhibition of the activation of mTORC1 by Rheb, with SSG‐MTM diminishing the phospho‐S6K1 level with a higher activity than the SSG protein without MTM (Figure 5e–h). This result was in accord with our expectation that SSG‐MTM and SSG‐TSC1N localize to lysosomal membrane to prevent lysosome‐anchored Rheb from activating mTORC1. Meanwhile, TSC1N‐TSC2 also showed inhibition of the phospho‐S6K1 level, but the inhibition was weaker than SSG‐MTM (Figure 5e, f). In order to validate the necessity to include the stabilization domain of TSC2 in our designed proteins, we made a construct of human TSC2‐GAP with a MTM at its C‐terminal end (which was named as GAP‐MTM), but without the stabilization domain of TSC2 (Figure S4). When overexpressed, the ability of the GAP‐MTM protein to prevent Rheb from activating mTORC1 and reduce the phosphorylation of S6K1 (Figure 5g, h, lane 5) was much weaker than that of the SSG‐MTM protein (Figure 5g, h, lane 4). Since the only difference between the SSG‐MTM and GAP‐MTM proteins is the stabilization domain of TSC2, and SSG‐MTM has a significantly stronger ability to hydrolyze GTP on Rheb than GAP‐MTM, it corroborated our previous structural analysis and design strategy that including the stabilization domain is essential for the GAP activity of our designed proteins for Rheb.
Finally, in addition to using the phosphorylation of S6K1 as a read‐out for the activity of mTORC1, we also examined the phosphorylation of 4EBP1, which is another well‐established substrate of mTORC1, and performed assays to check the level of autophagy, which is a process inhibited by mTORC1 signaling. As expected, our designed SSG‐MTM and SSG‐TSC1N proteins were able to prevent mTORC1 from phosphorylating 4EBP1, at least to the same extent as TSCC (Figure 6a, b).
FIGURE 6.

Inhibition of 4EBP1 phosphorylation and promotion of autophagy by the designed SSG‐MTM and SSG‐TSC1N. (a) SSG‐MTM or SSG‐TSC1N could inhibit the phosphorylation of 4EBP1 by mTORC1. (b) Quantification of the ratio of phosphorylated 4EBP1 to 4EBP1 from the results (repeated four times) from (a) and presented as mean ± SD. (c) SSG‐MTM or SSG‐TSC1N enhanced the protein level of LC3‐II, suggesting that these two designed proteins could function like TSCC to inhibit mTORC1 and promote autophagy. (d) Quantification of LC3‐II/β‐actin ratio from the results (repeated four or five times) from (a) and presented as mean ± SD. (e) and (f) Expression of SSG‐MTM or SSG‐TSC1N increased the autophagic flux in HeLa cells. (e) HeLa cells were transfected with empty plasmid, TSCC, SSG‐MTM or SSG‐TSC1N along with pmCherry‐GFP‐LC3‐II for 24 h, and then were fixed and visualized by ultra‐high resolution confocal microscope. Scale bar in the zoom panel: 5 μm. (f) LC3‐II positive dots were counted and expressed as the ratio of the number of red dots to yellow dots per cell. The numbers of cells analyzed (n) were shown. Ordinary one‐way ANOVA was used to compare statistical significance between the experimental groups and the control group. *: p ≤ 0.05 and **: p ≤ 0.01.
In addition, we also asked the question of whether SSG‐MTM and SSG‐TSC1N could promote cell autophagy through antagonizing the mTORC1 signaling pathway. During autophagy, cytosolic LC3‐I was converted to lipidated LC3‐II, thus the LC3‐II level could serve to reflect the extent of autophagy activation, which was inversely correlated to the mTORC1 activity (García‐Aguilar et al., 2016). As expected, Rheb decreased the protein levels of LC3‐II (Figure 6c, lane 2, and Figure 6d), indicative of inhibition of autophagy through activating mTORC1. In contrast, TSCC counteracted the down‐regulation of LC3‐II by Rheb (Figure 6c, lane 3, and Figure 6d). Similar to TSCC, both SSG‐MTM (Figure 6c, lane 4, and Figure 6d) and SSG‐TSC1N (Figure 6c, lane 5, and Figure 6d) also enhanced the levels of LC3‐II. Our assay for autophagic flux also yielded similar results (Figure 6e, f). The mCherry fluorophore is more stable against changes in pH than the GFP fluorophore. When the mCherry‐GFP tagged LC3‐II protein enters the lysosome, quenching of green fluorescence signal occurs due to the decrease in pH value. However, the mCherry fluorophore in lysosome is still able to give out a red fluorescent signal. Therefore, if red and green fluorescence signals appear in the cell at the same time, this would indicate that the mCherry‐GFP tagged LC3‐II protein has not fused with lysosome, and autophagic flux is not activated. On the other hand, if there is red fluorescence but no green fluorescence signals in cells, it means that the mCherry‐GFP‐tagged LC3‐II protein enters lysosomes/autophagic lysosomes and autophagy flux occurs (Zhou et al., 2012). We observed that when TSCC, SSG‐MTM, or SSG‐TSC1N was expressed, a relatively higher proportion of red fluorescence appeared, indicating that a higher level of autophagic flux activation occurred (Figure 6e, f). Putting together, these results suggested that our designed SSG‐MTM and SSG‐TSC1N indeed could function like TSCC to inhibit mTORC1 and promote autophagy.
2.3. Promotion of catabolism and inhibition of cell proliferation by SSG‐MTM and SSG‐TSC1N
One of the major functions of mTORC1 is to regulate metabolism. On one hand, by phosphorylating substrates such as S6K1 and 4EBP1, mTORC1 positively regulates anabolism such as protein translation and lipid synthesis. On the other hand, mTORC1 negatively regulates catabolism, partly by phosphorylating the catalytic subunit of AMPK and inhibiting its activity (Ling et al., 2020). Since our designed SSG‐MTM and SSG‐TSC1N constructs could function as GAP proteins for Rheb and prevent its activation of the kinase activity of mTORC1, we would expect them to increase the rate of catabolism.
To examine this possibility, we examined the phosphorylation level of Thr172 of AMPK, which serves as an indicator of cell catabolism (Carling, 2017). A high AMP level and/or a low ATP level would cause the phosphorylation level of AMPK to increase, therefore, AMPK phosphorylation is generally regarded as a good indicator to reflect the catabolic level in cells. When we overexpressed TSCC in 293f cells, we found that the phosphorylation level of AMPK increased (Figure 7a, lane 2, and Figure 7b), which presumably is due to the inhibition of Rheb by TSCC. Similarly, expression of our designed SSG‐MTM (Figure 7a, lane 3, and Figure 7b) or SSG‐TSC1N (Figure 7a, lane 6, and Figure 7b) proteins was also able to elevate the phosphorylation level of AMPK. On the other hand, expression of GAP‐MTM or SSG without MTM resulted in lower AMPK phosphorylation levels than either SSG‐MTM or SSG‐TSC1N (Figure 7a, b). These results confirmed that the stabilization domain and MTM/TSC1N are needed for the function of SSG to antagonize mTORC1 signaling.
FIGURE 7.

Promotion of catabolism and inhibition of cell proliferation by the designed SSG‐MTM or SSG‐TSC1N constructs. (a) The expression of our designed SSG‐MTM or SSG‐TSC1N constructs were able to enhance the phosphorylation of AMPK, which served as an indicator for the catabolic level of cells, to similar levels as that of TSCC. (b) Quantification of the ratio of phosphorylated AMPK to β‐actin from the results (repeated three to five times) from (a) and presented as mean ± SD. (c) Expression of SSG‐MTM or SSG‐TSC1N decreased cell proliferation in the colony formation assay. Empty pcDNA3.1a plasmid, TSC1/TSC2/TBC1D7, SSG‐MTM, SSG, GAP‐MTM, or SSG‐TSC1N was transfected into HeLa cells. The colony formation assay was carried out after the transfected cells were cultured for another 8 days. (d) The experiments in (c) were repeated three times and the numbers of colonies formed were counted and presented as mean ± SD. Ordinary one‐way ANOVA was used to compare statistical significance between the experimental groups and the control group. *: p ≤ 0.05, **: p ≤ 0.01, ***: p ≤ 0.001, and ****: p ≤ 0.0001.
It is well known that the mTOR signaling pathway functions to promote cell proliferation, and the major function of TSCC is to negatively regulate mTORC1 kinase activity so as to decelerate cell proliferation (Fu & Wu, 2023). Both human TSC1 and TSC2 proteins have been regarded as tumor suppressor proteins (Roux et al., 2004). Consistent with this notion, overexpression of TSCC in HeLa cells prohibited cell growth in the colony formation assay (Figure 7c, d). Similarly, SSG‐MTM or SSG‐TSC1N was also able to decrease the growth rate of HeLa cells (Figure 7c, d). SSG‐MTM displayed higher inhibition of cell proliferation than SSG or GAP‐MTM (Figure 7c, d), and SSG‐TSC1N also displayed higher inhibition levels than SSG (Figure 7c, d). These results provided further supporting evidence that our engineered constructs SSG‐MTM or SSG‐TSC1N functioned similarly to TSCC to inhibit mTORC1 signaling, and the stabilization domain and the MTM are needed for their functions.
3. DISCUSSION
The mTOR signal transduction pathway is a master regulator in controlling cell growth and metabolism. A lot of studies have been focused on the upstream positive and negative regulators of mTOR signaling. Many proteins/protein complexes and small molecules have been found to upregulate mTOR, such as the RagA–RagC protein complex, the Ragulator protein complex, amino acids such as arginine or leucine, and so forth. On the contrary, the number of known molecules with the capability to down‐regulate mTOR signaling is relatively few, with TSCC and rapamycin (including its derivatives such as everolimus) as the best examples. In this work, we strove to take a protein engineering approach to design proteins to mimic the function of the human TSCC complex, but with much‐reduced sizes. Based on a thorough understanding of the structural mechanism of how TSCC functions to negatively regulate Rheb, we concluded that the stabilization domain of TSC2 is essential to stabilize the GAP‐Rheb association and for the GAP domain to inhibit Rheb. Therefore, we designed two proteins, SSG‐MTM and SSG‐TSC1N, by assembling the shortened stabilization domain and the GAP domain of human TSC2 together with a MTM derived from the C‐terminus of Rheb or the NTD of human TSC1. The CSVM motif or TSC1‐NTD may target SSG to any cellular membrane, including the lysosomal membrane, yet they indeed enhanced the ability of SSG to reduce the kinase activity of mTORC1, as suggested by the decreased phosphorylation level of S6K1 and 4EBP1. Our biochemical assays and cell biological experiments supported the expectation that these designed proteins indeed could hydrolyze GTP carried by Rheb to GDP, inactivate the activity of mTORC1, and prevent mTORC1 from inhibiting catabolism, and the stabilization domain and the MTM were needed for these functions.
One shortcoming of the TSCC complex is that it is labile, presumably due to its large size (~700 kDa) and complex organization. In comparison, the molecular weight of our designed SSG‐MTM protein is only 48.4 kDa, ~1/15 of that of TSCC. The drastically reduced size and elimination of unnecessary long loops presumably contribute to the relative stability of SSG‐MTM (and SSG‐TSC1N as well). Our coimmunoprecipitation experiments showed that SSG‐MTM was not dimeric (Figure S5). This may be because in TSCC the coiled‐coil domains of TSC1 interact with two molecules of TSC2 and hence contribute to the dimerization of TSC2, while our constructs lack the coiled coils of TSC1 and the stabilization domain of TSC2 alone is not enough to mediate dimerization. For SSG‐TSC1N, it may potentially form oligomers/aggregates mediated by TSC1N, which may be good or bad for its function. We envision that we may employ even shorter linkers than those in SSG to connect the secondary structure elements of the stabilization domain together, so as to design proteins with even smaller sizes and greater stability than SSG‐MTM.
4. MATERIALS AND METHODS
4.1. Antibodies
| Antibody | Vendor | Catalog # |
|---|---|---|
| Phospho‐p70 S6 kinase (Thr389) antibody | Cell signaling technology | Cat# 9205 |
| DYKDDDDK‐Tag (3B9) mAb | Abmart | Cat# M20008 |
| Recombinant anti‐Rheb antibody (EPR2971) | Abcam | Cat# ab92313 |
| HA‐tag (C29F4) rabbit mAb | Cell signaling technology | Cat# 3724 |
| ACTB monoclonal antibody | ABclonal | Cat# AC026 |
| Rabbit anti‐AMPK‐α, phospho (Thr172) monoclonal antibody, unconjugated, Clone 40H9 | Cell signaling technology | Cat# 2535 |
| LC3A/B (D3U4C) XP® rabbit mAb | Cell signaling technology | Cat# 12741 |
| Phospho‐4E‐BP1 (Ser65) antibody | Cell signaling technology | Cat#9451S |
| 4E‐BP1 (53H11) rabbit mAb | Cell signaling technology | Cat#9644S |
4.2. Protein structure prediction
All the structure prediction results were obtained by performing AlphaFold2 (Tunyasuvunakool et al., 2021) unless specified otherwise. The calculation was carried out on the super calculation platform of Shanghai Jiao Tong University (Shanghai, China). The structure of the protein complex between the stabilization domain and the GAP domain of TSC2 and that of the SSG‐Rheb complex were predicted using the AlphaFold2‐multimer method (Evans et al., 2021).
4.3. Protein expression and purification
For the expression and purification of Rheb, SSG, and the GAP domain of TSC2, The cDNA sequences encoding 6 × histidine‐tagged Rheb (His‐Rheb), 6 × histidine and maltose binding protein‐tagged SSG (His‐MBP‐SSG), and His‐MBP‐TSC2GAP were subcloned into the pET28a plasmid. These plasmids were transformed into E. coli BL21(DE3) competent cells, which were cultured at 37°C until OD600 reached 0.6, induced with 0.2 mM IPTG, and further cultured at 16°C for another 18 h.
After being harvested and resuspended, the cells were lysed with buffer containing 20 mM Tris–HCl, pH 8.0, 150 mM NaCl, 50 mM imidazole, and 0.5 mM PMSF by high‐pressure homogenizer (Union‐Biotech, Shanghai, China) and centrifuged for 1 h at 14,000 rpm. The supernatant was subjected to Ni2+‐NTA affinity chromatography (Qiagen). After extensive washing with the equilibration buffer (20 mM Tris–HCl, pH 8.0, 150 mM NaCl, and 50 mM imidazole), the target proteins were eluted by the elution buffer (20 mM Tris–HCl, pH 8.0, 150 mM NaCl, and a gradient of concentration of imidazole: 100, 200, 300, 400, and 500 mM). Eluted fractions containing the target proteins were combined and concentrated and were further purified through the HiLoad 16/600 Superdex 200 pg gel filtration chromatography (GE Healthcare). The Superdex 200 equilibration buffer was 20 mM Tris–HCl, pH 8.0, 150 mM NaCl, and 1 mM dithiothreitol (DTT). Peak fractions were combined and stored in −80°C freezer.
For the expression and purification of the TSCC protein complex, the cDNA sequences encoding full‐length (FL) human TSC1, FL human TSC2, or FL human TBC1D7 were subcloned into the pRK7 plasmid with His‐tag, Flag‐tag, or HA‐tag, respectively. The three plasmids were cotransfected into human embryonic kidney expi293f cells (Thermo Fisher Scientific). After 2 days of transfection, the expi293f cells were lysed using the freeze‐thaw method. The lysis buffer used was 20 mM Tris, pH 8.0, 150 mM NaCl, 1 mM DTT, 0.5 mM PMSF, 1 μg/mL aprotinin, and 1 μg/mL leupeptin. The cell lysate was centrifuged and the supernatant was subjected to the M2 anti‐FLAG affinity chromatography (Sigma), followed by size exclusion chromatography through a Superose 6 column (GE Healthcare). The Superose 6 equilibration buffer used was 20 mM Tris, pH 8.0, 50 mM NaCl, and 1 mM DTT. The above‐purified proteins were used for the GTPase activity assay.
4.4. GTPase activity assay
The GTPase activity of Rheb was assayed using the QuantiChrom ATPase/GTPase assay kit (BioAssay Systems), in which the amount of the released inorganic phosphate was measured through a chromogenic reaction with malachite green. In the assay, 3 μM of Rheb, 1.5 μM of TSCC, His‐MBP‐SSG, or His‐MBP‐GAP were added to the reaction buffer (20 mM Tris, pH 8.0, 150 mM NaCl, 1 mM DTT, and 1 mM GTP) and incubated at 37°C for 3 h. Then 200 μL of the assay kit reagent was added and incubated for another 30 min, and the optical density (OD) at 620 nm was measured by microplate reading. Spontaneous GTP hydrolysis was obtained by measuring blank background absorbance. Each experiment was separately repeated three times.
4.5. Cell culture, transfection, and plasmids
Human HeLa cells were cultured in Dulbecco's modified Eagle's medium (Hyclone) containing 10% fetal bovine serum in a 37°C incubator with 5% CO2. Human expi293f cells were cultured in the Expi293 expression medium (Invitrogen). Cell transfection was performed using lipofectamine 2000 (Invitrogen). Flag‐tagged human TSC1, Flag‐tagged human TSC2, and HA‐tagged human TBC1D7 were subcloned into the pRK7 plasmid. Myc‐tagged Rheb was subcloned into the pLVX‐ZsGreen plasmid. Flag‐tagged S6K1, Flag‐tagged SSG, Flag‐tagged TSC2‐LA, Flag‐tagged SSG‐LA, Flag‐tagged SSG‐TSC1N, and Flag‐tagged TSC1N‐TSC2 were subcloned into the pcDNA3.1a plasmid. Plasmids were cotransfected into expi293f or HeLa cells. The harvested cells were lysed with RIPA lysis buffer containing 50 mM Tris, pH 7.4, 150 mM NaCl, 1% Triton X‐100, 1% sodium deoxycholate, 0.1% SDS, 0.5 mM PMSF, 1 μg/mL aprotinin, and 1 μg/mL leupeptin and centrifuged. The supernatant was used for co‐immunoprecipitation (Co‐IP) and western blot experiments.
4.6. Normal mode analysis (NMA)
The structural coordinates of the protein examined were submitted for NMA using the web server (http://www.sciences.univ-nantes.fr/elnemo/). The major vibrational modes generated by the server were selected for analysis. According to analytical mechanics, the number of normal modes of a protein is 3N‐M, with N being the number of atoms in the protein and M being the number of constraints. Among these 3N‐M normal modes, three are translational modes of the center of mass, and another three are rotational modes of the protein when it is regarded as a rigid body. The rest of the 3N‐M‐6 normal modes are vibrational modes. These modes were listed according to the lowest to the highest frequency. Therefore, the seventh normal mode, which is the first vibrational mode, is the slowest in vibrational frequency and thus was regarded as the most important vibrational mode.
4.7. Autophagic flux assay
Empty pcDNA3.1aplasmids, TSCC, SSG‐LA, or SSG‐TSC1N were transfected along with pmCherry‐GFP‐LC3‐II into HeLa cells by Lipofectamine 2000 (Invitrogen) when the cell density was 70%–80%. The cells were continued to be cultured for another 24 h and then were fixed by 4% paraformaldehyde fixation solution for 30 min. The cells were washed by the PBS buffer for three times, with 3 min each time. The cells were mounted with Fluoromount G (Yeasen Biotechnology) to prevent quenching, and visualized by ultra‐high resolution confocal microscope (Leica, SP8, Germany). The cells were randomly selected for observation. Images were acquired with a 100× oil immersion objective on ultra‐high resolution confocal microscope. The numbers of images acquired were shown in Figure 6. Manual counting of dots was performed in a double‐blinded manner using the same standard and the numbers of cells were counted. We calculated the average number of red and yellow dots per cell and used ordinary one‐way ANOVA method to determine the statistical differences in autophagic flux among different experimental groups. The statistical analysis was performed using GraphPad Prism (Version 7.00).
4.8. Colony formation assay
HeLa cells (500 cells per well) were seeded on six‐well plates and transfected with empty plasmid, TSCC (including TSC1, TSC2, and TBC1D7), SSG‐MTM or SSG‐TSC1N. Then the cells were incubated at 37°C under 5% CO2 for 8 days. The cells were washed with PBS, fixed with 4% paraformaldehyde at room temperature for 30 min, and washed with PBS again. Then, the cells were stained with 10× Giemsa stain (Beyotime) for 15 min. Stained cells were gently washed with water until clear cell clusters started to show. After that, the cell clusters were allowed to dry at room temperature. The numbers of colonies formed were counted manually. The statistical analysis was performed using GraphPad Prism (Version 7.00).
AUTHOR CONTRIBUTIONS
Wencheng Fu: Investigation; Writing—original draft; Methodology; Validation; Visualization; Software; Formal analysis; Data curation. Geng Wu: Conceptualization; Writing—review & editing; Funding acquisition; Project administration; Resources; Supervision; Data curation.
CONFLICT OF INTEREST STATEMENT
The authors declare that they have no competing financial interests.
Supporting information
Supplementary Movie 1: The vibrational mode of the GAP domain of TSC2 in the absence of the stabilization domain, obtained by normal mode analysis.
Supplementary Movie 2: The vibrational mode of the GAP domain of TSC2 in the presence of the stabilization domain, obtained by normal mode analysis.
Data S1: Supporting Information
ACKNOWLEDGMENTS
We would like to thank Prof. Yidong Shen, Dr. Christopher Aylett, Wen Wang, and Rongzi Mu for their support and help. This research was funded by the National Key R&D Program of China (grant number 2020YFA0907300 and 2022YFA0912200), National Natural Science Foundation of China (grant numbers 32170030 and 31872627), and Shanghai Jiao Tong University Scientific and Technological Innovation Fund.
Fu W, Wu G. Design of negative‐regulating proteins of Rheb/mTORC1 with much‐reduced sizes of the tuberous sclerosis protein complex. Protein Science. 2023;32(8):e4731. 10.1002/pro.4731
Review Editor: John Kuriyan
REFERENCES
- Bjedov I, Toivonen JM, Kerr F, Slack C, Jacobson J, Foley A, et al. Mechanisms of life span extension by rapamycin in the fruit fly Drosophila melanogaster . Cell Metab. 2010;11:35–46. [DOI] [PMC free article] [PubMed] [Google Scholar]
- Bjornsson J, Short MP, Kwiatkowski DJ, Henske EP. Tuberous sclerosis‐associated renal cell carcinoma. Clinical, pathological, and genetic features. Am J Pathol. 1996;149:1201–1208. [PMC free article] [PubMed] [Google Scholar]
- Carling D. AMPK signalling in health and disease. Curr Opin Cell Biol. 2017;45:31–37. [DOI] [PubMed] [Google Scholar]
- Chen Y, Zhou X. Research progress of mTOR inhibitors. Eur J Med Chem. 2020;208:112820. [DOI] [PubMed] [Google Scholar]
- Dibble CC, Elis W, Menon S, Qin W, Klekota J, Asara JM, et al. TBC1D7 is a third subunit of the TSC1‐TSC2 complex upstream of mTORC1. Mol Cell. 2012;47:535–546. [DOI] [PMC free article] [PubMed] [Google Scholar]
- Evans R, O'Neill M, Pritzel A, et al. Protein complex prediction with AlphaFold‐Multimer. bioRxiv. 2021.
- Fitzian K, Brückner A, Brohée L, Zech R, Antoni C, Kiontke S, et al. TSC1 binding to lysosomal PIPs is required for TSC complex translocation and mTORC1 regulation. Mol Cell. 2021;81(2705–2721):2705–2721.e8. [DOI] [PubMed] [Google Scholar]
- Fu W, Wu G. Targeting mTOR for anti‐aging and anti‐cancer therapy. Molecules. 2023;28(7):3157. [DOI] [PMC free article] [PubMed] [Google Scholar]
- Gai Z, Chu W, Deng W, Li W, Li H, He A, et al. Structure of the TBC1D7‐TSC1 complex reveals that TBC1D7 stabilizes dimerization of the TSC1 C‐terminal coiled coil region. J Mol Cell Biol. 2016;8:411–425. [DOI] [PubMed] [Google Scholar]
- García‐Aguilar A, Guillén C, Nellist M, Bartolomé A, Benito M. TSC2 N‐terminal lysine acetylation status affects to its stability modulating mTORC1 signaling and autophagy. Biochim Biophys Acta. 2016;1863(11):2658–2667. [DOI] [PubMed] [Google Scholar]
- Gomez MR , Sampson JR, Whittemore VH. The tuberous sclerosis complex. Oxford University Press; 1999. [Google Scholar]
- Hansmann P, Brückner A, Kiontke S, Berkenfeld B, Seebohm G, Brouillard P, et al. Structure of the TSC2 GAP domain: mechanistic insight into catalysis and pathogenic mutations. Structure. 2020;28(8):933–942.e4. [DOI] [PubMed] [Google Scholar]
- Harrison DE, Strong R, Sharp ZD, Nelson JF, Astle CM, Flurkey K, et al. Rapamycin fed late in life extends lifespan in genetically heterogeneous mice. Nature. 2009;460:392–395. [DOI] [PMC free article] [PubMed] [Google Scholar]
- Henske EP, Jóźwiak S, Kingswood JC, Sampson JR, Thiele EA. Tuberous sclerosis complex. Nat Rev Dis Primers. 2016;2:16035. [DOI] [PubMed] [Google Scholar]
- Hoogeveen‐Westerveld M, van Unen L, van den Ouweland A, Halley D, Hoogeveen A, Nellist M. The TSC1‐TSC2 complex consists of multiple TSC1 and TSC2 subunits. BMC Biochem. 2012;13:18. [DOI] [PMC free article] [PubMed] [Google Scholar]
- Inoki K, Li Y, Xu T, Guan KL. Rheb GTPase is a direct target of TSC2 GAP activity and regulates mTOR signaling. Genes Dev. 2003;17:1829–1834. [DOI] [PMC free article] [PubMed] [Google Scholar]
- Inoki K, Li Y, Zhu T, Wu J, Guan KL. TSC2 is phosphorylated and inhibited by Akt and suppresses mTOR signalling. Nat Cell Biol. 2002;4(9):648–657. [DOI] [PubMed] [Google Scholar]
- Lin M, Hua R, Ma J, Zhou Y, Li P, Xu X, et al. Bisphenol a promotes autophagy in ovarian granulosa cells by inducing AMPK/mTOR/ULK1 signalling pathway. Environ Int. 2021;147:106298. [DOI] [PubMed] [Google Scholar]
- Ling NXY, Kaczmarek A, Hoque A, Davie E, Ngoei KRW, Morrison KR, et al. mTORC1 directly inhibits AMPK to promote cell proliferation under nutrient stress. Nat Metab. 2020;2(1):41–49. [DOI] [PMC free article] [PubMed] [Google Scholar]
- Liu GY, Sabatini DM. mTOR at the nexus of nutrition, growth, ageing and disease. Nat Rev Mol Cell Biol. 2020;21:183–203. [DOI] [PMC free article] [PubMed] [Google Scholar]
- Marshall CB, Ho J, Buerger C, Plevin MJ, Li GY, Li Z, et al. Characterization of the intrinsic and TSC2‐GAP‐regulated GTPase activity of Rheb by real‐time NMR. Sci Signal. 2009;2(55):ra3. [DOI] [PubMed] [Google Scholar]
- Meng LH, Zheng XFS. Toward rapamycin analog (rapalog)‐based precision cancer therapy. Acta Pharmacol Sin. 2015;36:1163–1169. [DOI] [PMC free article] [PubMed] [Google Scholar]
- Powers RW 3rd, Kaeberlein M, Caldwell SD, Kennedy BK, Fields S. Extension of chronological life span in yeast by decreased TOR pathway signaling. Genes Dev. 2006;20:174–184. [DOI] [PMC free article] [PubMed] [Google Scholar]
- Ramlaul K, Aylett CHS. Signal integration in the (m)TORC1 growth pathway. Front Biol. 2018;13:237–262. [DOI] [PMC free article] [PubMed] [Google Scholar]
- Ramlaul K, Fu W, Li H, de Martin Garrido N, He L, Trivedi M, et al. Architecture of the tuberous sclerosis protein complex. J Mol Biol. 2021;433:166743. [DOI] [PMC free article] [PubMed] [Google Scholar]
- Roux PP, Ballif BA, Anjum R, Gygi SP, Blenis J. Tumor‐promoting phorbol esters and activated Ras inactivate the tuberous sclerosis tumor suppressor complex via p90 ribosomal S6 kinase. Proc Natl Acad Sci USA. 2004;101(37):13489–13494. [DOI] [PMC free article] [PubMed] [Google Scholar]
- Sato T, Nakashima A, Guo L, Coffman K, Tamanoi F. Single amino‐acid changes that confer constitutive activation of mTOR are discovered in human cancer. Oncogene. 2010;29:2746–2752. [DOI] [PMC free article] [PubMed] [Google Scholar]
- Saxton RA, Sabatini DM. mTOR signaling in growth, metabolism, and disease. Cell. 2017;168:960–976. [DOI] [PMC free article] [PubMed] [Google Scholar]
- Scrima A, Thomas C, Deaconescu D, Wittinghofer A. The rap‐RapGAP complex: GTP hydrolysis without catalytic glutamine and arginine residues. EMBO J. 2008;27:1145–1153. [DOI] [PMC free article] [PubMed] [Google Scholar]
- Slegtenhorst MV, Hoogt RD, Hermans C, et al. Identification of the tuberous sclerosis gene TSC1 on chromosome 9q34. Science. 1997;277:805–808. [DOI] [PubMed] [Google Scholar]
- Sun W, Zhu YJ, Wang Z, Zhong Q, Gao F, Lou J, et al. Crystal structure of the yeast TSC1 core domain and implications for tuberous sclerosis pathological mutations. Nat Commun. 2013;4:2135. [DOI] [PubMed] [Google Scholar]
- Takahashi K, Nakagawa M, Young SG, Yamanaka S. Differential membrane localization of ERas and Rheb, two Ras‐related proteins involved in the phosphatidylinositol 3‐kinase/mTOR pathway. J Biol Chem. 2005;280:32768–32774. [DOI] [PubMed] [Google Scholar]
- Tunyasuvunakool K, Adler J, Wu Z, Green T, Zielinski M, Žídek A, et al. Highly accurate protein structure prediction for the human proteome. Nature. 2021;596:590–596. [DOI] [PMC free article] [PubMed] [Google Scholar]
- Yang H, Yu Z, Chen X, Li J, Li N, Cheng J, et al. Structural insights into TSC complex assembly and GAP activity on Rheb. Nat Commun. 2021;12:339. [DOI] [PMC free article] [PubMed] [Google Scholar]
- Zhou C, Zhong W, Zhou J, Sheng F, Fang Z, Wei Y, et al. Monitoring autophagic flux by an improved tandem fluorescent‐tagged LC3 (mTagRFP‐mWasabi‐LC3) reveals that high‐dose rapamycin impairs autophagic flux in cancer cells. Autophagy. 2012;8(8):1215–1226. [DOI] [PubMed] [Google Scholar]
- Zhou Y, Wang X, Song M, He Z, Cui G, Peng G, et al. A secreted microRNA disrupts autophagy in distinct tissues of Caenorhabditis elegans upon ageing. Nat Commun. 2019;10:4827. [DOI] [PMC free article] [PubMed] [Google Scholar]
Associated Data
This section collects any data citations, data availability statements, or supplementary materials included in this article.
Supplementary Materials
Supplementary Movie 1: The vibrational mode of the GAP domain of TSC2 in the absence of the stabilization domain, obtained by normal mode analysis.
Supplementary Movie 2: The vibrational mode of the GAP domain of TSC2 in the presence of the stabilization domain, obtained by normal mode analysis.
Data S1: Supporting Information