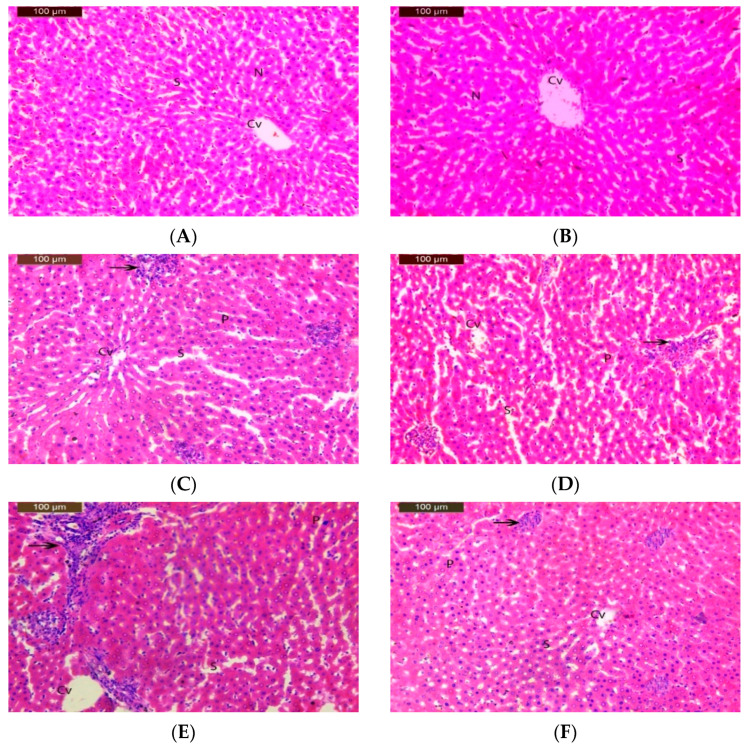
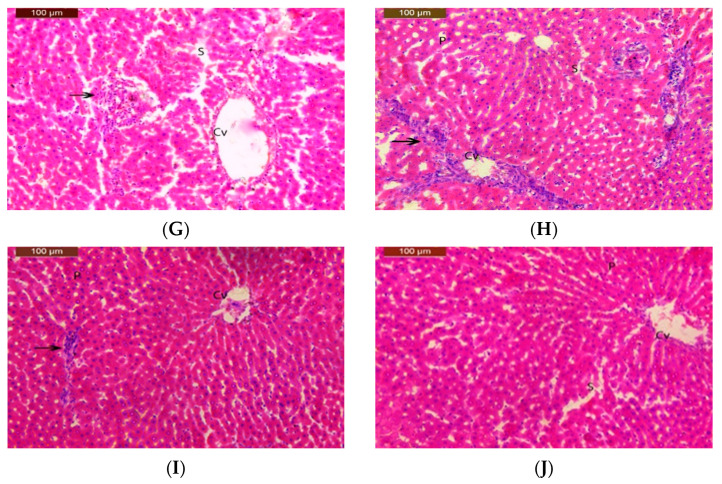
Figure 2.
Photomicrography of liver sections showing normal liver tissue in (A) control group and (B) the 50 mg/Kg nano-emulsion treatment group with normal central vein (cv), blood sinusoids (S), and nucleus (N). (C,D) Imidacloprid-treated groups at conc. of 14 and 28 mg/kg bw/day. (F,G) Chlorpyrifos-treated groups at conc. of 1 and 2 mg/kg bw/day, showing few inflammatory cell infiltrations (arrow), dilated sinusoids (S), and pyknotic nuclei (P). (E) Imidacloprid-treated group at conc. of 54 mg/kg bw/day. (H) Chlorpyrifos-treated group at conc. 4 of mg/kg bw/day showing moderate degeneration changes with increased inflammatory cell infiltration (arrow), dilated sinusoids (S), and pyknotic nuclei (P). (I) Imidacloprid group at conc. of 54 mg/kg bw/day plus 50 mg/kg bw/day nano-emulsion treatment. (J) Chlorpyrifos group at conc. of 4 mg/kg bw/day plus 50 mg/kg bw/day nano-emulsion showing almost normal structure with few dilated sinusoids (S) and pyknotic nuclei (P). (H&E X 200).


