

Abstract
Background
Diet as one aspect of lifestyle is thought to be one of the modifiable risk factors for the development of type 2 diabetes mellitus (T2DM). Information is needed as to which components of the diet could be protective for this disease.
Objectives
To asses the effects of whole‐grain foods for the prevention of T2DM.
Search methods
We searched CENTRAL, MEDLINE, EMBASE, CINAHL and AMED.
Selection criteria
We selected cohort studies with a minimum duration of five years that assessed the association between intake of whole‐grain foods or cereal fibre and incidence of T2DM. Randomised controlled trials lasting at least six weeks were selected that assessed the effect of a diet rich in whole‐grain foods compared to a diet rich in refined grain foods on T2DM and its major risk factors.
Data collection and analysis
Two authors independently selected the studies, assessed study quality and extracted data. Data of studies were not pooled because of methodological diversity.
Main results
One randomised controlled trial and eleven prospective cohort studies were identified. The randomised controlled trial, which was of low methodological quality, reported the change in insulin sensitivity in 12 obese hyperinsulinemic participants after six‐week long interventions. Intake of whole grain foods resulted in a slight improvement of insulin sensitivity and no adverse effects. Patient satisfaction, health related quality of life, total mortality and morbidity was not reported. Four of the eleven cohort studies measured cereal fibre intake, three studies whole grain intake and two studies both. Two studies measured the change in whole grain food intake and one of them also change in cereal fibre intake. The incidence of T2DM was assessed in nine studies and changes in weight gain in two studies. The prospective studies consistently showed a reduced risk for high intake of whole grain foods (27% to 30%) or cereal fibre (28% to 37%) on the development of T2DM.
Authors' conclusions
The evidence from only prospective cohort trials is considered to be too weak to be able to draw a definite conclusion about the preventive effect of whole grain foods on the development of T2DM. Properly designed long‐term randomised controlled trials are needed. To facilitate this, further mechanistic research should focus on finding a set of relevant intermediate endpoints for T2DM and on identifying genetic subgroups of the population at risk that are most susceptible to dietary intervention.
Plain language summary
Whole grain foods for the prevention of type 2 diabetes mellitus
Food products derived from cereal grains as wheat, rice, corn, rye, oat, and barley constitute a major part of the daily diet in many countries. In refined‐grain products, the bran and germ of the grain, which contain the major amount of nutrients and dietary fibre, have been removed and only the starchy inner part of the grain (ca. 80% of the whole grain) is used. Whole grain foods contain either intact, flaked or broken grain kernels, coarsely ground kernels or flour that is made from whole grains (whole‐meal flour). In this review the effect of whole grain foods and cereal fibre (as a marker of whole‐grain food intake) on the prevention of type 2 diabetes mellitus (T2DM) was assessed using all available prospective cohort studies and randomised controlled trials. Only one randomised controlled trial was found which was of low methodological quality. This study investigated in 12 overweight persons during six weeks the effect of the consumption of refined grain foods versus that of whole grain foods on insulin sensitivity (risk factor for the development of T2DM). Intake of whole grain foods resulted in a slight improvement of insulin sensitivity, increased bowel movements and no adverse effects. No information was given about patient satisfaction, health related quality of life, total mortality and morbidity. In addition eleven prospective cohort studies were found. One study was conducted in Finland and the rest in the United States of America of which seven were done in health care workers. Some of the studies were of limited quality. They consistently showed that a high intake of whole grain foods or cereal fibre is associated with a lower risk of the development of T2DM. However, evidence for a protective effect coming from prospective cohort studies only has to be considered as weak as with this design no cause and effect relationship can be established. Well‐designed randomised controlled trials are needed to be able to draw definite conclusions about the preventive effects of whole grain consumption on development of T2DM.
Background
Description of the condition
Diabetes mellitus is a metabolic disorder resulting from a defect in insulin secretion, insulin action, or both. A consequence of this is chronic hyperglycaemia (i.e. elevated levels of plasma glucose) with disturbances of carbohydrate, fat and protein metabolism. Long‐term complications of diabetes mellitus include retinopathy, nephropathy and neuropathy. The risk of cardiovascular disease is increased. For a detailed overview of diabetes mellitus, please see under 'Additional information' in the information on the Metabolic and Endocrine Disorders Group in The Cochrane Library (see 'About the Cochrane Collaboration', 'Collaborative review groups ‐ CRGs'). For an explanation of methodological terms, see the main glossary in The Cochrane Library.
Description of the intervention
Type 2 diabetes is the most prevalent form of diabetes worldwide and develops as a consequence of two defects. In an early stage target tissues are unable to respond to normal circulating concentrations of insulin (insulin resistance). As a consequence the output of insulin from the pancreatic beta‐cells is increased (hyperinsulinemia) to maintain normal blood glucose levels. In a later stage insulin secretion may decline as a result of beta‐cell dysfunction. This leads to impaired glucose tolerance, impaired fasting glycaemia (glucose values above the normal range but below those defined as diagnostic of diabetes) or both which are associated with an increased risk of type 2 diabetes (Unwin 2002; WHO 1999). Excessive weight gain and central obesity are other well established risk factors for the development of type 2 diabetes (FAO/WHO 2003). The incidence of obesity and type 2 diabetes are increasing rapidly worldwide and pose enormous economic as well as social costs to societies, urging for preventive measures. Although genetic elements are involved in the pathogenesis of type 2 diabetes, the rapid changes in incidence rates suggest a particularly important role for environmental factors. Besides physical activity, diet is thought to play a key role as a modifiable risk factor. Characteristics of a diet favouring the development of obesity and type 2 diabetes are currently defined as high in saturated fat and energy‐dense foods as well as low in fruit and vegetables (FAO/WHO 2003). The contribution of the type of starchy food ‐ an important component of the diet worldwide ‐ however, has not been established well. Starchy foods are derived mainly from cereal grains which undergo a refining process or will be used entirely (whole grain foods).
How the intervention might work
Food products derived from cereals as wheat, rice, corn, rye, oat, and barley constitute a major part of the daily diet in many countries (FAO 1998). In refined‐grain products, the bran and germ of the grain which contain the major amount of micronutrients, phytochemicals and dietary fibre (non‐digestible carbohydrates and lignin), have been removed and only the starchy endosperm (ca. 80% of the whole grain) is used. Whole grain foods contain either intact, flaked or broken grain kernels, coarsely ground kernels or flour that is made from whole grains (whole‐meal flour). In epidemiological studies foods commonly are classified as whole grain as they contain more than 25% by weight whole‐grain or bran (Jacobs 1998). The Food and Drug Administration (FDA 2005) has approved a health claim for whole‐grain foods with a whole‐grain content of more than 51% by weight per reference amount customarily consumed and more recently has announced in a FDA guidance document (draft guidelines) that it "considers 'whole grain' to include cereal grains that consist of the intact, ground, cracked or flaked fruit of the grains whose principal components ‐‐ the starchy endosperm, germ and bran ‐‐ are present in the same relative proportions as they exist in the intact grain" (FDA 2006).
Changes in food patterns such as a decrease of consumption of whole grain foods which occurred simultaneously with the increase of prevalence of chronic disease over the last decades have lead to the hypothesis that constituting whole grain food by highly refined grain foods is linked to the development of type 2 diabetes and other chronic diseases (Burkitt 1975; Trowell 1975). There are several hypotheses as to how whole grain foods might prevent type 2 diabetes. Beneficial effects on weight gain, for example, could be explained by the larger volume and relatively low energy density of whole grain food which is due to the presence of cereal fibre. This promotes satiation and satiety thus leading to decreased energy intake (Koh‐Banerjee 2003). Consumption of whole grain foods containing intact, broken or coarsely ground kernels or viscous soluble fibre, results in a lower postprandial plasma glucose and insulin response as compared to refined grain foods (Slavin 2003). In view of the proposed aggravating effects of high postprandial glucose and insulin concentrations on insulin sensitivity and beta‐cell failure, their suppression is considered to be beneficial (Ludwig 2002; Willett 2002). Also, the high content of antioxidants such as vitamin E, phytic acid and selenium might be advantageous (Slavin 2003) since there is emerging evidence that the pathogenesis of diabetes is associated with increased oxidative stress (Dandona 2004; Robertson 2004; Sjoholm 2005).
From observational studies there is evidence for a protective effect of whole‐grain foods with regard to the development of type 2 diabetes (Fung 2002; McKeown 2002; Meyer 2000; Montonen 2003). More recently, higher intake of whole grains was also associated with decreases in insulin resistance ‐ a risk factor related to the development of type 2 diabetes (Liese 2003; McKeown 2004; Steffen 2003).
However, the protective effect of whole‐grain foods on the development of type 2 diabetes would ideally be evaluated by randomised control trials because of their optimal control of confounding factors. To be able to observe differences in incidence of type 2 diabetes the duration of the dietary intervention would need to be very long. Alternatively, persons with at least one major risk factors for type 2 diabetes could be chosen. Amelioration of the risk factor could then be used as an indication of decreased risk of development of type 2 diabetes. Still, it is likely that compliance with the whole‐grain diet decreases with time, especially in persons who regard the diet as less palatable or might experience adverse effects of the intervention. The relatively high content of cereal fibre and resistant starch in the whole‐grain diet might cause increased bloating, flatulence or both in sensitive persons. Due to these limitations with regard to trial duration and compliance randomised controlled trials assessing the effect of whole‐grain foods on the development of type 2 diabetes are likely to be scarce.
Why it is important to do this review
Some reviews have been published addressing the relation between whole grain foods and the incidence of type 2 diabetes (Liu 2002; Murtaugh 2003). However, they were not systematically performed with respect to literature search and did not include quality assessment. Summarizing and evaluating the available evidence ‐derived from prospective cohort studies and intervention trials ‐ concerning the possible protective effect of whole grain foods could aid in identifying further research need and assist in defining recommendations with regard to the intake of starchy foods for the prevention of the development of type 2 diabetes.
Objectives
To asses the effects of whole‐grain foods for the prevention of type 2 diabetes mellitus.
Methods
Criteria for considering studies for this review
Types of studies
Randomised controlled trials, controlled clinical trials and cohort studies were considered.
Types of participants
Randomised controlled trials or controlled clinical trials
Inclusion criteria
Healthy persons and persons with at least one major risk factor for type 2 diabetes were included. Major risk factors are overweight, abdominal obesity, impaired glucose tolerance and insulin resistance. We excluded children and adolescents less than 18 years because of the well known differences in eating patterns.
Diagnostic criteria
Type 2 diabetes and impaired glucose tolerance: the diagnosis should have been established using the standard criteria valid at the time of the beginning of the trial (ADA 1997; ADA 1999; NDDG 1979; Unwin 2002; WHO 1980; WHO 1985; WHO 1999).
Overweight
Body mass index greater than 25 (body mass in kg / height in (m2)) (FAO/WHO 2003).
Abdominal obesity
Waist circumference equal to or more than 102 cm in men and equal to or more than 88 cm in women (FAO/WHO 2003).
Insulin resistance
Cut‐off values for defining insulin resistance vary since different methods are used for assessment of insulin resistance (Monzillo 2003). Under hyperinsulinemic, euglycemic conditions, glucose uptake below lowest quartile for background population under investigation is defined as insulin resistance according to the WHO (WHO 1999).
Cohort studies
Inclusion criteria
Free living persons (older than 18 years of age) without previously diagnosed diabetes mellitus.
Diagnostic criteria
Type 2 diabetes and impaired glucose tolerance: the diagnosis should have been established using the standard criteria valid at the time of the beginning of the trial (ADA 1997; ADA 1999; NDDG 1979; Unwin 2002; WHO 1980; WHO 1985; WHO 1999).
Overweight
Body mass index greater than 25 (body mass in kg / height in (m2)) (FAO/WHO 2003).
Abdominal obesity
Waist circumference equal to or more than 102 cm in men and equal to or more than 88 cm in women (FAO/WHO 2003).
Insulin resistance
Cut‐off values for defining insulin resistance vary since different methods are used for assessment of insulin resistance (Monzillo 2003). Under hyperinsulinemic, euglycemic conditions, glucose uptake below lowest quartile for background population under investigation is defined as insulin resistance according to the WHO (WHO 1999).
Types of interventions
Randomised controlled trials or controlled clinical trials
Trials were included which compared diets rich in whole‐grain foods (foods that contain more than 51% of whole grain) with diets rich in refined‐grain foods. Both diets should have similar overall sugar, starch, fat and protein content.
Cohort studies
Studies had to assess the intake of whole‐grain foods (foods that contain more than 25% of whole grain) or cereal fibre (as marker for whole grain food intake).
Types of outcome measures
Primary outcomes
Randomised controlled trials or controlled clinical trials
Ideally incidence of type 2 diabetes is the main outcome. However, it was anticipated that there are hardly any randomised controlled trials or controlled clinical trials assessing the incidence of type 2 diabetes because of the long intervention duration needed. Therefore, also trials assessing the changes in major risk factors for type 2 diabetes, including impaired glucose tolerance, insulin resistance and overweight were considered.
Cohort studies
Incidence of type 2 diabetes mellitus.
Secondary outcomes
Randomised controlled trials or controlled clinical trials
adverse effects (for example bloating, flatulence);
patient satisfaction;
health‐related quality of life;
total mortality;
morbidity;
costs.
Confounders
Compliance.
Timing of outcome assessment
Trials had to have a minimum of six weeks of intervention period.
Cohort studies
Incidence of major risk factors for type 2 diabetes, including impaired glucose tolerance, insulin resistance and overweight.
Confounders
age;
physical activity;
family history of diabetes;
body mass index.
Timing of outcome assessment
Prospective studies had to have of a minimum duration of five years.
Search methods for identification of studies
Electronic searches
The following electronic data bases were searched:
The Cochrane Library (issue 2, 2006);
MEDLINE (until May 2006);
EMBASE (until May 2006);
CINAHL (until May 2006);
AMED (until May 2006).
The database of ongoing trials, 'Current Controlled Trials' (www.controlled‐trials.com ‐ until May 2006) and the 'Science Citation Index' was searched (until October 2006), the latter to identify relevant studies that cited the primarily retrieved studies. No language restriction was applied for searching and study inclusion.
The described search strategy (see for a detailed search strategy under Appendix 1) was used for MEDLINE. For use with the other databases this strategy was slightly adapted.
Additional searches
Authors of relevant identified studies and other experts (authors of reviews) were contacted in order to obtain additional references, unpublished trials or ongoing trials.
Handsearches
The reference lists of all included studies and of review articles were screened in order to identify possible studies of interest. The handsearch of specialised journals was not done because the sensitivity of the electronic data base search improved by omitting study design limitations and all relevant journals were included in the electronic data bases.
Data collection and analysis
Selection of studies
The title and abstract of each record of the search was independently assessed by two authors (MGP, JJvB). Studies were rejected if the article definitely did not meet the review's inclusion criteria; otherwise the full text of the study was obtained. Interrater agreement for study selection was measured using the kappa statistic (Cohen 1960). Differences between authors' results were resolved by discussion. Duplicate publications were aimed to be identified by comparing publications of the same authors with respect to study populations, location, date and follow‐up time of the study.
Data extraction and management
From original reports of the studies data were independently extracted by two authors. Differences in results were resolved by discussion and if necessary a third author was consulted.
From (randomised) controlled trials the following data were extracted:
general information: published/unpublished, title, authors, source, country, year of publication, funding, duplicate publication;
trial characteristics: design, duration, randomizations, concealment of allocation, blinding, checking of blinding;
intervention: length of intervention, dietary advice/diet provided, comparison interventions;
participants: population, exclusion criteria, number (total, per compared groups), age, gender, health condition, diagnostic criteria used to define health condition, similarity groups at baseline, medication used, assessment of compliance, withdrawals/losses to follow‐up, confounders: body mass index, physical activity, family history of diabetes;
outcomes: outcomes specified above, main outcomes assessed in the study;
results: for outcomes and times of assessment (including a measure of variation), intention‐to‐treat analyses.
The following data were extracted from cohort studies (adapted data extraction form of the Cochrane Non‐Randomised Studies Methods Group).
general information: published/unpublished, title, authors, source, country, year of publication, duplicate publication;
study characteristics: design, dates of enrolment, follow‐up;
exposure: type, type of measurement, validation of measurement, time‐points measurements;
outcome: type, criteria used, type of measurement, validation of measurement;
participants: number identified, number excluded, number lost to follow‐up, characteristics;
results: total number cases, cases in group with lowest and highest intake, results of outcome, confounders adjusted for.
Assessment of risk of bias in included studies
Randomised controlled trials or controlled clinical trials
The quality of reporting of each trial was assessed based largely on the quality criteria specified by Schulz and by Jadad (Jadad 1996; Schulz 1995). In particular, the following factors were studied: (1) Minimisation of selection bias ‐ a) was the randomisation procedure adequate? b) was the allocation concealment adequate? (2) Minimisation of performance bias ‐ were the participants and people administering the treatment blind to the intervention? (3) Minimisation of attrition bias ‐ a) were withdrawals and dropouts completely described? was analysis by intention‐to‐treat? (4) Minimisation of detection bias ‐ were outcome assessors blind to the intervention?
Ad 2) As the treatment was a dietary intervention in which blinding participants and people administering the food is not possible, these criteria were not rated.
Based on these criteria, studies were broadly subdivided into the following three categories (Higgins 2005): A ‐ all quality criteria met: low risk of bias. B ‐ one or more of the quality criteria only partly met: moderate risk of bias. C ‐ one or more criteria not met: high risk of bias.
This classification was intended to be used as the basis of a sensitivity analysis.
Cohort studies
The quality of cohort studies was assessed using the following criteria (derived from Form III for the assessment of a cohort study, version February 2003, www.cochrane.nl): ‐ number of appropriate confounders investigated and adjusted for; ‐ same method of measurement of outcome in exposed and unexposed group; ‐ quality of method used to assess outcome measures: self report without validation, self report with validation, direct measurement/medical records; ‐ quality of method used to assess whole‐grain intake: food frequency questionnaire without validation, food frequency questionnaire with validation; single measurement, repeated measurement; ‐ duration and completeness of follow‐up.
Quality of studies was independently examined by two authors. Differences in results were resolved by discussion and if necessary a third author was consulted.
Assessment of reporting biases
Publication bias was to be assessed by preparation of a 'funnel plot' and examined statistically for signs of asymmetry (Egger 1997).
Data synthesis
Data were intended to be summarized statistically if they were sufficiently similar, and of sufficient quality. For continuous outcomes, weighted mean differences were to be used to analyse the size of the effects of the interventions. The effect sizes for dichotomous data were to be expressed in terms of relative risks, odds ratios or hazard ratios.
In RCTs intention‐to‐treat analysis was planned to be used when the information was provided.
All data were to be initially analysed with a fixed‐effect model. Heterogeneity between trial results were to be tested by using a standard chi‐squared test. To quantify inconsistency the I‐squared statistic was to be used (Higgins 2003) which describes the percentage of the variability in effect estimates that is due to heterogeneity rather than sampling error. A value greater than 50% was to be considered substantial heterogeneity. Possible causes of heterogeneity were to be explored by conducting subgroup and sensitivity analyses. If significant heterogeneity is found, it is unreasonable to assume that there is one 'true' effect underlying the data, that is constant across different populations and therefore a random effects model was to be used.
Subgroup analysis and investigation of heterogeneity
When the amount of data permits, subgroup analyses were to be conducted according to age, sex, duration of intervention, types of whole grain foods and amounts of whole grain foods consumed, since variations may be due to characteristics of dietary intervention.
Sensitivity analysis
It was intended to perform sensitivity analyses in order to explore the influence of the following factors on effect size:
repeating the analysis excluding unpublished studies (if there were any).
repeating the analysis taking account of study quality, as specified above.
repeating the analysis excluding any very long or large studies to establish how much they dominate the results.
repeating the analysis excluding studies using the following filters: diagnostic criteria, language of publication, source of funding (industry versus other), country.
repeating the analysis excluding studies about which no primary consensus was reached.
The robustness of the results was also to be tested by repeating the analysis using different measures of effect size (risk difference, odds ratio etc.) and different statistical models (fixed and random‐effects models).
Results
Description of studies
Results of the search
With the MEDLINE search 3395 possibly eligible studies were found. With the search in EMBASE 1560 additional studies were identified. The search in CINAHL added another 586 studies, the search in AMED four and the search in The Cochrane Library 259 more studies (total 5804 possibly eligible studies). With the initial screening of the 5804 possibly eligible studies 22 studies were identified and the full text of these studies was obtained. After detailed examination 11 studies were excluded. No further study was found searching the database of ongoing trials (Current Controlled Trials ‐ www.controlled‐trials.com) and scanning the reference lists of all so far included studies and of review articles. By searching the Science Citation Index to identify relevant studies that have cited the primarily retrieved studies one further study was found (van Dam 2006). For an overview of study selection please see Figure 1 showing details of the amended QUOROM (quality of reporting of meta‐analyses) statement.
1.

QUOROM (quality of reporting of meta‐analyses) flow chart of study selection
Authors of the identified relevant studies and other experts (authors of reviews) were contacted in order to obtain additional references, unpublished trials, or ongoing trials. No additional study was retrieved by this means. The possibility that certain publications were duplicates was examined by comparing publications of the same authors with respect to study populations, location, date and follow‐up time of the study. No duplicate publications were identified.
Interrater agreement
The interrater agreement for study selection was measured using the kappa statistic (Cohen 1960) and was 0.57 which indicates moderate agreement. Differences between authors' results were resolved by discussion.
Missing data
Two authors were contacted to retrieve additional information.
Included studies
In total 12 studies were identified that met all the inclusion criteria. One study was a randomised controlled trial and eleven were cohort studies. Details of the randomised controlled trial are listed in Appendix 2 and details of the prospective cohort studies are shown in Appendix 3.
The following gives a brief overview:
Randomised controlled trial
Design and duration
The trial of Pereira et al (Pereira 2002) had a cross‐over design with two six‐week feeding periods and a washout period of six to nine weeks.
Participants
Twelve overweight or obese (BMI 27 to 36 kg/m2) hyperinsulinemic adults aged 25 to 56 years (six women, six men) took part in the trial.
Interventions
One diet contained products of refined grains, thus products with no bran or germ and little fibre. In the other diet the refined grain products where substituted by whole grain products. All food of the two different diets was prepared at the metabolic kitchen of the research centre where the study was conducted. The participants stayed there during the two feeding periods and were asked to consume all of the food provided to them and to consume no other food, except energy‐free beverages.
Outcome measures
Fasting insulin concentrations, insulin resistance (homeostasis method) and insulin sensitivity (euglycemic hyperinsulinemic clamp test) were determined.
Cohort studies
Design and duration
All 11 studies were prospective cohort studies. Four had a follow‐up duration of six years (Meyer 2000; Montonen 2003; Salmeron 1997a; Salmeron 1997b), three lasted eight years (Koh‐Banerjee 2004; Schulze 2004; van Dam 2006), one nine years (Stevens 2002), one 10 years (Liu 2000) and two 12 years (Fung 2002; Liu 2003). In all but one studies the results were reported in risks across quintiles of whole‐grain or cereal fibre intake. Montonen et al. (Montonen 2003) assessed the risk across quartiles.
Participants
All participants were without previous diagnosis of diabetes. In six studies participants were only women (Liu 2000; Liu 2003; Meyer 2000; Salmeron 1997a; Schulze 2004; van Dam 2006). In three studies only men participated (Fung 2002; Koh‐Banerjee 2004; Salmeron 1997b), in the other two studies participants were men and women. Age at base line of inclusion was 21 to 75 years, and the age range of the cohorts varied from 14 to 47 years. One study compared the risk of whites with that of African‐Americans (Stevens 2002). In one study participants were only African‐American women (van Dam 2006). In the other studies ethnicity was not mentioned. All studies were conducted in the United States, with the exception of one, which was located in Finland (Montonen 2003). In seven ( Liu 2000; Liu 2003; Fung 2002; Koh‐Banerjee 2004; Salmeron 1997a; Salmeron 1997b; Schulze 2004) of the eleven studies participants were health professionals.
Exposure
Four studies assessed cereal fibre intake (Salmeron 1997a; Salmeron 1997b; Schulze 2004; Stevens 2002), three studies whole grain intake (Fung 2002; Liu 2003; van Dam 2006) and two studies both whole grain and cereal fibre intake (Meyer 2000; Montonen 2003). Two studies measured the change in whole grain intake (Koh‐Banerjee 2004; Liu 2003) and one of them also the change in cereal fibre intake (Koh‐Banerjee 2004). Whole grain food was defined in most studies (Fung 2002; Liu 2000; Liu 2003; Meyer 2000) according to Jacobs et al (Jacobs 1998) and Liu et al (Liu 1999) and included dark bread, popcorn, cooked oatmeal, wheat germ, brown rice, bran and other grains (e.g. bulgar, kasha, couscous). Whole‐grain breakfast cereals were classified as whole grain as they contained more than 25% whole grain or bran. Montonen et al (Montonen 2003) modified this classification and did not include wheat germ and bran. Reported amounts of food were converted to grams per day in their study. Koh‐Banerjee et al (Koh‐Banerjee 2004) used in addition to the previous described classification the definition issued by the FDA for products eligible for a whole‐grain health claim: foods that contain more than 51% of whole grain (all portions of the kernel) per reference amount customarily consumed (FDA 2005). Van Dam et al (van Dam 2006) assessed the intake of whole grains in form of "dark breads, such as wheat, rye, pumpernickel" and "high fibre, bran or granola cereals, shredded wheat".
Outcome measures
Nine studies measured the incidence of type 2 diabetes (Fung 2002; Liu 2000; Meyer 2000; Montonen 2003; Salmeron 1997a; Salmeron 1997b; Schulze 2004; Stevens 2002; van Dam 2006) and two studies changes in weight gain (Koh‐Banerjee 2004; Liu 2003). One study reported the incidence of obesity (BMI more than 30 kg/m2) and severe weight gain (more than 25 kg) (Liu 2003). The effect sizes for dichotomous data were expressed in terms of relative risks (RR) in most studies, odds ratios (OR) in one study (Liu 2003) or hazard ratios (HR) (Stevens 2002; van Dam 2006) in two studies. RRs and HRs reported are comparisons between the upper category of intake (highest quartile/quintile) and the lowest category (lowest quartile/quintile). The methods used to determine RRs and HRs are listed in (see under Appendix 4. Qality assessment of cohort studies" as well as the initial and adjusted effect sizes. In the publications no information of goodness of fit of the statistical models were given. In all but two studies outcome was assessed with a biennial questionnaire which was mailed to all participants. Stevens et al (Stevens 2002) assessed incidence of diabetes every three years and Montonen et al (Montonen 2003) gained information about new type 2 diabetes cases needing drug therapy via a central register of all patients receiving drug reimbursement. None of the studies reported insulin sensitivity or glucose intolerance.
Original purpose
The original purpose of most studies was to investigate how diet and other lifestyle factors influence the development of various diseases. The primary aim of the Black Women's Health study (van Dam 2006) was to identify risk factors for diseases with high prevalence in black women. The ARIC study (Stevens 2002) was designed to investigate the aetiology of atherosclerosis and variation in cardiovascular risk factors, medical care and disease by race, gender, location and date.
Excluded studies
Eleven studies were excluded. The main reason of exclusion was that the diet administered during the intervention did not fulfil the inclusion criteria (for details see under Characteristics of excluded studies).
Risk of bias in included studies
Randomised controlled trials
The included trial (Pereira 2002) was a six‐week intervention study in 12 persons with a cross‐over design and a washout period of six to nine weeks.
Minimisation of selection bias
In the publication the trial was described as randomised but no information about the randomisation procedure was given. Also, no attempt to allocation concealment was described.
Minimisation of attrition bias
Data of three persons (25%) could not be used for the outcome insulin sensitivity. One person became ill during the wash‐out period and did not complete the study. In two persons the clamp tests were not completed due to technical difficulties.
Minimisation of detection bias
According to the protocol blinding of participants and people administering the food was not rated as this concerns a dietary intervention in which blinding is not possible. Blinding of the outcome assessor was not reported in the publication.
Based on these quality criteria there is a high risk of bias in this trial (category C).
Cohort studies
Number of appropriate confounders investigated and adjusted for
The number of confounders that were used to correct the results varied considerably between the studies included (see under Appendix 4). Thirty six percent of the studies did not adjust for confounders that should have been minimally considered, namely BMI, physical activity and family history of diabetes. Three studies (Meyer 2000; Montonen 2003; Stevens 2002) did not correct for family history of diabetes and one study did not account for physical activity (Montonen 2003). Confounders were assessed with a self‐administered questionnaire. Five studies (Meyer 2000; Montonen 2003; Salmeron 1997a; Salmeron 1997b; van Dam 2006) did not repeat the assessment done at baseline, three studies (Fung 2002; Koh‐Banerjee 2004; Schulze 2004) repeated the assessment every two years and one study (Liu 2003) once after two years and twice after four years. From two publications (Liu 2000; Stevens 2002) it became not clear whether assessment of confounders was repeated.
Same method of measurement of outcome in exposed and unexposed group
In all studies in all participants the same method of outcome measurement was used regardless of the level of whole grain or cereal fibre intake.
Quality of method used to assess outcome measures: self report without validation, self report with validation, direct measurement/medical records
In nine studies the outcome was self‐reported. In one study it was directly measured (serum glucose concentrations) (Stevens 2002) and in one study (Montonen 2003) a central register of patients receiving drug reimbursement was used. All studies using self‐reported diagnosis of type 2 diabetes validated the outcome in subgroups by comparing it with medical records. Studies with weight gain as an outcome measure validated the self‐reported weight in subgroups by measuring weight directly (Koh‐Banerjee 2004; Liu 2003). The validation studies showed over all a high agreement between self report and control assessment (see Appendix 4). The number of participants in the validation studies lay between 59 and 184. No information was given on what ground the subgroup size was chosen.
Quality of method used to assess whole‐grain intake
Dietary intake over the previous year was assessed with mailed semi‐quantitative food frequency questionnaires (FFQ) in nine studies, in one study (Stevens 2002) it was interviewer administered and in one study (Montonen 2003) a dietary history interview was taken. The FFQ mostly assessed the intake of 100 to 134 items, two studies assessed intake of less than 100 items (68 items (van Dam 2006); 66 items (Stevens 2002)). Dietary assessment was repeated one to three times in five studies (Fung 2002; Koh‐Banerjee 2004; Liu 2000; Liu 2003; Schulze 2004); the other studies did not repeat the assessment. In all studies results of the dietary assessment were validated against results of detailed diet records in subgroups. In two studies (Schulze 2004; Stevens 2002) an FFQ was used that was not validated in a subgroup of the same population. Examples of relevant correlation coefficients are listed in Appendix 4' and showed variable agreement. The number of participants in the validation studies lay between 44 and 1844. No information was given on what ground the subgroup size was chosen.
Duration and completeness of follow‐up
The duration of the studies lay between six and twelve years and was considered to be long enough. Loss to follow‐up (from sample to study population) was only described in one study. Stevens et al (Stevens 2002) reported an initial response rate of 67% in whites and of 42% in African‐American. Four studies reported response rates to the repeated assessments of outcome. More than 80% responded to biennial questionnaires send to the study population in the study of van Dam et al (van Dam 2006) and 94% in that of Fung et al. (Fung 2002). The response rate to the questionnaires in the study of Meyer et al (Meyer 2000) declined during the study period (91%, 86%, 79%). Stevens et al (Stevens 2002) reported that a total of approximately 80% of the study population that remained alive at the end of the study period was examined at all four visits.
Interrater agreement
The interrater agreement for study quality was measured using the kappa statistic (Cohen 1960) and was 0.88. Differences between authors' results were resolved by discussion.
Effects of interventions
Randomised controlled trial
Primary outcome measures
Results of insulin sensitivity measurements of both intervention periods were retrieved from the author (Pereira 2002) as only the mean difference was given in the publication. Insulin sensitivity (M‐value) was measured with the euglycemic hyperinsulinemic clamp test and was significantly higher after the feeding period with whole grain (0.396 x 10‐4 ± 0.131 x 10‐4 mmol . kg‐1 . min ‐1 per pmol/L) than after that with refined grain (0.323 x 10‐4 ± 0.043 x 10‐4 mol . kg‐1 . min ‐1 per pmol/L) (mean difference: 0.07 x 10‐4 mmol . kg ‐1 . min‐1 per pmol/L, 95% CI 0.003 x 10‐4 to 0.144 x 10‐4; P < 0.05). To examine violation of the cross‐over design assumption, the period by treatment interaction was assessed in statistical models and not found to be significant. In all the final models the main effect of period was included.
Secondary outcome measures
Adverse effects
Gastrointestinal symptoms recorded (heartburn, indigestion, diarrhoea, loose stools) were not significantly different between diets. Frequency of bowel movements significantly increased with the whole‐grain diet (2 ± 0.2 versus 1 ± 0.2 movements/d; P < 0.001).
Patient satisfaction
Patient satisfaction was not included as an outcome.
Health‐related quality of life
Health‐related quality of life was not included as an outcome.
Total mortality
Total mortality was not included as an outcome.
Morbidity
Morbidity was not included as an outcome.
Costs
Costs were not included as an outcome.
Confounders
Compliance was controlled by comparing the energy content of supplied food not eaten and food that was extra eaten (not supplied).
The energy content of food not eaten during the intervention periods did not differ significantly between the whole‐grain (159 ± 75 kJ/d) and the refined‐grain (222 ± 126 kJ/d) diets. Also, the energy content of extra food intake was not different (46 ± 25 kJ/d whole‐grain diet; 63 ± 33 kJ/d refined‐grain diet).
Cohort studies
Data of studies were not pooled because of methodological diversity (measures of effect size, statistical analyses used, number of collected confounders).
Whole grain intake and incidence of type 2 diabetes
Intake of whole grain was inversely associated with risk of type 2 diabetes in all five studies (comparison 01.01) which, however, was not statistically significant in one study (Montonen 2003). The discrepancy of this result with that of the other studies could be caused by the relatively low number of participants (4.316) in this study compared to mostly far more than 10.000 participants in the other studies, which is also reflected by the width of the confidential interval (0.67, 95% confidence interval (CI) 0.32 to 1.38).
The relative risks (RR) varied between 0.67 (95% CI 0.32 to 1.38) and 0.79 (95% CI 0.65 to 0.96). After exclusion of studies that did not correct for family history of diabetes (Meyer 2000; Montonen 2003) and physical activity (Montonen 2003), the observed effect was very similar in the rest of the studies (RR of 0.70, 0.73 and 0.73).
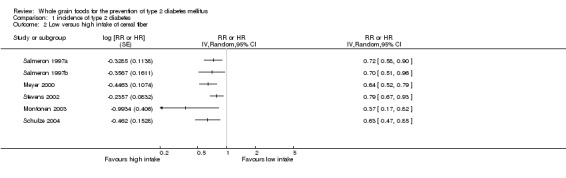
Cereal fibre intake and incidence of type 2 diabetes
Intake of cereal fibre was inversely associated with type 2 diabetes in all six studies (comparison 01.02). The RR varied between 0.37 (95% CI 0.20 to 0.77) and 0.79 (95% CI 0.67 to 0.93). Exclusion of studies that did not correct for family history of diabetes (Meyer 2000; Montonen 2003; Stevens 2002) and physical activity (Montonen 2003) narrowed the range of the effect; the RR lay between 0.63 and 0.72.
Stevens et al (Stevens 2002) also compared the hazard ratios of diabetes in two subpopulations: cereal fibre intake was inversely associated with risk of diabetes in whites and African‐Americans (0.86,95% CI 0.65 to 1.15) but statistically different only in whites (0.75, 95% CI 0.60 to 0.92).
Change in whole grain intake and change in weight gain
The results of the studies investigating the association between change in whole grain or cereal fibre intake and change in weight gain are shown in Appendix 5. Over a time period of eight years weight gain was reduced by 0.5 kg or 0.3 kg in the groups that increased whole grain intake the most (dependent on the definition of whole grain) in one study in men (Koh‐Banerjee 2004) and by 0.4 kg over a period of 12 years in another study in women (Liu 2003). Similar results were observed when change in cereal fibre intake was considered (0.4 kg less weight gain in eight years) (Koh‐Banerjee 2004). The odds of developing obesity (0.81, 95%CI 0.73 to 0.91) or having a major weight gain (0.77, 95% CI 0.59 to 1.01) tended to be lower with increased intake of whole grain foods, as reported in the study of Liu et al (Liu 2003).
Assessment of publication bias
Publication bias was not assessed as it was considered to be not useful due to the low number of studies (Lau 2006).
Discussion
Summary of main results
This review identified 12 studies examining the relation between whole grain intake and the development of type 2 diabetes. Only one study was a randomised controlled trial, the other 11 prospective cohort studies. The RCT had a cross‐over design and showed slight improvement of insulin sensitivity in obese hyperinsulinaemic participants after the whole grain intervention of six weeks. However, the risk of bias in this study is considered to be high since allocation concealment was not stated and the randomisation procedure was not described. The trial was of short duration (minimum time period needed for inclusion) with a small sample size. Whether the small elevation of the insulin sensitivity has any clinical relevance is doubtful. However, from a theoretical perspective it could add to the delay of the onset of type 2 diabetes.
The results of the cohort studies were homogenous. None of the studies showed the opposite effect; in one study the effect was not significant. Significantly decreased risk of development of type 2 diabetes was associated in four cohort studies with high whole grain intake (range: 21% to 30%) and in six studies with high cereal fibre intake, (range: 21% to 63%) which can be considered to be a marker of whole grain consumption. Two studies investigated the effect of whole grain consumption on overweight, an important risk factor for type 2 diabetes. Increased whole grain consumption was associated with only a very slight reduction (0.3 to 0.5 kg) in weight gain and a reduced risk of becoming obese during the follow‐up period. The slight reductions in weight gain can not be regarded as clinical relevant considering the long time periods (eight and twelve years) in which they were observed. The methodological quality varied between studies mainly with regard to the food intake assessment and the numbers of confounders considered. Food intake was in most studies assessed with food frequency questionnaires. One limitation of this approach is the small number of food items listed (66 to 134 items) which restricts extensive assessment of the food products of interest. None of the food frequency questionnaires was designed especially for assessment of whole grain foods. Measurement error of food intake due to inter‐individual variation during the course of the years can be reduced by repeated collection of dietary information. Only five studies repeated the measurement to obtain a better reflection of the long‐term intake. Measurement errors in dietary intake may thus have limited the ability to obtain accurate risk estimates. Residual confounding is a problem in prospective cohort studies. As observed in these studies, higher intake of whole grain food tends to be associated with healthier lifestyle and incomplete adjustment of lifestyle factors may result in an overestimation of the effect.
Potential biases in the review process
The main limitation of this review is that evidence of a possible protective effect of a diet rich in whole grain foods on the development of type 2 diabetes is retrieved only from prospective cohort studies of which some were of limited quality. As prospective cohort studies are more prone to bias and confounding than randomised controlled trials results have to be interpreted with caution.
Generalisability and applicability of results
All but one study were conducted in the United States. Most American studies were done in health care workers but the results of three different populations (Iowa women Health study (Meyer 2000), Atherosclerosis Risk in Communities study (Stevens 2002) and U.S. black women study (van Dam 2006)) were comparable as were those of the study conducted in Finland (Montonen 2003). As the majority of studies was conducted in only one part of the world generalisability of results is uncertain.
Authors' conclusions
Implications for practice.
The evidence from the prospective cohort trials is considered to be too weak to be able to draw a definite conclusion about the preventive effect of whole grain foods on the development of type 2 diabetes.
Implications for research.
Properly designed long‐term randomised controlled trials are needed to establish whether whole grain foods are protective for the development of type 2 diabetes. To facilitate this, further mechanistic research should focus on finding a set of relevant intermediate endpoints for type 2 diabetes and on identifying genetic subgroups of the population at risk that are most susceptible to dietary intervention.
What's new
| Date | Event | Description |
|---|---|---|
| 1 November 2008 | Amended | Converted to new review format. |
Acknowledgements
We thank Prof. Mark Pereira and Prof. June Stevens for providing additional data on their studies. We are grateful to Prof. Ronald Stolk for advice on the final draft of the review. This paper has been written with financial support from the Commission of the European Communities, specific RTD programme "Quality of Life and Management of Living Resources", QLK 1‐2001‐00431 "Stable isotope applications to monitor starch digestion and fermentation for the development of functional foods" (www.eurostarch.org). It does not necessarily reflect its views and in no way anticipates the Commission's future policy in this area.
Appendices
Appendix 1. Search strategy
| Search terms |
| Unless otherwise stated, search terms are free text terms; MeSH = Medical subject heading (Medline medical index term); exp = exploded MeSH; the dollar sign ($) stands for any character(s); the question mark (?) = to substitute for one or no characters; tw = text word; pt = publication type; sh = MeSH; adj = adjacent. 1. wholemeal$.tw. 2. whole meal$.tw. 3. wholegrain$.tw. 4. whole grain$.tw. 5. exp CEREALS/ 6. cereal$.tw. 7. grain$.tw. 8. exp Dietary fibre/ 9. dietary fibre$.tw. 10. dietary fibre$.tw. 11. exp Dietary Carbohydrates/ 12. exp Glycemic index/ 13. dietary carbohydrate$.tw. 14. (glyc?emic ind$ or GI).tw. 15. or/1‐14 16. exp Insulin Resistance/ 17. impaired glucose toleranc$.tw. 18. glucose intoleranc$.tw. 19. insulin resistanc$.tw. 20. exp Obesity/ 21. pluri?metabolic syndrom$.tw. 22. exp Diabetes Mellitus, Type 2 23. exp Metabolic Syndrome X/ 24. or /16‐23 25. 15 and 24 |
Appendix 2. Characteristics: randomized controlled trial
| Study ID | Methods | Participants | Interventions | Outcomes | Allocation conc. |
| Pereira 2002 | Cross‐over nonblinded RCT; 2 feeding periods of 6 weeks, wash‐out period of 6 ‐ 9 weeks; randomisation done but method unclear | 6 men, 6 women; age: 21 ‐ 65 y exclusion criteria: ‐ Body Mass Index > 26 and < 36 ‐ Body weight fluctuation over the past 6 mo of > 10 % ‐ Smoking cigarettes ‐ Consuming > 2 alcoholic beverages/d ‐ Having diabetes, cancer, cardiovascular disease and other chronic clinical conditions ‐ Taking medications that would affect glucose, insulin, lipids or blood pressure ‐ Engaging in a high level of physical activity ‐ Following a special diet ‐ Allergic to any foods ‐ Planning to change dietary habits, increase physical activity, change body weight, move out of town or take a lengthy vacation during the time of the study ‐ Fasting blood glucose > 6.0 mmol/L ‐ Fasting insulin < 90 pmol/L | Refined grain foods versus whole grain foods at breakfast, lunch and dinner; food provided | Body weight, satiety, self‐reported physical activity, fasting insulin, postprandial insulin, insulin resistance, insulin sensitivity, side effects | Unclear |
| Footnotes conc: concealment |
Appendix 3. Characteristics: cohort studies
| Study ID | Methods | Participants | Interventions | Outcomes | Allocation conc. | Outcome | No. of cases | Med. intake low. qu. | Med. intake hig. qu. |
| Pereira 2002 | Cross‐over nonblinded RCT; 2 feeding periods of 6 weeks, wash‐out period of 6 ‐ 9 weeks; randomisation done but method unclear | 6 men, 6 women; age: 21 ‐ 65 y exclusion criteria: ‐ Body Mass Index > 26 and < 36 ‐ Body weight fluctuation over the past 6 mo of > 10 % ‐ Smoking cigarettes ‐ Consuming > 2 alcoholic beverages/d ‐ Having diabetes, cancer, cardiovascular disease and other chronic clinical conditions ‐ Taking medications that would affect glucose, insulin, lipids or blood pressure ‐ Engaging in a high level of physical activity ‐ Following a special diet ‐ Allergic to any foods ‐ Planning to change dietary habits, increase physical activity, change body weight, move out of town or take a lengthy vacation during the time of the study ‐ Fasting blood glucose > 6.0 mmol/L ‐ Fasting insulin < 90 pmol/L | Refined grain foods versus whole grain foods at breakfast, lunch and dinner; food provided | Body weight, satiety, self‐reported physical activity, fasting insulin, postprandial insulin, insulin resistance, insulin sensitivity, side effects | Unclear | T2 DM | 915 | Cereal fibre: 2 g/d | Cereal fibre: 8 g/d |
| T2 DM | 523 | Cereal fibre: 3 g/d | Cereal fibre: 10 g/d | ||||||
| Footnotes conc: concealment | T2 DM | 1879 | Whole grain: 0 servings/day | Whole grain: 3 servings/day | |||||
| Meyer 2000 | United States | 35 988 women | 1986 ‐ 1992 6 years | 55 ‐ 69 y | 127‐item FFQ | T2 DM | 1141 | Cereal fibre: 3 g/d Whole grain: 1 serving/week | Cereal fibre: 9 g/d Whole grain: 21 servings/week |
| Fung 2002 | United States | 42 898 men | 1986 ‐ 1998 12 years | 40 ‐ 75 y | 131‐item FFQ | T2 DM | 1197 | Whole grain: 0 servings/day | Whole grain: 3 servings/day |
| Montonen 2003 | Finland | 4 316: 2 286 men 2 030 women | 1966 ‐ 1972 6 years | 40 ‐ 69 y | dietary history interview with 100‐item FFQ | T2 DM | 156 | Cereal fibre: 1 ‐ 12 g/d Whole grain: 0 ‐ 109 g/d | Cereal fibre: 25 ‐ 111 g/d Whole grain: 238 ‐ 1321 g/d |
| Schulze 2004 | United States | 91 249 women | 1991 ‐ 1999 8 years | 24 ‐ 44 y | 133‐item FFQ | T2 DM | 741 | Cereal fibre: 3 g/d | Cereal fibre: 8 g/d |
| Stevens 2002 | United States | 12 251 9 529 whites 2 722 African‐American | 1987 ‐ 1998 11 years | 45 ‐ 65 y | 66‐item FFQ interviewer administered | DM | 1447 | Cereal fibre 2 g/d | Cereal fibre 7 g/d |
| Liu 2003 | United States | 74 091 women | 1984‐1996 12 years | 38 ‐ 63 y | 126‐item FFQ | Obesity, body weight change | 6400 obese 657 major weight gain | change in whole grain intake ‐ 1 serving/1000 kcal/day | change in whole grain intake 1 serving/1000 kcal/day |
| Koh‐Banerjee 2004 | United States | 27 082 men | 1986‐1994 8 years | 40 ‐ 75 y | 131‐item FFQ | Body weight change | Change in whole grain intake, definition Jacobs et al. 1998 ‐ 11 g/d change in whole grain intake, def. FDA ‐ 17.8 g/d change in cereal fibre intake ‐ 2.2 g/d | Change in whole grain intake, definition Jacobs et al. 1998 27 g/d change in whole grain intake, def. FDA 15.6 g/d change in cereal fibre intake 5.1 g/d | |
| van Dam 2006 | United States | 41 186 African‐ American women | 1995 ‐ 2003 8 years | 21 ‐ 69 y | 68‐item FFQ | T2 DM | 1964 | Whole grains; 0 servings/day | Whole grains: 1 servings/day |
| Footnotes FFQ: food frequency questionaire T2 DM: type 2 diabetes mellitus | ass: assessment | med: median | low: lowest | high: highest | qu: quartile/quintile |
Appendix 4. Quality assessment: of cohort studies
| Study name | Diet. ass. repeated | Diet. ass. validated | Validation corr. co. | Method outcome ass. | Validation outcome | Crude RR/HR, method | Adjusted RR/HR | Confounders |
| Salmeron 1997a | no | yes | n = 173 white bread: 0.71 dark bread: 0.77 | self‐report | n = 62 98% confirmed by medical record | not reported logistic regression | Cereal fibre: 0.72 (95% CI 0.58 to 0.90) | age, BMI, alcohol intake, smoking status, physical activity, family history of diabetes |
| Salmeron 1997b | no | yes | n = 127 fibre: 0.78 carbohydrates: 0.81 | self‐report | as Salmeron 1997a | not reported logistic regression | Cereal fibre: 0.70 (95% CI 0.51 to 0.96) | age, BMI, alcohol intake, smoking status, physical activity, family history of diabetes |
| Liu 2000 | repeated 1986, 1990 | yes | as Salmeron 1997a | self‐report | as Salmeron 1997a | Whole grain: 0.62 (95% CI 0.53 to 0.71) age, energy adjusted pooled logistic regression | Whole grain: 0.73 (95% CI 0.63 to 0.85) | age, BMI, physical activity, cigarette smoking, alcohol intake, family history of diabetes in first‐degree relates, use of multivitamins or vitamin E supplements, total energy intake |
| Meyer 2000 | no | yes | n = 44 carbohydrates: 0.45 crude fibre: 0.24 | self‐report | n = 41 neg: 100% n = 44 pos: 64% by physicians | not reported proportional hazard regression | Cereal fibre: 0.64 (95% CI 0.53 to 0.79) Whole grain: 0.79 (95% CI 0.65 to 0.96 | age, total energy intake, BMI, waist‐to‐hip ratio, education, pack‐years of smoking, alcohol intake, physical activity |
| Fung 2002 | repeated 1990, 1994, 1998 | yes | as Salmeron 1997b | self‐report | n = 59 97% confirmed | Whole grain: 0.57 (95% CI 0.48 to 0.69) age adjusted, pooled logistic regression | Whole grain: 0.72 (95% CI 0.57 to 0.85) | age, BMI, physical activity, energy intake, missing food frequency questionnaire, smoking, family history of diabetes, alcohol intake, fruit intake, vegetable intake |
| Montonen 2003 | no | yes | 4‐8 mo, n = 93 total grain: 0.62, 4‐7 y, n = 1844 total grain: 0.39 | medical certificate needed for reimbursement of drug costs | not reported Cox's life table regression model | Cereal fibre: 0.37 (95% CI 0.16 to 0.82) Whole grain: 0.67 (95% CI 0.32 to 1.38) | age, sex, geographic area, smoking, BMI, intakes of energy, fruit, berries, vegetables, saturated fat, vitamins E and C, beta‐carotene, vitam B 6, folic acid, flavonoids, magnesium | |
| Schulze 2004 | repeated 1995 | not in same population | as Salmeron 1997a | self‐report not in same population | as Salmeron 1997a | Cereal fibre: 0.32 (95% CI 0.25 to 0.41) age‐adjusted Cox's proportional hazards analysis | Cereal fibre: 0.63 (95% CI 0.47 to 0.85) | age, BMI, energy intake, alcohol, smoking, physical activity, family history of diabetes, history of high blood pressure/high blood cholesterol, postmenopausal hormone use, oral contraceptive used, glycemic load, magnesium, caffeine |
| Stevens 2002 | no | not in same population | direct measurement fasting glucose, no distinction type 1 and 2 diabetes mellitus | not reported Cox's proportional hazards analysis | Cereal fibre: Whites: 0.75 (95% CI 0.60 to 0.92) African Americans: 0.86 (95% CI 0.65 to 1.15) Total population: 0.79 (95% CI 0.66 to 0.93) | age, BMI, energy intake, sex, smoking, education, physical activity, field center, race | ||
| Liu 2003 | repeated 1986, 1990, 1994 | yes | as Salmeron 1997a | self‐report | n = 184 correlation 0.96 self‐reported with measured | not applicable for results see 'Additional tables' Table 04 | age,changes in exercise, change in smoking status, change in hormone replacement therapy status, changes in intakes of alcohol, caffeine, and total energy; changes in intakes of saturated fat, polyunsaturated fat, monounsaturated fat, trans fat, and protein, BMI at baseline | |
| Koh‐Banerjee 2004 | repeated 1990, 1994 | yes | n = 127 refined‐grain foods: 0.30 cold breakfast cereals: 0.86 | self‐report: | n = 123 correlation 0.97 self‐reported with measured | not applicable for results see 'Additional tables' Table 04 | age, respective baseline exposure, smoking, baseline weight, baseline values and changes in refined grains, calories, total physical activity, alcohol, protein, trans, saturated, monounsaturated and polyunsaturated fats | |
| van Dam 2006 | no | yes | n = 408 fibre 0.57 | self‐report | n = 141 95% confirmed by physicians | Whole grain: 0.52 (95% CI 0.46 to 0.60) age‐adjusted Cox's proportional hazard regression models | Whole grain: 0.69 (95% CI 0.60 to 0.79) | age, total energy intake, BMI, smoking status, strenuous physical activity, alcohol consumption, parental history of diabetes, education level, coffee consumption, sugar‐sweetened soft drink consumption, quintiles of processed meat and other red meat consumption, low‐fat dairy consumption |
| Footnotes: | diet: dietary | ass: assessment | corr: correlation | co: coefficient |
Appendix 5. Results of studies assessing change and gain in weight
| Study | Measurement | Lowest quintile | Highest quintile | P for trend |
| Koh‐Banerjee 2003 | Median change in whole grain intake (g/d) Jacobs 1998 definition | ‐ 11 | 27 | |
| Change in weight (kg) (mean +/‐ SE) | 1.3 +/‐ 0.2 | 0.7 +/‐ 0.2 | < 0.0001 | |
| Koh‐Banerjee 2003 | Median change in whole grain intake (g/d) FDA definition | ‐ 18 | 16 | |
| Change in weight (kg) (mean +/‐ SE) | 1.0 +/‐ 0.2 | 0.7+/‐ 0.2 | 0.002 | |
| Koh‐Banerjee 2003 | Median change in cereal fibre intake (g/d) | ‐ 2 | 5 | |
| Change in weight (kg) (mean +/‐ SE) | 1.1 +/‐ 0.2 | 0.8 +/‐ 0.2 | 0.0002 | |
| Liu 2004 | Median change in whole grain intake (serving/day) | ‐ 1 | 1 | |
| Change in weight (kg) (mean SE) | 4.5 +/‐ 0.1 | 4.1 +/‐ 0.1 | < 0.0001 | |
| Liu 2004 | Odds ratio for BMI > 29.9 (n = 6 400) | 1 | 0.81 (95% CI 0.73 to 0.91) | 0.0002 |
| Liu 2004 | Odds ratio for weight gain > 24.9 kg (n = 657) | 1 | 0.77 (95% CI 0.59 to 1.01) | 0.03 |
Data and analyses
Comparison 1. incidence of type 2 diabetes.
| Outcome or subgroup title | No. of studies | No. of participants | Statistical method | Effect size |
|---|---|---|---|---|
| 1 Low versus high intake of whole grain | 5 | RR or HR (Random, 95% CI) | Totals not selected | |
| 2 Low versus high intake of cereal fiber | 6 | RR or HR (Random, 95% CI) | Totals not selected |
1.1. Analysis.

Comparison 1 incidence of type 2 diabetes, Outcome 1 Low versus high intake of whole grain.
1.2. Analysis.
Comparison 1 incidence of type 2 diabetes, Outcome 2 Low versus high intake of cereal fiber.
Characteristics of studies
Characteristics of excluded studies [ordered by study ID]
| Study | Reason for exclusion |
|---|---|
| Bakker 1998 | Only intake of total dietary fiber and not of cereal fiber was measured. |
| Feskens 1991 | Only carbohydrate intake was measured and not whole‐grain intake. |
| Hodge 1996 | Only intake of total dietary fiber and not of cereal fiber was measured. |
| Juntunen 2003 | The test meals did not fulfill our inclusion criteria. |
| Liese 2003 | This was a cross‐sectional study. |
| Marshall 1993 | Only intake of total dietary fiber and not of cereal fiber was measured. |
| Sloth 2004 | Both dietary interventions consisted of whole‐grain foods. |
| Vinceti 1994 | Intake of whole‐grain or cereal fiber was not measured. |
| Weickert 2006 | The test meals did not fulfill our inclusion criteria. |
| Wolever 2002 | The dietary intervention did not fulfill our inclusion criteria. |
| Wolever 2003 | The dietary intervention did not fulfill our inclusion criteria. |
Contributions of authors
MARION G PRIEBE: drafting protocol/review, searching and selection of studies, data extraction, quality assessment, data analysis and presentation
JAAP J VAN BINSBERGEN: contribution nutritional knowledge, co‐drafting protocol, searching and selection of studies, data extraction, quality assessment, data presentation, co‐drafting review
RIEN DE VOS: assistance with statistics and data analysis
ROEL J VONK: securing funding for review, co‐drafting review, providing general advice on the review
Sources of support
Internal sources
No sources of support supplied
External sources
Commission of the European Communities, Brussels, Belgium.
Declarations of interest
None known
Edited (no change to conclusions)
References
References to studies included in this review
Fung 2002 {published data only}
- Fung TT, Hu FB, Pereira MA, Liu S, Stampfer MJ, Colditz GA, et al. Whole‐grain intake and the risk of type 2 diabetes: a prospective study in men. American Journal of Clinical Nutrition 2002;76(3):535‐40. [DOI] [PubMed] [Google Scholar]
Koh‐Banerjee 2004 {published data only}
- Koh‐Banerjee P, Franz M, Sampson L, Liu S, Jacobs DR, Jr. , Spiegelman D et al. Changes in whole‐grain, bran, and cereal fiber consumption in relation to 8‐y weight gain among men. American Journal of Clinical Nutrition 2004;80(5):1237‐45. [DOI] [PubMed] [Google Scholar]
Liu 2000 {published data only}
- Liu S, Manson JE, Stampfer MJ, Hu FB, Giovannucci E, Colditz GA, et al. A prospective study of whole‐grain intake and risk of type 2 diabetes mellitus in US women. American Journal of Public Health 2000;90(9):1409‐15. [DOI] [PMC free article] [PubMed] [Google Scholar]
Liu 2003 {published data only}
- Liu S. Whole‐grain foods, dietary fiber, and type 2 diabetes: searching for a kernel of truth. American Journal of Clinical Nutrition 2003;77(3):527‐9. [DOI] [PubMed] [Google Scholar]
Meyer 2000 {published data only}
- Meyer KA, Kushi LH, Jacobs DR Jr, Slavin J, Sellers TA, Folsom AR. Carbohydrates, dietary fiber, and incident type 2 diabetes in older women. American Journal of Clinical Nutrition 2000;71(4):921‐30. [DOI] [PubMed] [Google Scholar]
Montonen 2003 {published data only}
- Montonen J, Knekt P, Jarvinen R, Aromaa A, Reunanen A. Whole‐grain and fiber intake and the incidence of type 2 diabetes. American Journal of Clinical Nutrition 2003;77(3):622‐9. [DOI] [PubMed] [Google Scholar]
Pereira 2002 {published data only}
- Pereira MA, Jacobs DR, Jr. , Pins JJ, Raatz SK, Gross MD, Slavin JL et al. Effect of whole grains on insulin sensitivity in overweight hyperinsulinemic adults. American Journal of Clinical Nutrition 2002;75(5):848‐55. [DOI] [PubMed] [Google Scholar]
Salmeron 1997a {published data only}
- Salmeron J, Manson JE, Stampfer MJ, Colditz GA, Wing AL, Willett WC. Dietary fiber, glycemic load, and risk of non‐insulin‐dependent diabetes mellitus in women. JAMA: the journal of the American Medical Association 1997;277(6):472‐7. [DOI] [PubMed] [Google Scholar]
Salmeron 1997b {published data only}
- Salmeron J, Ascherio A, Rimm EB, Colditz GA, Spiegelman D, Jenkins DJ, et al. Dietary fiber, glycemic load, and risk of NIDDM in men. Diabetes Care 1997;20(4):545‐50. [DOI] [PubMed] [Google Scholar]
Schulze 2004 {published data only}
- Schulze MB, Liu S, Rimm EB, Manson JE, Willett WC, Hu FB. Glycemic index, glycemic load, and dietary fiber intake and incidence of type 2 diabetes in younger and middle‐aged women. American Journal of Clinical Nutrition 2004;80(2):348‐56. [DOI] [PubMed] [Google Scholar]
Stevens 2002 {published data only}
- Stevens J, Ahn K, Juhaeri, Houston D, Steffan L, Couper D. Dietary fiber intake and glycemic index and incidence of diabetes in African‐American and white adults: the ARIC study. Diabetes Care 2002;25(10):1715‐21. [DOI] [PubMed] [Google Scholar]
van Dam 2006 {published data only}
- Dam van R, Hu FB, Rosenberg L, Krishnan S, Palmer JR. Dietary Calcium and Magnesium, Major Food Sources, and Risk of Type 2 Diabetes in U.S. Black Women. Diabetes Care 2006;29 (10):2238‐43. [DOI] [PubMed] [Google Scholar]
References to studies excluded from this review
Bakker 1998 {published data only}
- Bakker SJ, Hoogeveen EK, Nijpels G, Kostense PJ, Dekker JM, Gans RO, et al. The association of dietary fibres with glucose tolerance is partly explained by concomitant intake of thiamine: the Hoorn Study. Diabetologia 1998;41(10):1168‐75. [DOI] [PubMed] [Google Scholar]
Feskens 1991 {published data only}
- Feskens EJ, Bowles CH, Kromhout D. Carbohydrate intake and body mass index in relation to the risk of glucose intolerance in an elderly population. American Journal of Clinical Nutrition 1991;54(1):136‐40. [DOI] [PubMed] [Google Scholar]
Hodge 1996 {published data only}
- Hodge AM, Montgomery J, Dowse GK, Mavo B, Watt T, Zimmet PZ. A case‐control study of diet in newly diagnosed NIDDM in the Wanigela people of Papua New Guinea. Diabetes Care 1996;19(5):457‐62. [DOI] [PubMed] [Google Scholar]
Juntunen 2003 {published data only}
- Juntunen KS, Laaksonen DE, Poutanen KS, Niskanen LK, Mykkanen HM. High‐fiber rye bread and insulin secretion and sensitivity in healthy postmenopausal women. American Journal of Clinical Nutrition 2003;77(2):385‐91. [DOI] [PubMed] [Google Scholar]
Liese 2003 {published data only}
- Liese AD, Roach AK, Sparks KC, Marquart L, D'Agostino RB, Jr, Mayer‐Davis EJ. Whole‐grain intake and insulin sensitivity: the Insulin Resistance Atherosclerosis Study. American Journal of Clinical Nutrition 2003;78(5):965‐71. [DOI] [PubMed] [Google Scholar]
Marshall 1993 {published data only}
- Marshall JA, Weiss NS, Hamman RF. The role of dietary fiber in the etiology of non‐insulin‐dependent diabetes mellitus. The San Luis Valley Diabetes Study. Annals of Epidemiology 1993;3(1):18‐26. [DOI] [PubMed] [Google Scholar]
Sloth 2004 {published data only}
- Sloth B, Krog‐Mikkelsen I, Flint A, Tetens I, Bjorck I, Vinoy S, et al. No difference in body weight decrease between a low‐glycemic‐index and a high‐glycemic‐index diet but reduced LDL cholesterol after 10‐wk ad libitum intake of the low‐glycemic‐index diet. American Journal of Clinical Nutrition 2004;80(2):337‐47. [DOI] [PubMed] [Google Scholar]
Vinceti 1994 {published data only}
- Vinceti M, Rovesti S, Pacchinoi C, Ropa G, Roncaia R, Benedetti P, et al. Diet as a risk factor for abnormal glucose tolerance in subjects with and without family history of diabetes mellitus. Diabetes, Nutrition and Metabolism 1994;7:21‐8. [Google Scholar]
Weickert 2006 {published data only}
- Weickert MO, Mohlig M, Schofl C, Arafat AM, Otto B, Viehoff H, et al. Cereal fiber improves whole‐body insulin sensitivity in overweight and obese women. Diabetes Care 2006;29:775‐80. [DOI] [PubMed] [Google Scholar]
Wolever 2002 {published data only}
- Wolever TM, Mehling C. High‐carbohydrate‐low‐glycaemic index dietary advice improves glucose disposition index in subjects with impaired glucose tolerance. British Journal of Nutrition 2002;87(5):477‐87. [DOI] [PubMed] [Google Scholar]
Wolever 2003 {published data only}
- Wolever TM, Mehling C. Long‐term effect of varying the source or amount of dietary carbohydrate on postprandial plasma glucose, insulin, triacylglycerol, and free fatty acid concentrations in subjects with impaired glucose tolerance. American Journal of Clinical Nutrition 2003;77(3):612‐21. [DOI] [PubMed] [Google Scholar]
Additional references
ADA 1997
- American Diabetic Association. Report of the Expert Committee on the Diagnosis and Classification of Diabetes Mellitus. Diabetes Care 1997;20:1183‐97. [DOI] [PubMed] [Google Scholar]
ADA 1999
- The Expert Committee on the Diagnosis, Classification of Diabetes Mellitus. Report of The Expert Committee on the Diagnosis and Classificatioi of Diabetes Mellitus. Diabetes Care 1999;22 (Suppl 1):S5‐19. [DOI] [PubMed] [Google Scholar]
Burkitt 1975
- Burkitt D. Refined carbohydrate foods and disease: some implications of dietary fiber. London: Academic Press, 1975. [Google Scholar]
Cohen 1960
- Cohen J. A coefficient of agreement for nominal scales. Educational and Psychological Measurement 1960;20:37‐46. [Google Scholar]
Dandona 2004
- Dandona P, Aljada A, Bandyopadhyay A. Inflammation: the link between insulin resistance, obesity and diabetes. Trends Immunol 2004;25(1):4‐7. [DOI] [PubMed] [Google Scholar]
Egger 1997
- Egger M, Davey Smith G, Schneider M, Minder C. Bias in meta‐analysis detected by a simple, graphical test. BMJ 1997;315(7109):629‐34. [DOI] [PMC free article] [PubMed] [Google Scholar]
FAO 1998
- Food, Agricultural Organization of the United Nations. Carbohydrates in human nutrition: Report of a Joint FAO/WHO Expert consultation. Nutrition Paper no. 66. Rome: FAO, 1998. [PubMed] [Google Scholar]
FAO/WHO 2003
- Food and acriculture organization of the United Nations/World Health Organisation. Diet, nutrition and the prevention of chronic disease: Report of a Joint WHO/FAO Expert consultation, WHO Technical Report Series No 916. Geneva: World Health Organisation, 2003. [PubMed] [Google Scholar]
FDA 2005
- US Food, Drug Administration. Whole‐grain foods authoritative statement claim notification. Docket No.99P‐2209 2005.
FDA 2006
- US Food, Drug Administration. Whole‐grain label statements. Draft Guidelines.. www.cfsan.fda.gov/˜dms/flgragui.html 2006.
Fung 2002
- Fung TT, Hu FB, Pereira MA, Liu S, Stampfer MJ, Colditz GA, et al. Whole‐grain intake and the risk of type 2 diabetes: a prospective study in men. American Journal of Clinical Nutrition 2002;76(3):535‐40. [DOI] [PubMed] [Google Scholar]
Higgins 2003
- Higgins JP, Thompson SG, Deeks JJ, Altman DG. Measuring inconsistency in meta‐analyses. British Medical Journal 200;21:557‐60. [DOI] [PMC free article] [PubMed] [Google Scholar]
Higgins 2005
- Higgins JPT, Green S, editors. Cochrane Handbook for Systematic Reviews of Interventions 4.2.5 [updated May 2005]. In: The Cochrane Library, Issue 3, 2005. Chichester, UK: John Wiley & Sons, Ltd.
Jacobs 1998
- Jacobs DR, Jr, Meyer KA, Kushi LH, Folsom AR. Whole‐grain intake may reduce the risk of ischemic heart disease death in postmenopausal women: the Iowa Women's Health Study. American Journal of Clinical Nutrition 1998;68(2):248‐57. [DOI] [PubMed] [Google Scholar]
Jadad 1996
- Jadad AR, Moore RA, Carroll D, Jenkinson C, Reynolds DJ, Gavaghan DJ. Assessing the quality of reports of randomized clinical trials: Is blinding necessary?. Controlled Clinical Trials 1996;17:1‐12. [DOI] [PubMed] [Google Scholar]
Koh‐Banerjee 2003
- Koh‐Banerjee P, Rimm EB. Whole grain consumption and weight gain: a review of the epidemiological evidence, potential mechanisms and opportunities for future research. Proceedings of the Nutrition Society 2003;62(1):25‐9. [DOI] [PubMed] [Google Scholar]
Lau 2006
- Lau J, Ioannidis JP, Terrin N, Schmid CH, Olkin I. The case of the misleading funnel plot. British Medical Journal 2006;333:597‐600. [DOI] [PMC free article] [PubMed] [Google Scholar]
Liu 1999
- Liu S, Stampfer MJ, Hu FB, Giovannucci E, Rimm E, Manson JE, et al. Whole‐grain consumption and risk of coronary heart disease: results from the Nurses' Health Study. American Journal of Clinical Nutrition 1999;70:412‐9. [DOI] [PubMed] [Google Scholar]
Liu 2002
- Liu S. Intake of refined carbohydrates and whole grain foods in relation to risk of type 2 diabetes mellitus and coronary heart disease. Journal of the American College of Nutrition 2002;21:298‐306. [DOI] [PubMed] [Google Scholar]
Liu 2003
- Liu S. Whole‐grain foods, dietary fiber, and type 2 diabetes: searching for a kernel of truth. American Journal of Clinical Nutrition 2003;77(3):527‐9. [DOI] [PubMed] [Google Scholar]
Ludwig 2002
- Ludwig DS. The glycemic index: physiological mechanisms relating to obesity, diabetes, and cardiovascular disease. Journal of the American Medical Association 2002;287(18):2414‐23. [DOI] [PubMed] [Google Scholar]
McKeown 2002
- McKeown NM, Meigs JB, Liu S, Wilson PW, Jacques PF. Whole‐grain intake is favorably associated with metabolic risk factors for type 2 diabetes and cardiovascular disease in the Framingham Offspring Study. American Journal of Clinical Nutrition 2002;76(2):390‐8. [DOI] [PubMed] [Google Scholar]
McKeown 2004
- McKeown NM, Meigs JB, Liu S, Saltzman E, Wilson PW, Jacques PF. Carbohydrate nutrition, insulin resistance, and the prevalence of the metabolic syndrome in the Framingham Offspring Cohort. Diabetes Care 2004;27(2):538‐46. [DOI] [PubMed] [Google Scholar]
Meyer 2000
- Meyer KA, Kushi LH, Jacobs DR Jr, Slavin J, Sellers TA, Folsom AR. Carbohydrates, dietary fiber, and incident type 2 diabetes in older women. American Journal of Clinical Nutrition 2000;71(4):921‐30. [DOI] [PubMed] [Google Scholar]
Montonen 2003
- Montonen J, Knekt P, Jarvinen R, Aromaa A, Reunanen A. Whole‐grain and fiber intake and the incidence of type 2 diabetes. American Journal of Clinical Nutrition 2003;77(3):622‐9. [DOI] [PubMed] [Google Scholar]
Monzillo 2003
- Monzillo LU, Hamdy O. Evaluation of insulin sensitivity in clinical practice and in research settings. Nutrion Reviews 2003;61(12):397‐412. [DOI] [PubMed] [Google Scholar]
Murtaugh 2003
- Murtaugh MA, Jacobs DR Jr, Jacob B, Steffen LM, Marquart L. Epidemiological support for the protection of whole grains against diabetes. Proceedings of the Nutrition Society 2003;62(1):143‐9. [DOI] [PubMed] [Google Scholar]
NDDG 1979
- National Diabetes Data Group. Classification and diagnosis of diabetes mellitus and other categories of glucose intolerance. Diabetes 1979;28:1039‐57. [DOI] [PubMed] [Google Scholar]
Robertson 2004
- Robertson RP, Harmon J, Tran PO, Poitout V. Beta‐cell glucose toxicity, lipotoxicity, and chronic oxidative stress in type 2 diabetes. Diabetes 2004;53 Suppl 1:S119‐24. [DOI] [PubMed] [Google Scholar]
Schulz 1995
- Schulz KF, Chalmers I. Hayes RJ, Altman DG. Empirical evidence of bias. Dimensions of methodological quality associated with estimates of treatment effects in controlled trials. JAMA: the journal of the American Medical Association 1995;273:408‐12. [DOI] [PubMed] [Google Scholar]
Sjoholm 2005
- Sjoholm A, Nystrom T. Endothelial inflammation in insulin resistance. Lancet 2005;365(9459):610‐2. [DOI] [PubMed] [Google Scholar]
Slavin 2003
- Slavin J. Why whole grains are protective: biological mechanisms. Proceedings of the Nutrition Society 2003;62(1):129‐34. [DOI] [PubMed] [Google Scholar]
Steffen 2003
- Steffen LM, Jacobs DR Jr, Murtaugh MA, Moran A, Steinberger J, Hong CP, et al. Whole grain intake is associated with lower body mass and greater insulin sensitivity among adolescents. American Journal of Epidemiology 2003;158(3):243‐50. [DOI] [PubMed] [Google Scholar]
Trowell 1975
- Trowell H. Dietary‐fiber hypothesis of the aetiology of diabetes mellitus. Diabetes 1975;24:762‐5. [DOI] [PubMed] [Google Scholar]
Unwin 2002
- Unwin N, Shaw J, Zimmet P, Alberti KG. Impaired glucose tolerance and impaired fasting glycaemia: the current status on definition and intervention. Diabetic Medicine 2002;19(9):708‐23. [DOI] [PubMed] [Google Scholar]
WHO 1980
- WHO Expert Committee on Diabetes Mellitus. Second report. Technical Report Series 646. Geneva: World Health Organisation, 1980. [PubMed] [Google Scholar]
WHO 1985
- World Health Organisation. Diabetes Mellitus: Report of a WHO Study Group. Diabetes Mellitus: Report of a WHO Study Group. Technical Report Series No 727. Geneva: World Health Organisation, 1985. [PubMed] [Google Scholar]
WHO 1999
- World Health Organization. Definition, Diagnosis and Classification of Diabetes Mellitus and its Complications. Report of a WHO Consultation. Part 1 : Diagnosis and Classification of Diabetes Mellitus. Geneva: World Health Organisation, 1999. [Google Scholar]
Willett 2002
- Willett W, Manson J, Liu S. Glycemic index, glycemic load, and risk of type 2 diabetes. American Journal of Clinical Nutrition 2002;76(1):274S‐80S. [DOI] [PubMed] [Google Scholar]