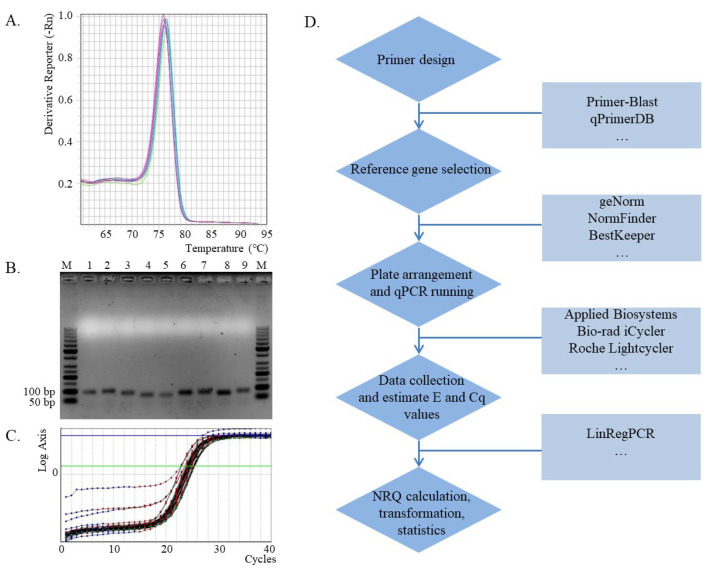
Figure 1.
qPCR analysis and the workflow. (A). Melt curve for PCR products amplified from specific primers (GAPDH2) [6]. (B). Agarose gel electrophoresis detection of PCR products for the specificity of primers, M: DNA ladder; 1: UBE2; 2: EF2; 3: β-TUB6; 4: snoR14; 5: snoR23; 6: ADP; 7: GAPDH1; 8: GAPDH2; 9: ACT [6,10]. (C). Amplification efficiency and Cq calculation by LinRegPCR software (Rn data input for GAPDH2). (D). The workflow for qPCR analysis.

