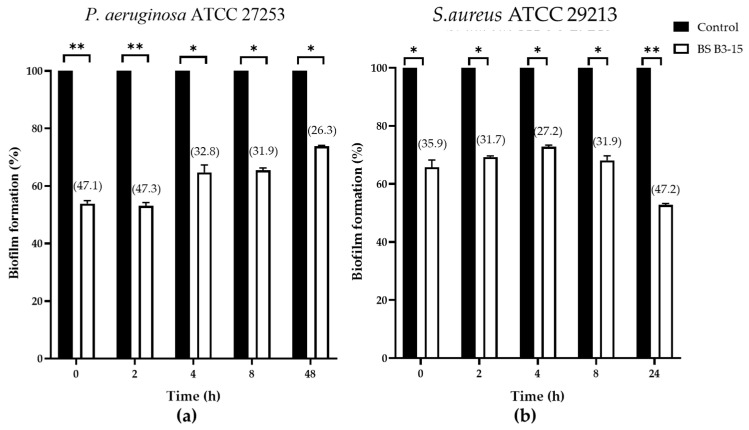
Figure 7.
Pseudomonas aeruginosa ATCC 27853 (a) and Staphylococcus aureus ATCC 29213 (b) biofilm formation (%) on polystyrene microplate without (Control) or after the addition of the BS B3-15 (300 μg/mL) at different bacterial growth times (T0, T2, T4, T8) and after T48 for P. aeruginosa and T24 for S. aureus, when the biofilms were completely established. The bars represent mean ± SD for six replicates (n = 6) * p ≤ 0.05 and ** p ≤ 0.01 show significant differences compared with untreated controls. Data on biofilm reduction (%) are reported in brackets.

