Abstract
Background:
The subthalamic nucleus (STN) is an effective deep brain stimulation target for Parkinson disease (PD) and obsessive-compulsive disorder and has been implicated in reward and motivational processing. In this study, we assessed the STN and pre-frontal oscillatory dynamics in the anticipation and receipt of reward and loss using a task commonly used in imaging.
Materials and Methods:
We recorded intracranial left subthalamic local field potentials from deep brain stimulation electrodes and prefrontal scalp electroencephalography in 17 patients with PD while they performed a monetary incentive delay task.
Results:
During the expectation phase, enhanced left STN delta-theta activity was observed in both reward and loss vs neutral anticipation, with greater STN delta-theta activity associated with greater motivation specifically to reward. In the consummatory outcome phase, greater left STN delta activity was associated with a rewarding vs neutral outcome, particularly with more ventral contacts along with greater delta-theta coherence with the prefrontal cortex. We highlight a differential activity in the left STN to loss vs reward anticipation, demonstrating a distinct STN high gamma activity. Patients with addiction-like behaviors show lower left STN delta-theta activity to loss vs neutral outcomes, emphasizing impaired sensitivity to negative outcomes.
Conclusions:
Together, our findings highlight a role for the left STN in reward and loss processing and a potential role in addictive behaviors. These findings emphasize the cognitive-limbic function of the STN and its role as a physiologic target for neuropsychiatric disorders.
Keywords: Addiction, loss, Parkinson disease, reward, subthalamic nucleus
INTRODUCTION
Rodent and human studies suggest a role for the subthalamic nucleus (STN) in reward expectation, delivery, and reward magnitude.1,2 STN lesions and STN deep brain stimulation (DBS) shift choice preference and motivational value from cocaine to food rewards, and this suggests a role for STN DBS in the management of addictive behaviors.3,4 In the human STN, low-frequency oscillations are related to subjective reward and effort cues.5 Much less is understood of the role of the STN in loss-related behaviors. In this study, we sought to assess the role of the STN in processing anticipation of reward and loss by measuring the local field potential (LFP) activity in the STN and electroencephalography (EEG) in patients with Parkinson disease (PD) who have undergone STN DBS.
PD is a neurodegenerative disorder with high comorbidity with neuropsychiatric symptoms, including addictive behaviors related to dopaminergic medications.6 DBS is a neurosurgical procedure involving the delivery of high-frequency stimulation to deep structures to normalize pathological oscillatory activity. The STN is located within the indirect pathway of frontostriatal circuitry and receives prominent hyperdirect projections from prefrontal cortical regions, thus acting as a nexus of integration for motor, associative, and limbic subregions.7 Targeting the posterior motor STN is effective for PD,8 and targeting the anterior limbic-cognitive STN is effective for obsessive-compulsive disorder (OCD).9,10
Targeting specific oscillatory substrates underlying behavioral processes may modulate specific behaviors. A rodent binge-eating model has recently shown the efficacy of responsive stimulation of the nucleus accumbens (NAc) targeting delta frequency.11 The delta activity observed two seconds before approaching food reward increased with binge eating, and critically with responsive high-frequency stimulation, rodents decreased binge-eating behaviors. In the parallel human OCD study, one patient tested using the monetary incentive delay (MID) task showed enhanced delta activity in the NAc during the anticipatory phase of the highest reward.11 Identifying oscillatory dynamics such as delta activity associated with either the anticipatory or outcome phase of reward and loss processing in the STN and exploring their relationship with addictive behaviors might provide more detailed physiologic target bio-markers for neuromodulation in patients with PD.12
In this study, we aimed to assess the role of subthalamic-prefrontal oscillatory and connectivity dynamics in reward and loss processing using the same MID task used in the parallel OCD NAc human imaging study11 in patients with PD who have undergone STN DBS. The MID task has been extensively validated in functional magnetic resonance imaging (MRI) studies and allows for a dissociation between anticipation and consummation or the outcome phase.13
MATERIALS AND METHODS
Recruitment and Criteria
The participants were inpatients with PD who had undergone STN DBS surgery at RuiJin Hospital, Shanghai Jiao Tong University School of Medicine (inclusion criteria in Supplementary Data). The ethics committee of RuiJin Hospital, Shanghai Jiao Tong University School of Medicine, approved all procedures used in this study (ethics approval number: 2019[220]). All patients provided written informed consent in accordance with the Declaration of Helsinki.
Clinical Evaluation
Experienced neurologists performed the clinical evaluations. Before surgery, Unified Parkinson Disease Rating Scale (UPDRS)-III motor function was assessed after an overnight withdrawal of medication and one hour after a suprathreshold dose of levodopa (L-dopa). Participants were tested using the Montreal Cognitive Assessment (MoCA) test and Beck Depression Inventory (BDI)-II. The severity of impulse control problems was screened using the Questionnaire for Impulsive-Compulsive Disorders in Parkinson’s Disease (QUIP).14,15
MID Task
In the MID task (Fig. 1),16 patients saw one of three cues that signaled the trial type and potential outcomes. On reward trials, correct responses were followed by a 10-yuan win and incorrect or missed responses by a gray box. On loss trials, incorrect or missed responses were followed by a 10-yuan loss and correct responses by a gray box. On neutral trials, patients were shown a gray box. The 500-millisecond cue was followed by the 2000-millisecond anticipation phase, during which the colored square remained on the screen without the icon as a reminder of the type of outcome. The anticipation phase was fixed in duration to allow for optimal analysis of oscillatory dynamics. A white arrow then appeared. Using a two-button response box, patients pressed a button with their left or right thumb as quickly as possible in the direction of the arrow. The response duration allowed was staircased, starting at 800 milliseconds and increasing or decreasing by 50 milliseconds, depending on the correctness of the previous response, with a maximum time of 1000 milliseconds. This staircase procedure results in half of the trials being correct and half incorrect, which is necessary to generate the reward and loss trials, respectively. After the response, a blank screen of at least 500 milliseconds allowed the motor rebound to dissipate before the 2000-millisecond outcome. The total response phase (from arrow onset to the end of the blank screen) was 1500 milliseconds. The intertrial interval was 1500 to 2000 seconds. There were 30 trials per condition, although two patients in the EEG analysis had 40 trials. Patients were told that they needed to respond as quickly as possible to either win or avoid losing money. They completed 18 practice trials.
Figure 1.
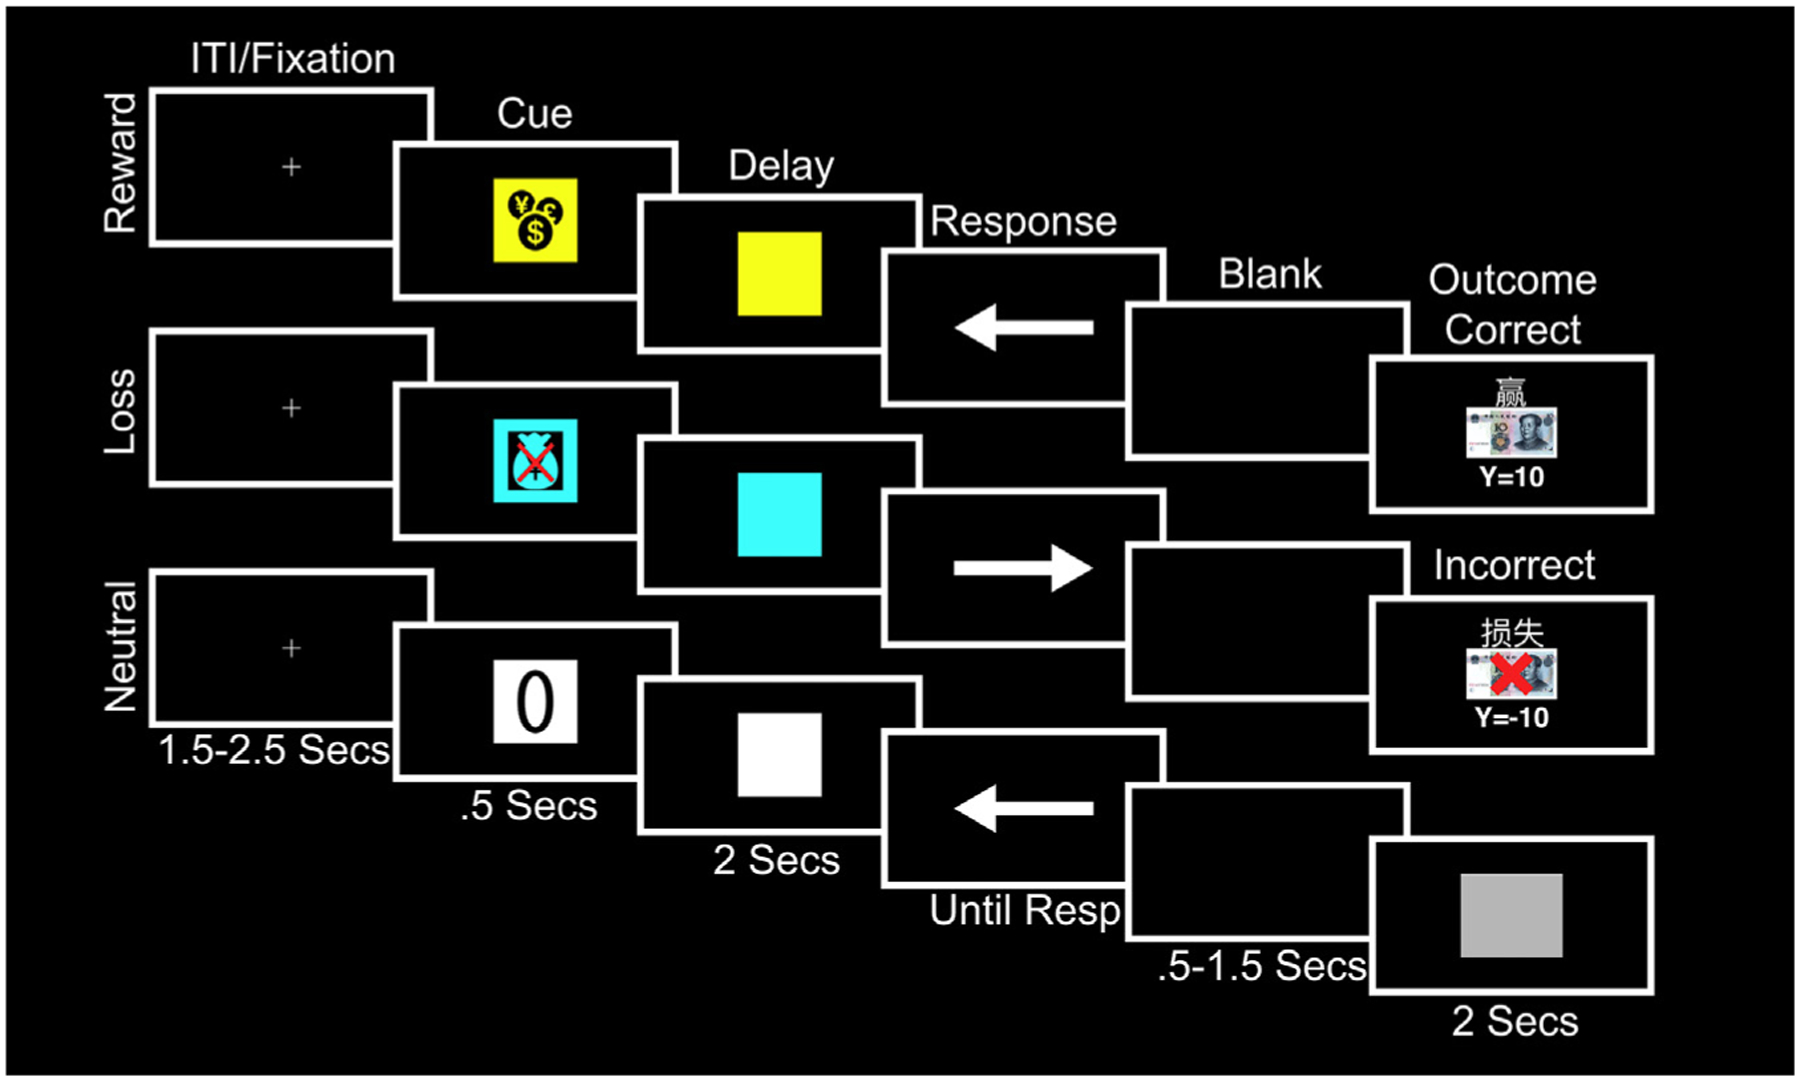
MID task. A cue (500 milliseconds) symbolized the potential outcome depending on the correctness and speed of response to an upcoming target. A yellow square with a money icon signaled that money could be won (reward trials), a blue square with a crossed-out money bag signaled that money could be lost (loss trials), and a white square with a zero overlaid signaled that no money would be won or lost (neutral trials). This was followed by a 2000-millisecond delay/anticipation phase and a target during which patients pressed a button corresponding to the direction of an arrow cue as fast as possible. On reward trials, if patients were correct and fast, they saw “you win” above a 10-yuan note and the total cumulative winnings. On loss trials, if patients were incorrect or too slow, they saw “you lose” above a 10-yuan note with a red cross overlaid and the total cumulative losses. For all other types of responses and on neutral trials, patients did not win or lose anything and instead saw a gray square. The outcome lasted for a duration of 2000 milliseconds. The maximum allowable response time was 1000 milliseconds. There was a blank screen between the response and until 1500 milliseconds had elapsed before the outcome to minimize motor rebound effects. ITI, intertrial interval; Resp, response.
This task was followed by another MID task that compared two MID reward conditions, one of which was preceded by high-frequency 130-Hz stimulation of the right electrode in a bipolar configuration (R1− R2+) occurring one second before the cue, lasting 0.5 seconds. Because there were no differences in either reaction time (RT) or LFP activity between these conditions, we focus on the results of the task above without stimulation.
Surgical and Experimental Procedure
Patients underwent DBS implantation surgery in two stages. The intended target coordinates were determined by merging the computed tomography (CT) and 3.0T MRI images using the Surgiplan software (Elekta, Stockholm, Sweden). Quadripolar electrodes with four platinum-iridium contacts (Medtronic 3387, Medtronic, Minneapolis, MN; or PINS L302, PINS, Beijing, China) were stereo-tactically implanted into bilateral STN under general anesthesia. In the first-stage surgery, DBS leads were externalized, which enabled recordings before the subcutaneous pulse generator was implanted in the second-stage surgery. To confirm STN targeting, the merged CT and MRI images were inspected separately by two experienced neurosurgeons using Surgiplan. Patients were not tested within the first 24 hours after the surgery to avoid the stun effect. Patients were tested on medication at least 30 minutes after their regular medication dose. Impedance was below 10 kΩ. Electrooculograms were recorded from three electrodes above, below, and beside the right eye.
LFP and EEG Recording and Preprocessing
The LFP and EEG data were recorded using a BrainAmp MR amplifier (Brain Products, Gilching, Germany) with a 500-Hz sample rate and a notch filter set at 50 Hz to remove power line noise interference. The left mastoid was used as the reference electrode. The EEG was recorded from seven frontal electrodes (Fp1, Fp2, F3, F4, F7, F8, and Fz) according to the 10–20 placement system. Because we used the middle two contacts on the right electrode for stimulation in the stimulation task and were unable to both stimulate and record from the same contacts, we focus our analyses here on the left STN contacts. The left LFP DBS contacts were rereferenced using a bipolar montage (L0–L1, L1–L2, and L2–L3) to cancel out volume conduction from outside the STN. Because beta is the dominant frequency of the STN, we compared it across the three bipolar LFP channels using a fast Fourier transform and as standard practice for LFP analyses in the STN and selected the channel with the largest beta power that indicates the bipolar channels most likely to be located with the STN.17,18 Channel L1–L2 was the peak for eight patients, L0–L1 for three patients, and L2–L3 for three patients. We report the peak beta analysis in the main text and results of the three bipolar montages in the Supplementary Data (Supplementary Data Figs. S1–S4 and Table S3). An example of the electrode and contact trajectory through the left STN in an individual patient is shown in Supplementary Data Figure S5, visualized using LEAD-DBS.
The data were filtered using a 1-Hz high-pass Butterworth filter to remove DC bias. An independent component analysis was run on the EEG recordings to remove blinks and lateral eye movements. The data were normalized using z-score to facilitate comparison at the group level. Each trial was epoched by time-locking activity to the onset of the cues and the outcomes.
Time-Frequency Decomposition
Time-frequency decomposition was performed using the multi-taper convolution method implemented in Fieldtrip (Donders Institute for Brain, Cognition and Behaviour, Radboud University, the Netherlands).19 Low-frequency activity was analyzed separately from high gamma activity. For each trial, the data were windowed using a sliding time window centered at 20-millisecond increments and tapered to reduce spectral leakage before calculating the power. For low frequencies between 2 and 32 Hz, a single Hanning taper was used, and the time window was seven cycles in duration. The frequency axis was octave/log-scaled to represent each frequency band in equal proportion.20 The time-frequency representations were then averaged across conditions. Each patient’s average was baseline corrected by calculating the percentage signal change from −1000 to −500 milliseconds before the onset of the cue during the fixation period ([Active − Baseline] / Baseline × 100). This baseline window was chosen because the low frequencies are estimated using a window that overlaps the baseline phase, and this ensured that any effects at the beginning of the trial are not cancelled out by baseline correction. This analysis allowed us to test for changes in delta (2–4 Hz), theta (4–8 Hz), alpha (8–12 Hz), and beta (12–30 Hz). We also tested for differences in the gamma (30–200 Hz) range but did not find any significant effects. The number of trials in each average was equalized across conditions, and all trials with RTs below 250 milliseconds were excluded.
We analyzed the cue/anticipation (−500 milliseconds before cue onset until anticipation end 2500 milliseconds later) and outcome (−500 milliseconds before outcome until offset 2000 milliseconds later) separately. We included the 500 milliseconds before to show whether the activity is strictly time-locked to outcome onset.
EEG Analyses
For the EEG and EEG connectivity analyses, we analyzed the average of all seven electrodes and the differences between hemispheres using the average activity on the left (FP1, F3, and F7) and right (FP2, F4, and F8) electrodes and by subtracting the average activity on the right electrodes from the left electrodes (left – right).
Coherence Analysis
Coherence measures consistency in the phase and the amplitude of two signals at the same frequency. Our preprocessing pipeline ensured that the data were conditioned in a way that was amenable to accurate coherence analysis.21 In particular, the bipolar rereferencing scheme ensured that the LFP and EEG data did not share a common reference and volume conduction, both of which can introduce activity patterns that cause spurious correlations between channels. The number of trials in each condition was also equalized because coherence analysis is sensitive to sample-size bias. The coherence analysis was averaged across all EEG electrodes that showed similar patterns of modulation.
Cross-Frequency Coupling
We used the envelope-signal-correlation method in the phase-amplitude coupling (PAC) toolbox (MATLAB; Natick, MA) to test for time-varying cross-frequency interactions.22 We tested for PAC using each of the frequency bands (except gamma) as the modulating, phase frequency, and all frequencies above that band as the amplitude or modulated frequency. For modulated frequencies up to 100 Hz, we used a 500-millisecond duration time window centered every 20 milliseconds. For frequencies between 101 and 250 Hz, we used a 250-millisecond time window. PAC was calculated within the LFP channel as well as between the LFP and EEG. The effects were tested using the LFP as the modulating channel and EEG as the modulated channel, and vice versa.
Statistical Analyses
Behavioral measures of RT and percentage of correct, incorrect, and missed trials were tested using the analysis of variance. The LFP and EEG data were statistically analyzed at the group level using Statistical Parametric Mapping (SPM)-12 (Wellcome Department of Imaging Neuroscience, Institute of Neurology, London, UK), which affords greater sensitivity to detect significant effects than nonparametric methods.23 To meet the requirement for SPM analysis that the data approximate a multivariate Gaussian distribution, the time-frequency images were smoothed with a Gaussian kernel that had a full width at half maximum of 25 log frequency units and 300 milliseconds.24 The size of this smoothing kernel was chosen on the basis of the matched filter theorem (ie, that the size of the smoothing kernel should approximate the size of the expected effects). We used 25 log frequency units because this was approximately the same width of the canonical frequency bands and 300-millisecond time units because these are similar to those previously used,25 and there is already some degree of smoothness present in the images. The time-frequency matrices were converted into Neuroimaging Informatics Technology Initiative images and entered into a second-level flexible factorial design for comparison with paired t-tests. We used a cluster-forming threshold of p = 0.05 but only considered cluster significant if the false discovery rate–corrected cluster-level significance exceeded a Bonferroni correction determined by the number of contrasts tested. Here, we used a very stringent Bonferroni correction for all contrasts, task phase, and analysis type (power, coherence), correcting for 30 comparisons (p < 0.0017 considered significant). For the analyses of contrasts involving three bipolar montages, which are separately reported in the Supplementary Data and intended for comparison purposes, we additionally corrected for the three additional montage analyses, correcting for 90 comparisons (p < 0.0005 considered significant).
We tested for clusters of activity significantly associated with clinical/behavioral measures using regression analysis in SPM. The covariate was mean centered, and the model included an intercept.
RESULTS
Demographics and Clinical Features of Patients
A total of 17 patients with PD (six women, mean age 62 ± 9 years, all right-handed; 14 in the LFP analysis; 15 in the EEG analysis; 12 patients had both LFP and EEG) participated in the study. The differing number of patients in the analyses was because of the artifacts present only in the EEG or in the LFP. The mean disease duration was 9 ± 3 years. The daily dosage of l-dopa equivalent was 803 ± 387 mg (l-dopa only, n = 9; l-dopa and dopamine agonist, n = 8) (average dopamine agonist [Levodopa equivalent daily dose] 42 ± 50 mg). The mean UPDRS-III score was 27 ± 11 in the on-medication state and 46 ± 10 in the off-medication state, and the mean BDI-II score was 13 ± 11. The mean MoCA score was 24 ± 3. All patients were screened using the QUIP (9/17 for any impulse control disorders, 2/17 for hypersexuality, 3/17 for compulsive buying, 3/17 for binge eating, 5/17 for over medication, 0/17 for punding, and 0/17 for gambling).
Reaction Times
RT was compared in all 17 patients. Trials in which patients were incorrect, did not respond, or were faster than 250 milliseconds were removed from the analysis. There were no significant differences between conditions in RT or number of correct, incorrect, or missed trials (all ps > 0.05; Supplementary Data Table S1).
LFP During Cue/Anticipation Phase
The following reports the peak beta analyses (details and statistics in Supplementary Data Table S2), highlighting similarities with the analyses of the three bipolar montages reported in the Supplementary Data (Supplementary Data Figs. S1–S3, statistics in Supplementary Data Table S3) in which only L1–L2 was significant after correction.
For the cue/anticipation phase, we included all trials irrespective of response. Compared with neutral, both reward anticipation and loss anticipation were characterized by increased delta-band left STN LFP activity (Fig. 2). Loss anticipation also showed increased gamma power compared with neutral. Thus, similarities in the delta band were observed across both conditions, but loss anticipation was dissociable from reward anticipation, particularly in the gamma band. The same findings were observed in L1–L2 (Supplementary Data Fig. S1).
Figure 2.
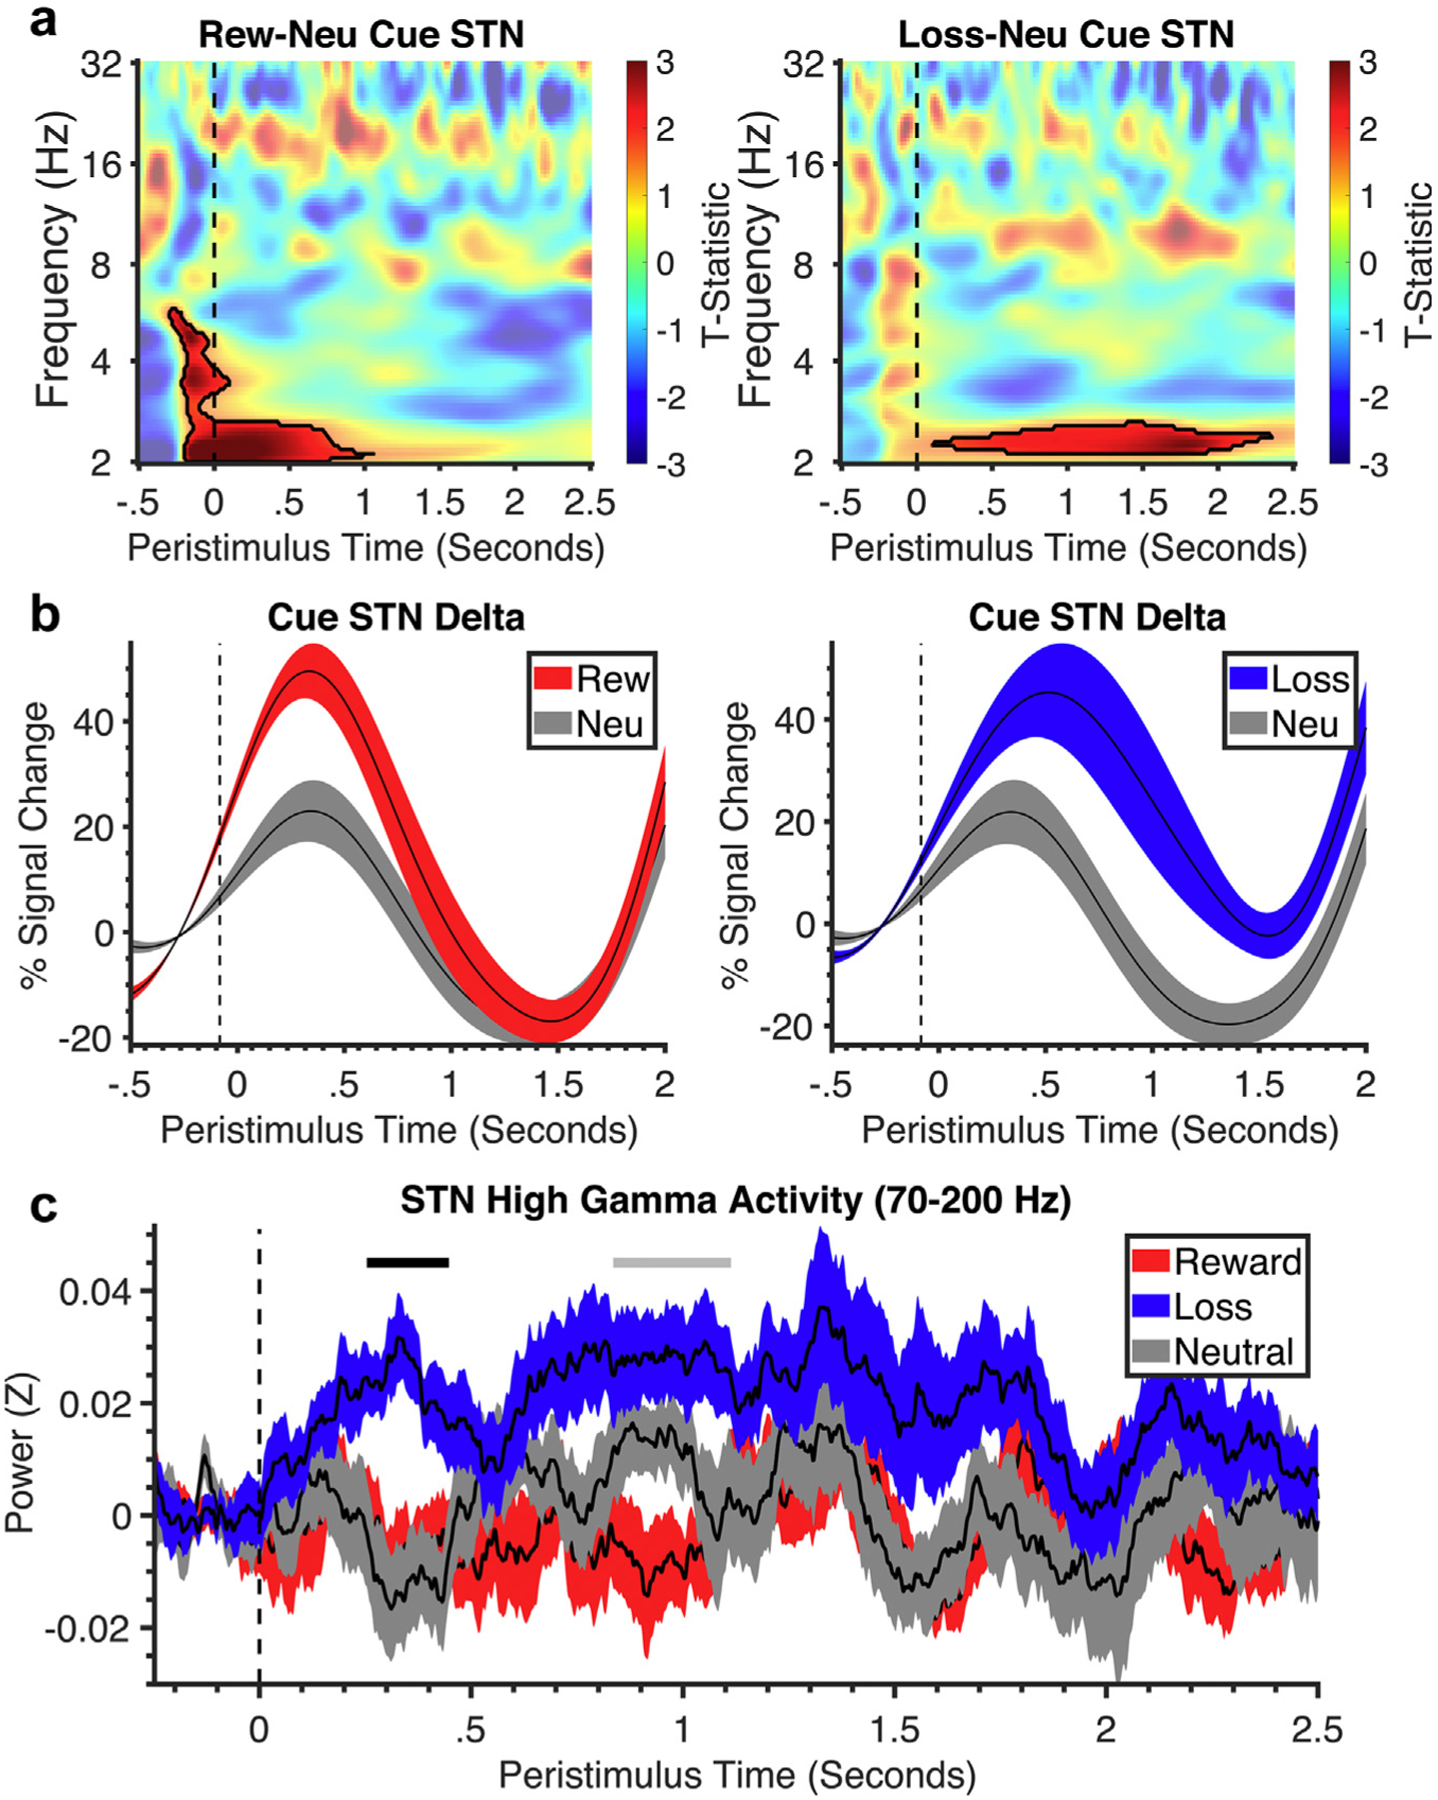
Time-frequency analysis of the cue and anticipation phase. a. Stimulus-locked time-frequency plots of the STN during reward vs neutral contrast and loss vs neutral contrast of cue-anticipation phase (cue onset at dotted line). Black lines symbolize clusters that were significantly different between valence and neutral. All clusters had a false discovery rate cluster size significance of p < 0.002. b. Corresponding line plots of % signal change and standard error in STN delta frequency over time for the cue-anticipation phase from the significant cluster identified in the time-frequency plot for reward, loss, and neutral conditions. c. The line plot shows the % signal change and standard error in STN gamma frequency over time for reward, loss, and neutral conditions. Neu, neutral; Rew, reward.
The EEG findings showed a theta-delta power decrease in loss vs neutral outcomes that likely represented a rebound effect from an initial nonsignificant rise in theta-delta power. There was no significant prefrontal-left STN connectivity or PAC.
LFP and EEG During Outcome Phase
Correct reward outcomes were compared with correct neutral outcomes, and incorrect loss outcomes were compared with incorrect neutral outcomes. Reward relative to neutral outcomes showed significantly increased left STN delta power throughout the outcome phase (Fig. 3), which was similarly observed across both analyses (Supplementary Data Fig. S2). Differences were observed in loss vs neutral outcomes with lower beta power in the peak beta analyses, but there were no differences observed in loss vs neutral outcomes in the L1–L2 analyses.
Figure 3.
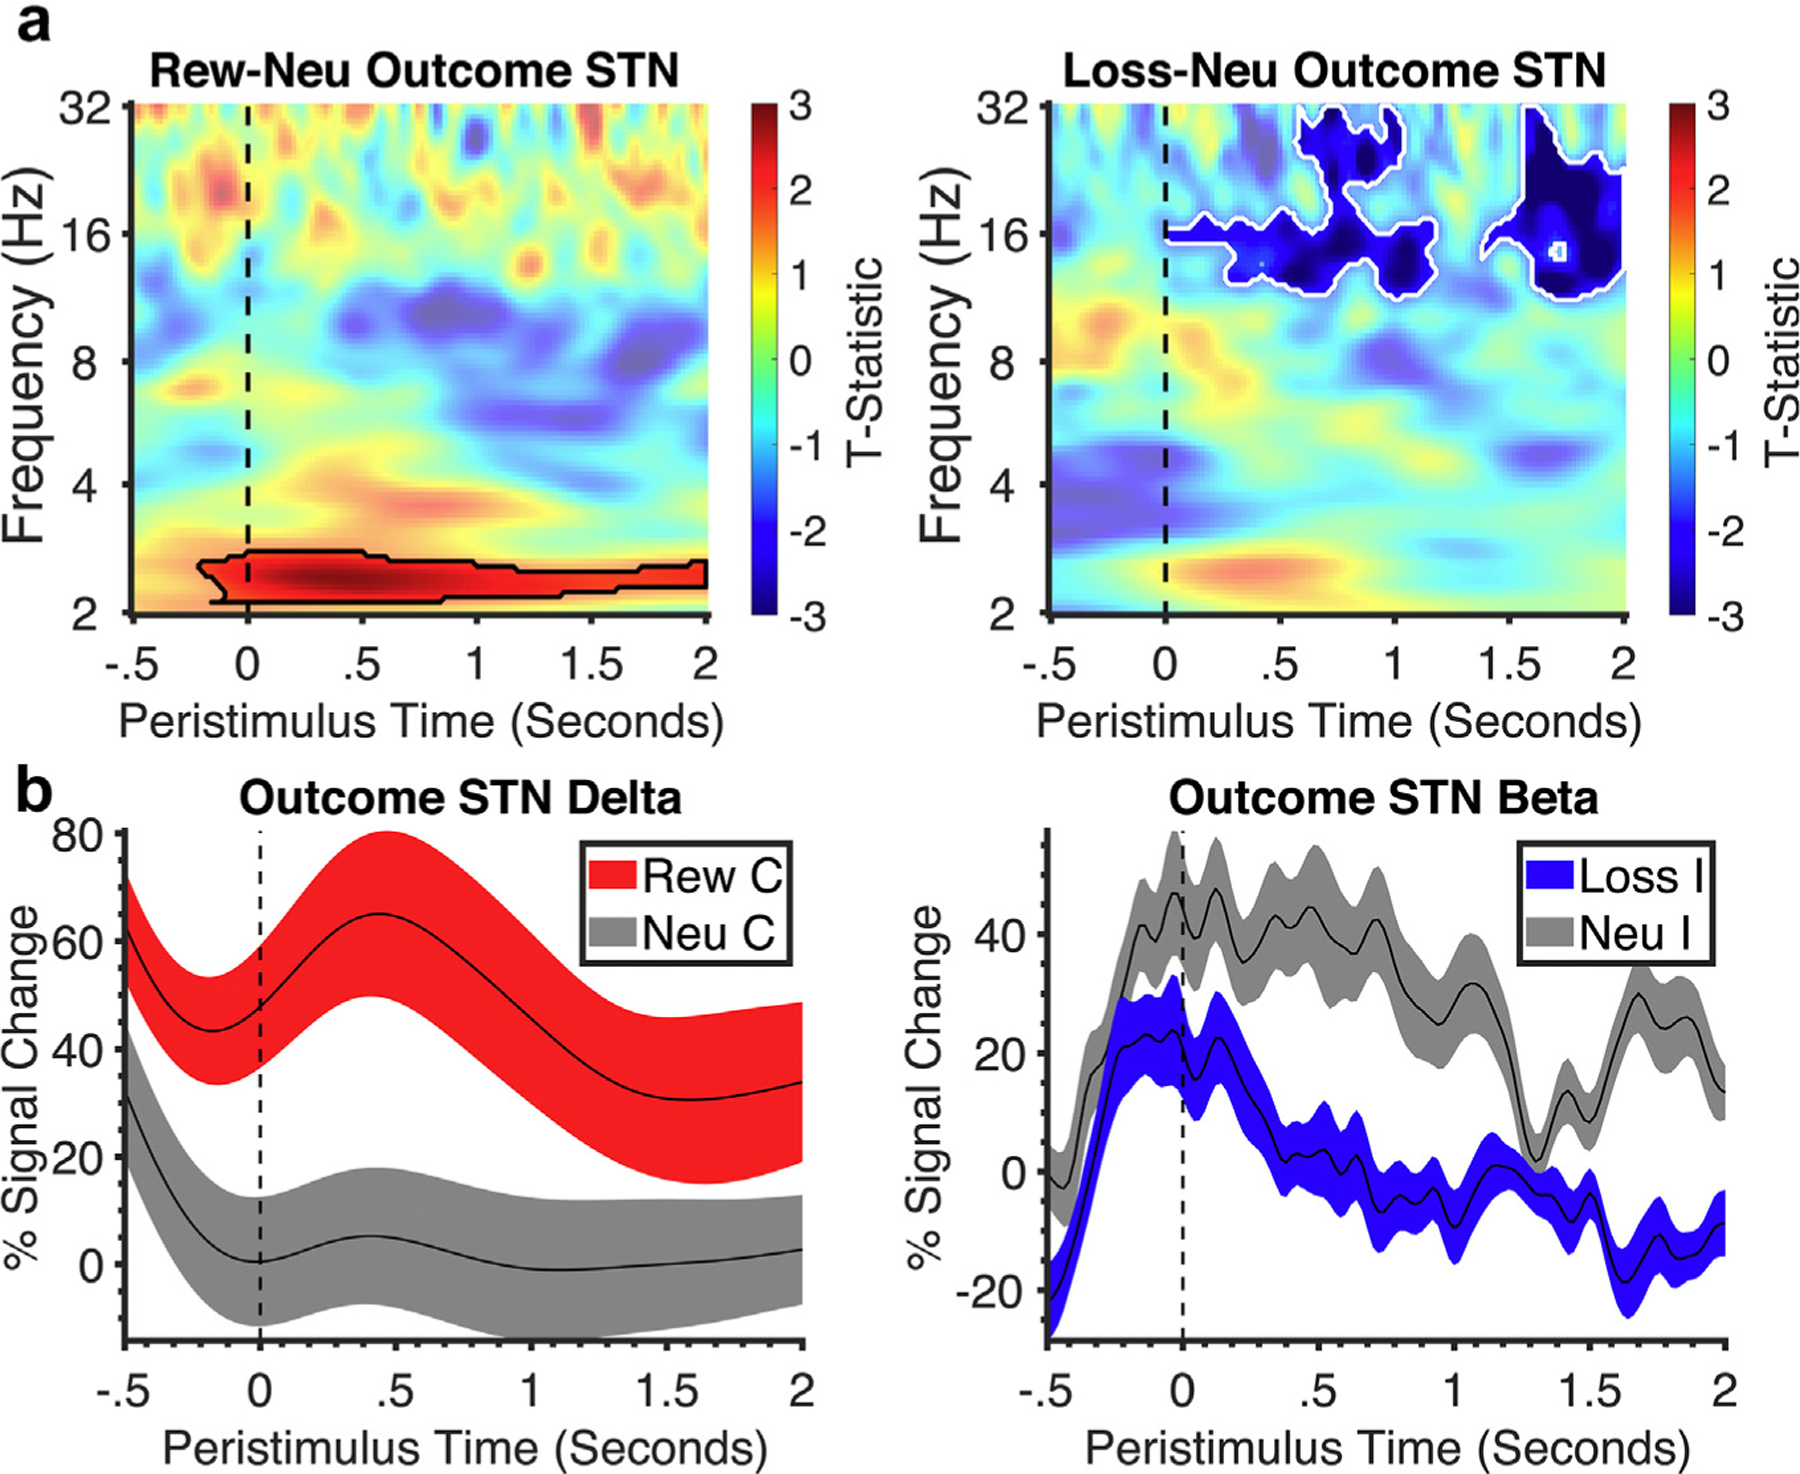
Subthalamic time-frequency analysis of the outcome phase. a. Stimulus-locked time-frequency plots of outcome phase (outcome onset at dotted line) of the STN for reward vs neutral and loss vs neutral with black lines representing significant clusters of difference of valence vs neutral and white lines representing difference between valence. All clusters had a false discovery rate cluster size significance of p < 0.002. b. Corresponding line plots below represent % signal change and standard error from the significant clusters identified in the time-frequency plot. C, correct; I, incorrect; Neu, neutral; Rew, reward.
Similar findings were observed in the EEG, with greater delta-theta activity to reward than to neutral outcomes at approximately the same time as the LFP (Fig. 4), with no differences observed in loss vs neutral outcomes.
Figure 4.
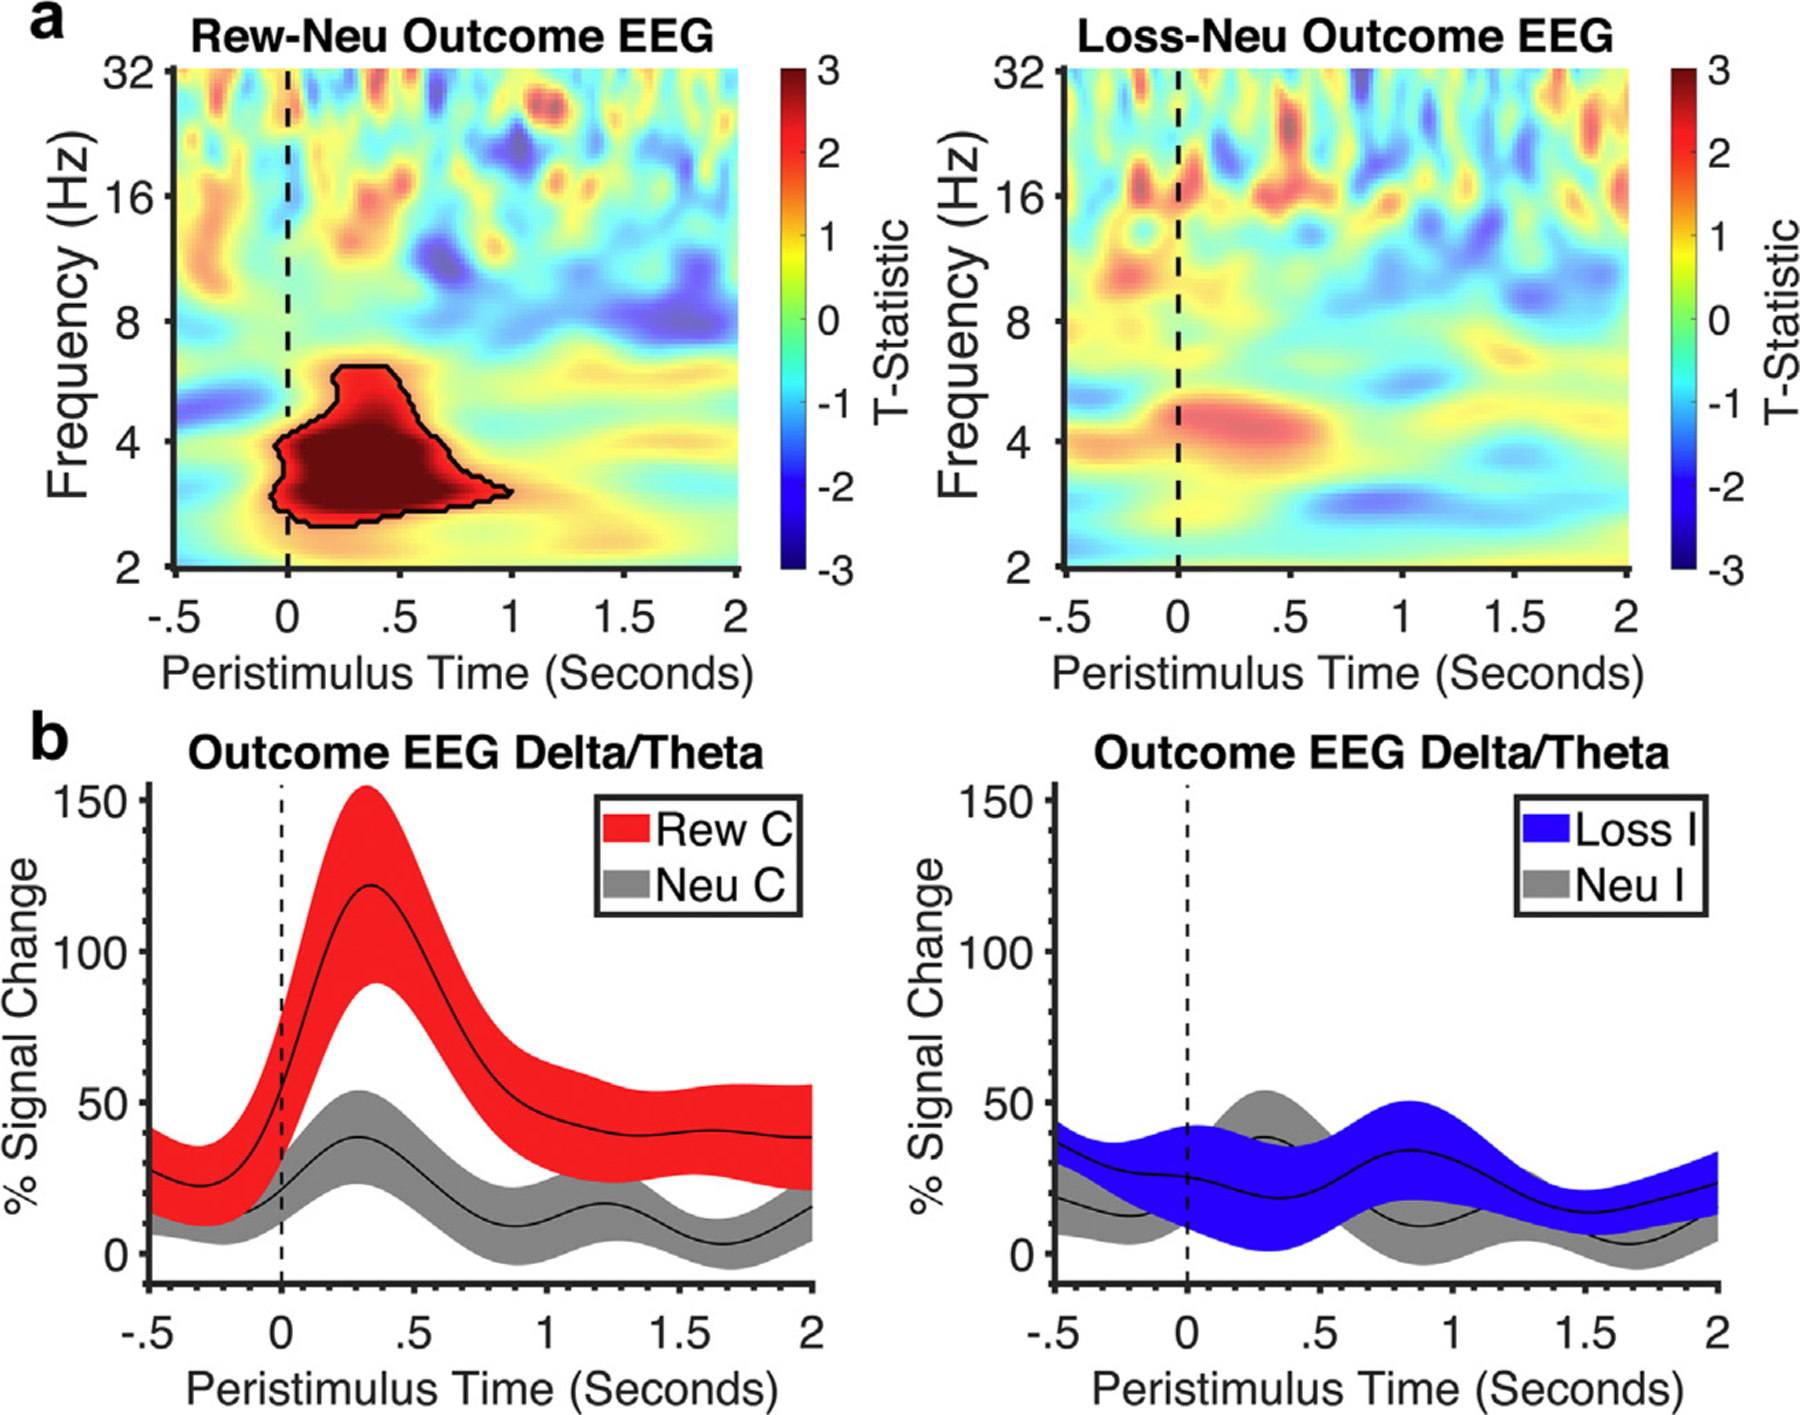
Frontal EEG time-frequency analysis of the outcome phase. a. Stimulus-locked time-frequency plot of frontal EEG activity in the outcome phase (outcome onset at dotted line). Black outlines symbolize clusters in reward outcomes that were significantly larger than neutral. All clusters had a false discovery rate cluster size significance of p < 0.002. b. Corresponding line plots below represent % signal change and standard error from the significant cluster identified in the time-frequency plot: delta-theta frequency for reward and neutral and for loss and neutral. C, correct; I, incorrect; Neu, neutral; Rew, reward.
Functional Connectivity—Coherence and Coupling
The delta/theta power changes seen in the left STN and EEG to reward vs neutral outcomes also showed increased coherence with prefrontal cortex in both analyses (Fig. 5 and Supplementary Data Fig. S3). A decreased delta-theta coherence was observed in loss vs neutral outcomes in the peak beta analysis, but this was not seen in the L1–L2 analysis. Similarly, across both analyses, greater left STN theta and left STN beta coupling was observed in reward vs neutral outcomes (Fig. 5 and Supplementary Data Fig. S3).
Figure 5.
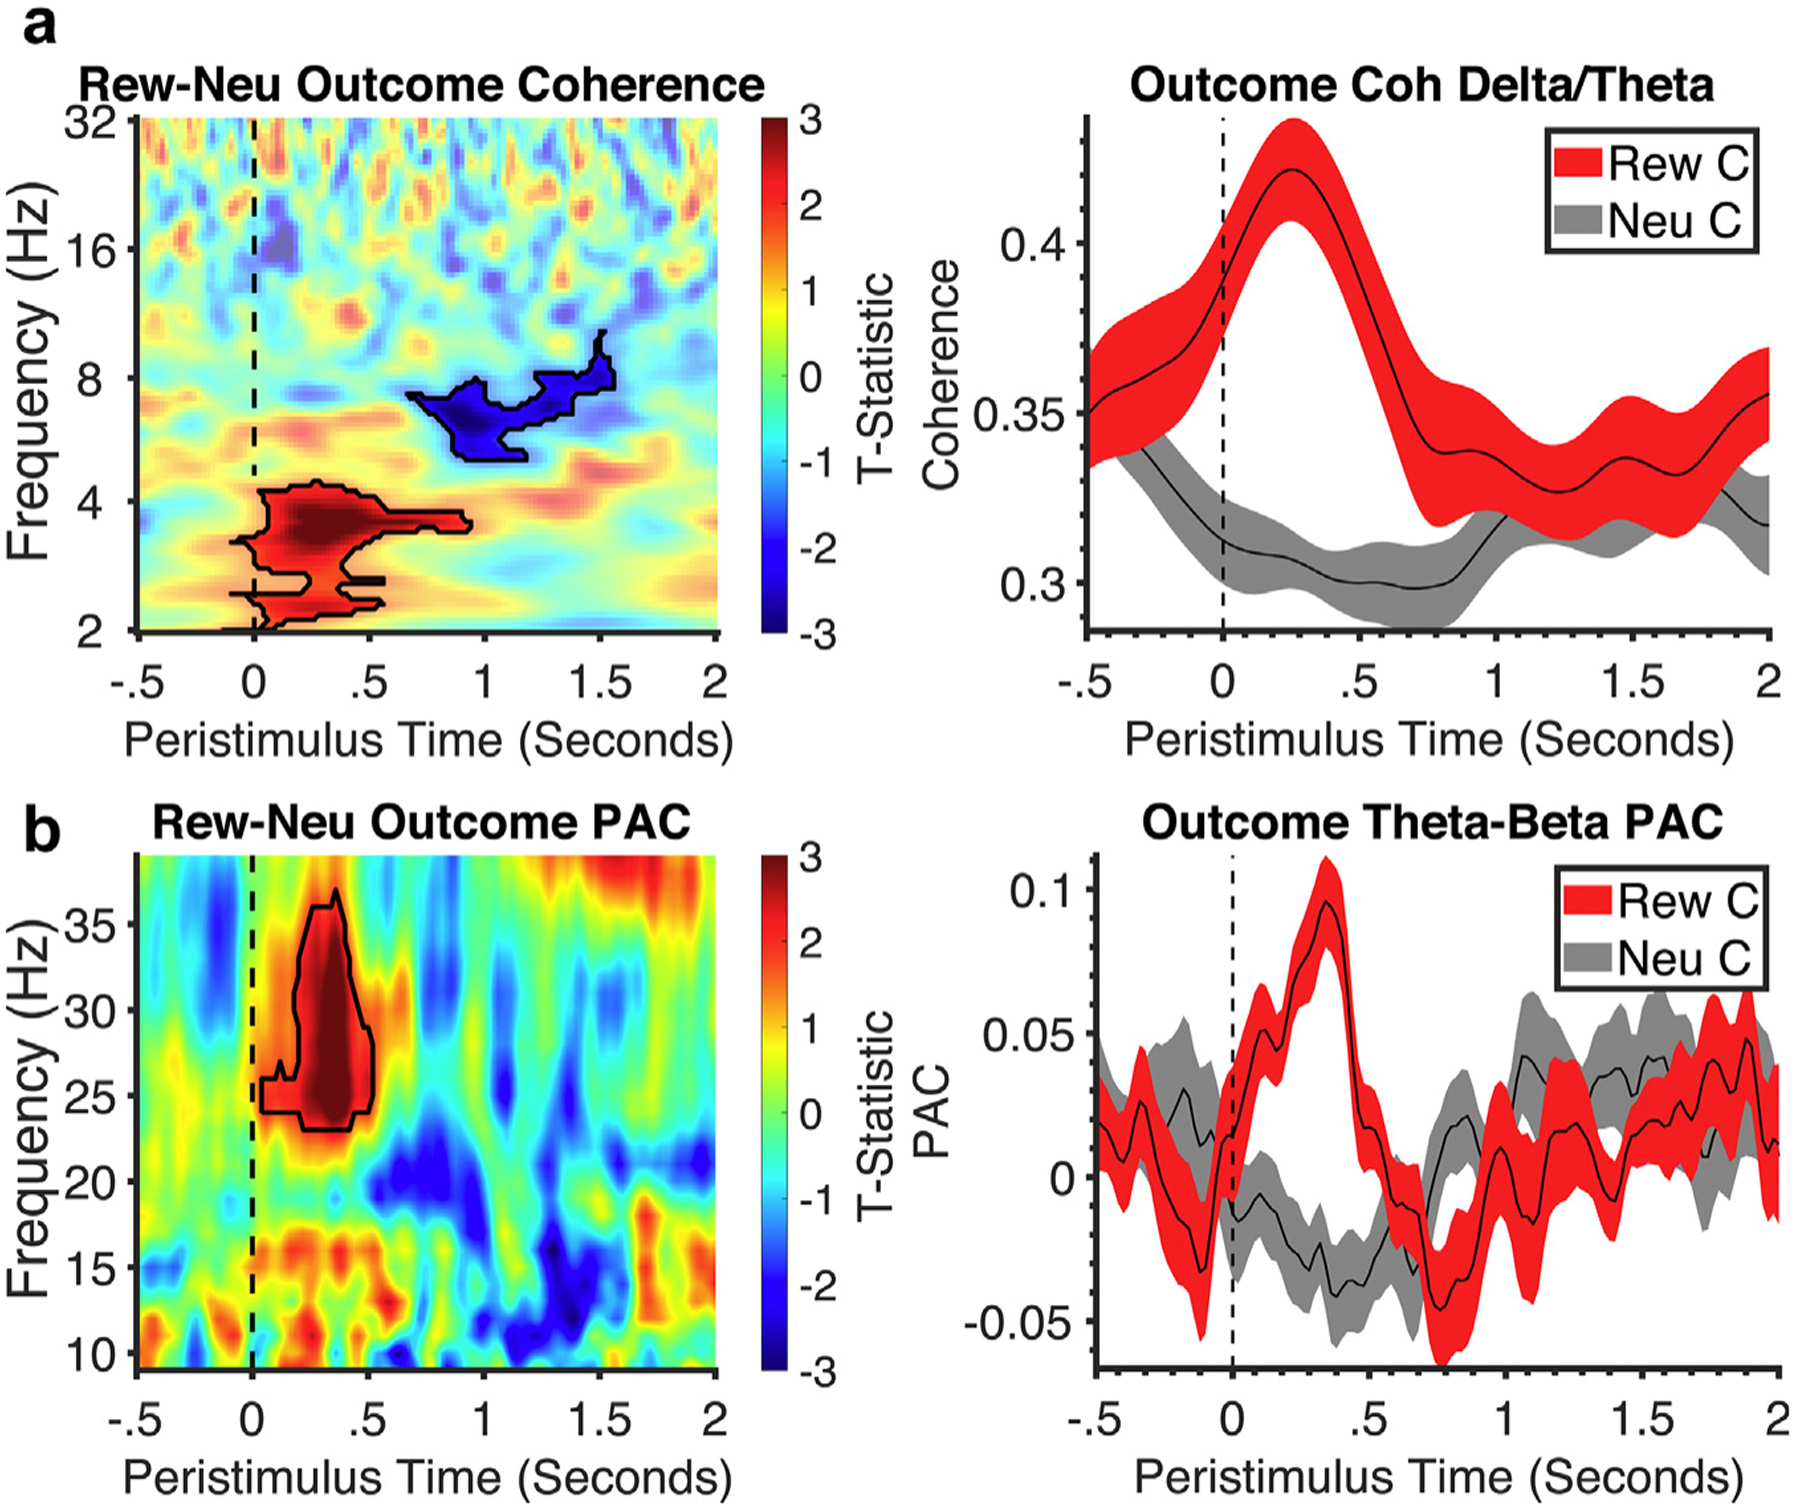
Time-frequency coherence analysis of outcome. a. Time-frequency analysis of prefrontal EEG and subthalamic (STN) coherence for reward vs neutral with no significant findings in loss vs neutral. Black outlines symbolize clusters in reward outcomes that were significantly larger than neutral. All clusters had a false discovery rate cluster size significance of p < 0.002. Corresponding line plots below represent % signal change and standard error from the significant cluster identified in the time-frequency plot: delta-theta activity for reward and neutral. b. Time-frequency analysis of STN theta-beta phase-amplitude coupling for reward vs neutral. Black outlines symbolize clusters in reward outcomes that were significantly larger than neutral. All clusters had a false discovery rate cluster size significance of p < 0.002. Corresponding line plots below represent % signal change and standard error from the significant cluster identified in the time-frequency plot: theta-beta coupling activity for reward and neutral. C, correct; Neu, neutral; Rew, reward.
Association of LFP Activity With Behavioral and Clinical Outcomes
In exploratory analyses, we then asked if the LFP activity was associated with motivation as indexed by RT and addiction-like symptoms measured using the QUIP. The time-frequency regression analysis showed that greater delta-theta activity to reward cue and greater theta activity to reward outcome were both associated with faster RT or presumably higher motivation (Fig. 6). Furthermore, the time-frequency regression analysis showed that greater scores on the QUIP or higher addiction-like behaviors were associated with lower delta band activity during loss outcome (Fig. 5). There was also a significant positive prediction of QUIP from l-dopa dosage across all 17 patients (b = 0.6, t = 2.6, p = 0.02), with no associations between l-dopa and left STN LFP or coherence in the outcome phase. There were no associations observed between LFP and depression or impulsivity scores (all ps > 0.05).
Figure 6.
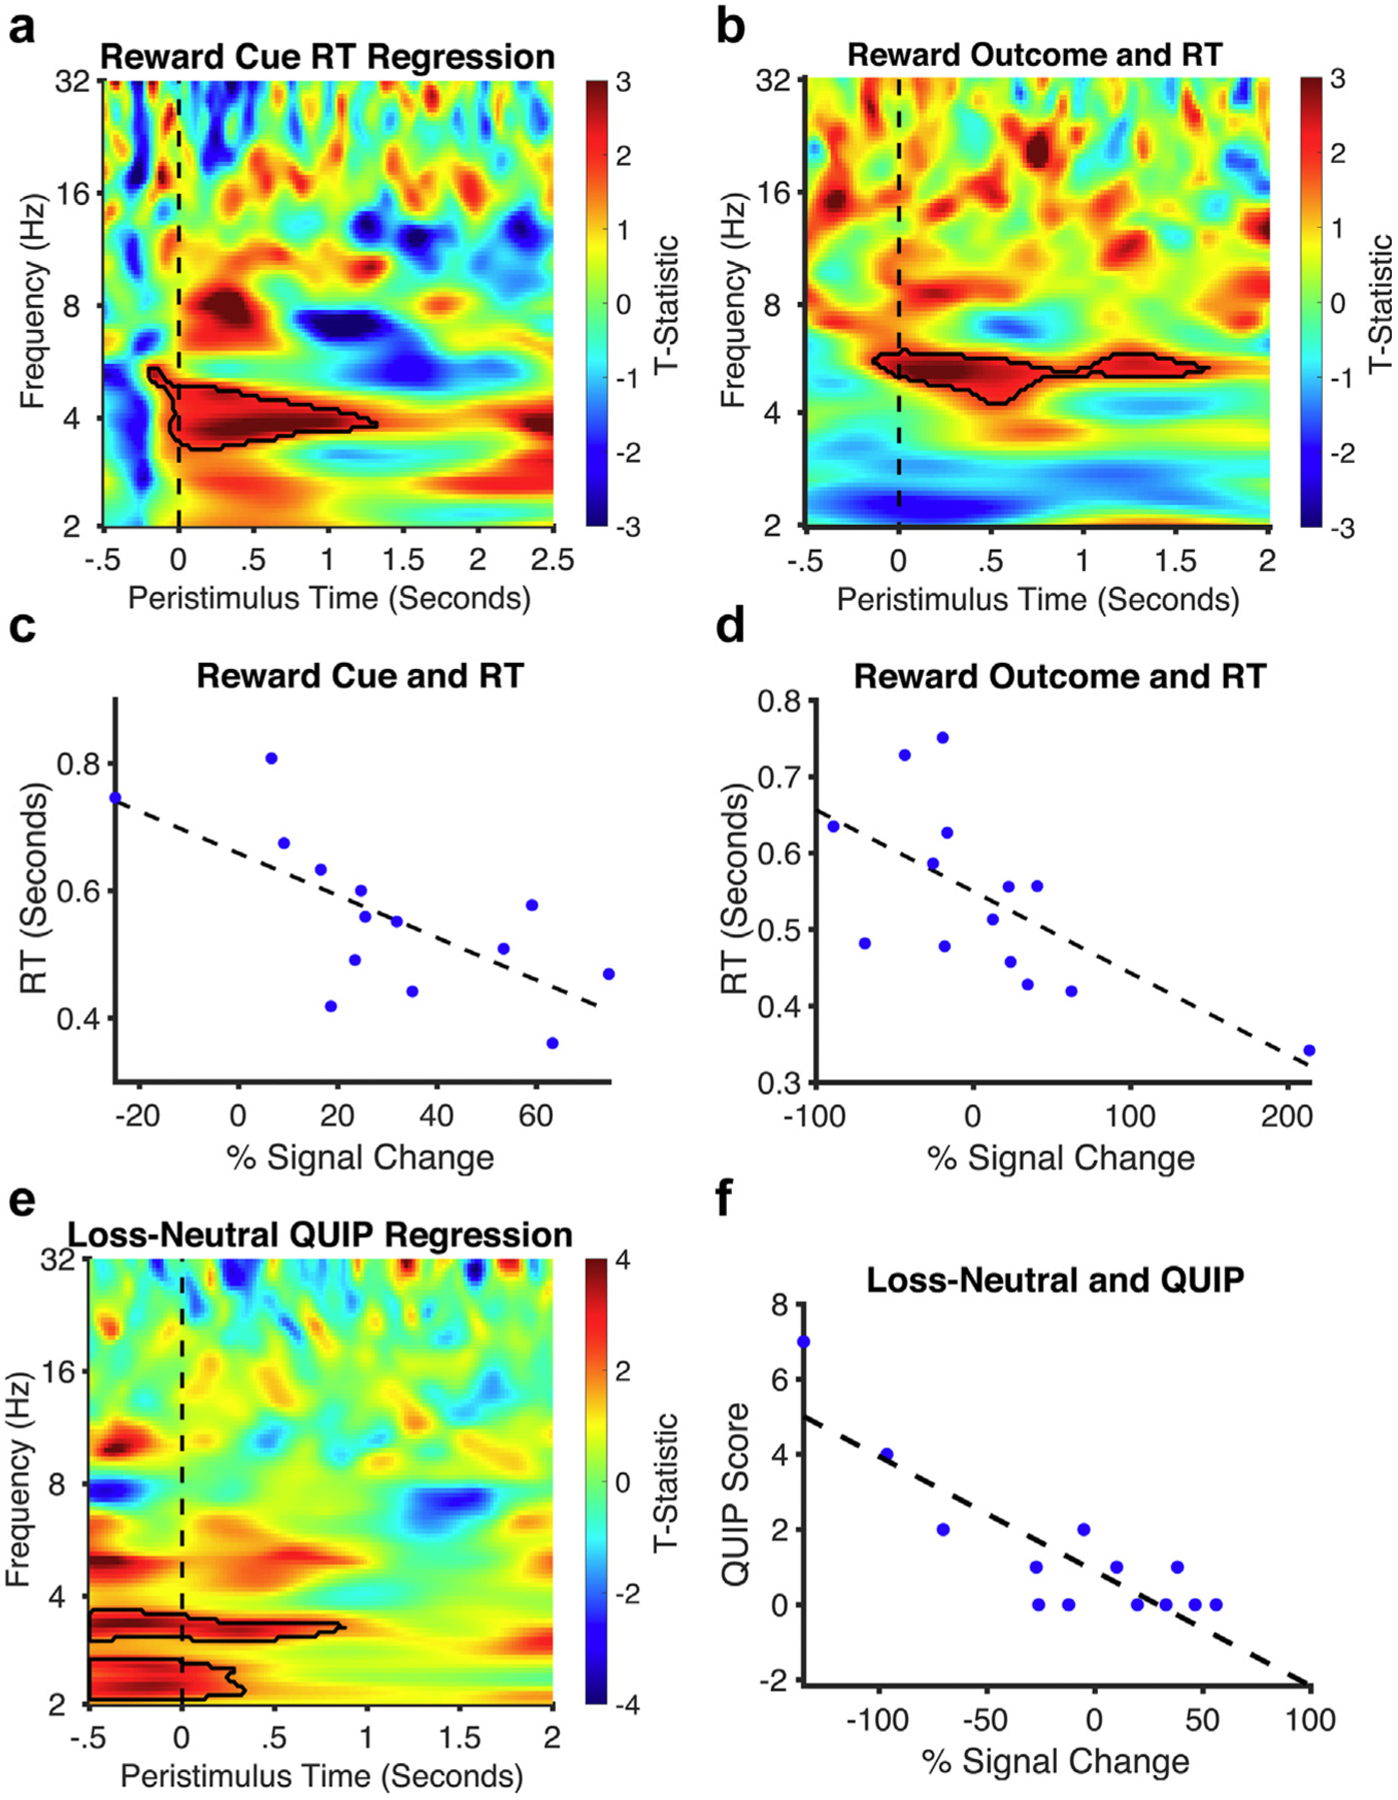
Regression analyses with RT and addiction scores. a and b. The time-frequency regression analysis plot of both the reward cue and outcome show greater low-frequency oscillatory activity to faster RTs (an index of higher motivation). Black outlines symbolize clusters in reward outcomes that were significantly larger than neutral. c and d. Corresponding regression plots show individual % signal change of significant findings and their relationship to RT. e and f. The time-frequency regression analysis plot of the loss vs neutral outcome shows lower delta activity to higher QUIP scores (an index of addiction severity).
We also used regression analysis to assess the relationship between peak bipolar time-frequency analyses and the Montreal Neurological Institute coordinates of the lowest contact from each individual’s peak beta bipolar contacts determined using LEAD-DBS. Reward vs neutral outcomes showed greater delta activity with more ventral contacts, and loss vs neutral outcomes showed greater delta activity with more medial contacts (Supplementary Data Fig. S4 and Table S2).
DISCUSSION
We highlight a critical role for the left STN in processing reward and loss, with a summary of the findings shown in Figure 7. During the expectation phase, enhanced left STN delta-theta activity is observed in both reward and loss anticipation, with greater left STN delta-theta activity associated with greater motivation specifically to reward. In the consummatory outcome phase, greater left STN delta activity was associated with a rewarding outcome, along with greater delta-theta coherence with the prefrontal cortex. We highlight a differential activity in the left STN to loss anticipation, demonstrating a distinct left STN high gamma activity. Crucially, patients with addiction-like behaviors show lower left STN delta-theta activity to loss outcomes, possibly reflecting abnormal processing of negative outcomes. Greater ventromedial localization was also associated with greater delta activity to outcomes consistent with more ventral and medial locations of cognitive and limbic left STN regions. Thus, we highlight STN physiologic activity to reward and loss processing, with the capacity to dissociate valence and demonstrate its clinical relevance.
Figure 7.
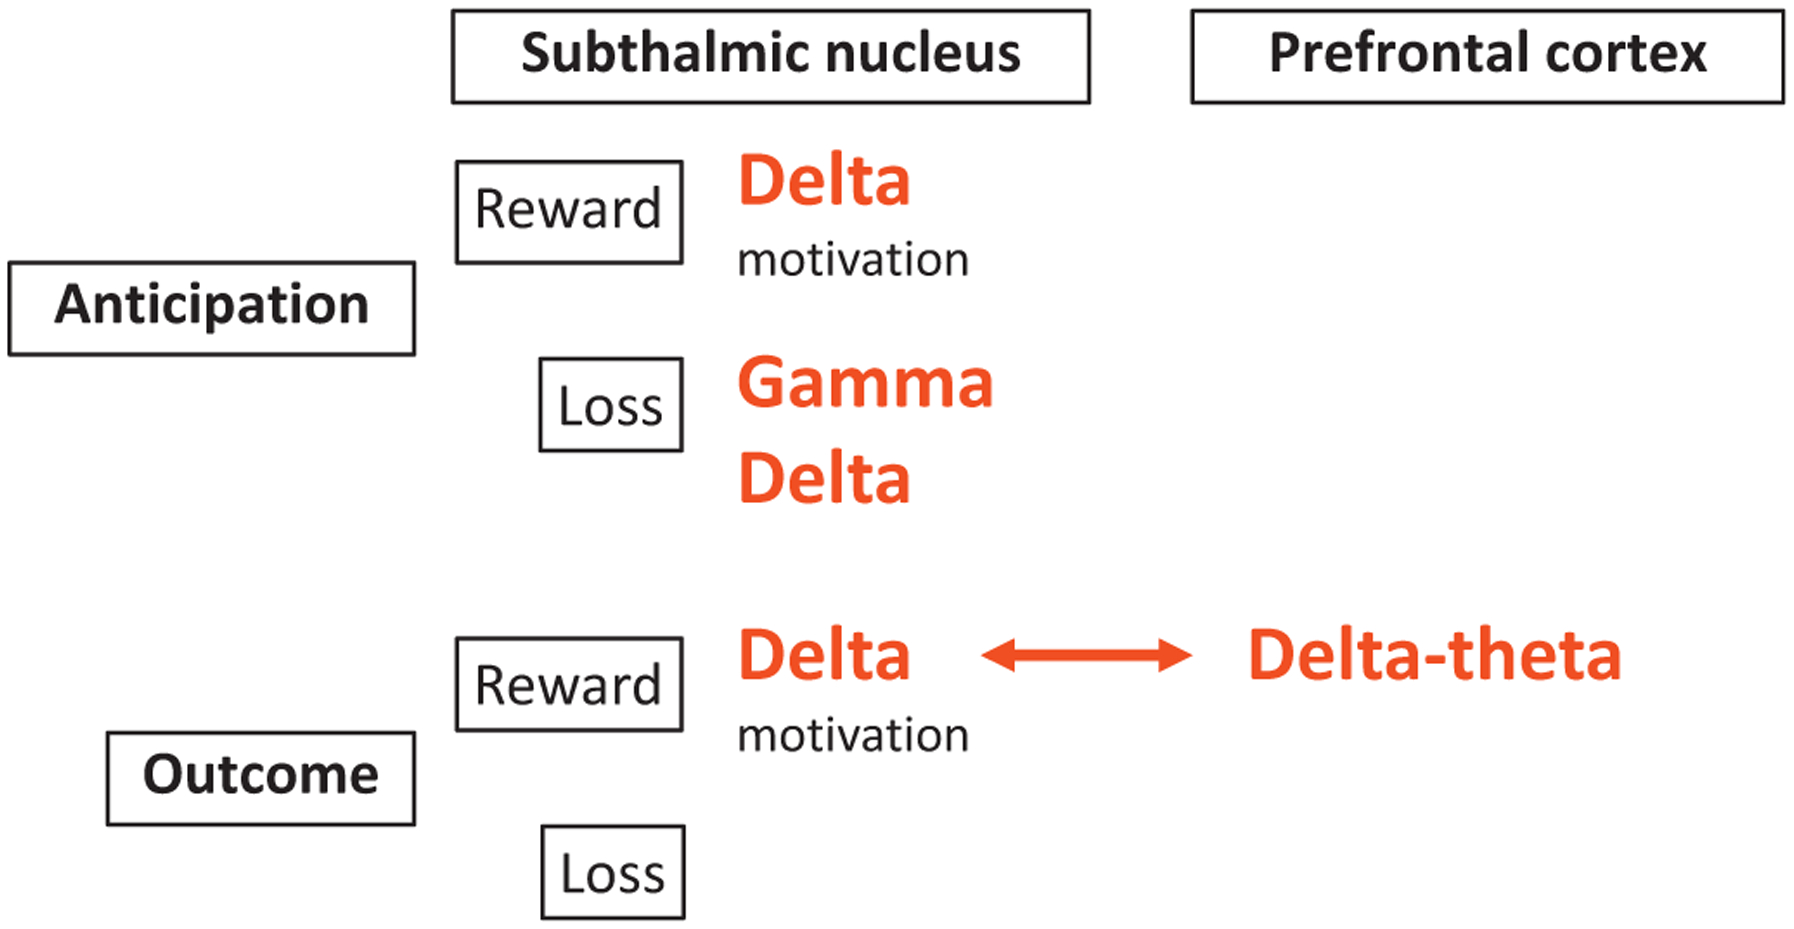
Summary of valence processing in the STN and prefrontal cortex using the MID task. We highlight our main physiological findings using the MID task dissociating reward and loss valence and anticipatory and outcome processes. Delta power is increased in the anticipatory phase across both reward and loss valences and acts as a potential marker of motivation. In contrast, gamma activity shows potential valence-specificity particularly during the anticipation of losses. In the outcome phase, delta power is elevated only during reward outcomes and is observed in both the prefrontal cortex and STN with enhanced coherence. Although loss outcomes do not show a main effect of power differences, lower delta activity to loss outcomes correlates with greater addiction severity.
Subthalamic Activity and Reward and Loss Processing
The STN acts as part of a network using valence information to guide and motivate behavior. The limbic and cognitive STN are part of a frontostriatal feedback loop receiving input from both the indirect and hyperdirect pathways from prefrontal reward and loss valuation regions, including the ventromedial prefrontal cortex and orbitofrontal cortex and the ventral striatum through the ventral pallidum.7
Our findings build on the rodent and human literature demonstrating a role for low-frequency activity in the STN in reward expectation, delivery, and reward magnitude.1,3,4 STN stimulation in human PD studies appears to enhance motivation, movement initiation, and speed in response to monetary incentives,26 and low-frequency delta-theta oscillations have been associated with measures of motivational effort using force-grip.5 Our findings further converge with observations of rodent NAc delta activity to food rewards.11 In this study, we provide supportive evidence of the delta-theta signal as an index of motivational processes to reward anticipation along with enhanced activity and connectivity during reward outcomes.
Fewer studies have focused on loss or aversive outcomes. Previous studies with acute high-frequency STN stimulation have shown a specific decrease in sensitivity to loss in the context of risk taking, with transiently enhanced loss chasing27 and decreased sensitivity to anticipated loss magnitudes.28 Single-unit recordings demonstrate that differing populations of STN neurons respond to the opportunity for reward and to avoid losing with proportionally greater neurons responding to reward relative to loss in the Go condition of a reward Go-NoGo Task (38% vs 25%) and similarly in the feedback phase (48% vs 32%).29 Unlike single-unit recordings, the LFP activity recorded here represents a summation of neuronal activity and is unable to discriminate between different neuronal populations acting in a relatively similar manner. Here, we highlight a specific increase in gamma power during the anticipation of loss that was not observed in reward.
Addiction-Like Behaviors and Loss Sensitivity
Critically, participants with higher addiction-like behavior scores showed lower left STN delta-theta activity in loss trials. Single-unit recordings have previously shown a greater proportion of reward relative to loss encoding neurons in patients with PD with behavioral addictions.29 In this study, we emphasize the specific frequency effects. Patients with PD with behavioral addictions have shown both enhanced learning from reward outcomes30 and impaired learning from negative prediction errors.31 Thus, addiction-like behaviors in PD may be driven by abnormal processing of negative consequences of actions. We have previously shown similar impairments in sensitivity to the anticipation of negative outcomes in binge drinkers, with the capacity to modulate risk-taking behavior through enhancing exposure to negative outcomes.32 STN DBS has been shown to be effective in decreasing dopaminergic medication–related gambling behaviors33 and compulsive medication use in patients with PD.34,35 Whether STN DBS might influence sensitivity to negative outcomes in these populations remains to be established.
Limitations
The study is not without limitations. Many MID functional imaging studies, but not all, have shown shorter RTs in incentive trials.36,37 Our lack of significant differences associated with RT may be related to slower responses in perioperative patients with PD. We also did not measure electromyography; however, we control for motor responses across conditions. Notably, delta-theta activity was also temporally separated from the motor response, and the rebound effects were temporally separated from the outcome phase. This study was further limited by the absence of recordings from the right STN.38 We have focused on the standard peak beta bipolar analyses, which are individualized in the analysis and indicate similar localization within the motor STN in which beta rhythms predominate. The L1–L2 results, although broadly similar, do not show differences in loss outcomes. The L1–L2 analysis is not individualized and may reflect greater anatomic heterogeneity, perhaps resulting in lower signal-to-noise ratio for activity that might be more subtly encoded. Our findings also cannot distinguish between motor, cognitive, and limbic territories in the STN.
Together, our findings highlight a role for the left STN in reward and loss processing and a clinically relevant impairment in loss sensitivity in addictive behaviors. These findings emphasize the cognitive-limbic function of the STN and its role as a physiologic target for neuropsychiatric disorders.
Supplementary Material
COMMENTS.
Valence processing in the STN is a current topic of considerable debate, with some scientists suggesting no role for this basal ganglion structure and others positing a central role. Here, the authors provide evidence of changes in STN oscillatory activity relative to reward vs loss during a monetary incentive task. The evidence is tempered by a constraint to the left hemisphere, and a causal role cannot be inferred from these studies. However, although limited, the findings are aligned with previous studies suggesting a role for STN in limbic networks and valence processing, and this work adds to that knowledge base.
Nicole Bentley, MD
Birmingham, AL, USA
The STN has been considered part of the reward/antireward circuitry, yet how it communicates with the other components of this circuitry (nucleus accumbens, ventral tegmental area, lateral habenula, prefrontal cortex, amygdala-hippocampal area, cingulate cortex, and insula) in humans is largely unknown. This article adds to our understanding by demonstrating that delta oscillations may be critical in processing reward and loss and may be a carrier wave that communicates both reward and loss with the prefrontal cortex. Further research such as this will elucidate whether delta frequencies are limited to the STN-prefrontal interactions or may represent a more general communication strategy for the entire reward/antireward circuit.
Dirk De Ridder, MD, PhD
Otago, New Zealand
This study examines prefrontal EEG and STN LFP activity in a cohort of human participants with PD. The main findings related to a demonstration of an increase in STN delta activity for reward and loss trials, interpreted as a saliency signal. Prefrontal delta activity is also statistically increased in the reward trials, which is not found in the loss trials. The authors did not find a relationship between the LFPs and behavior, either through RTs or clinical scores of moods or impulsivity. Right STN event-locked stimulation also did not affect behavior, and therefore, LFP analyses were restricted to the left side. Although the subcortical recordings surprisingly did not show a specific impact of valence, the study is a useful addition to the field in highlighting the relationship between the prefrontal–subthalamic salience network and delta oscillations.
Simon Little, PhD
Oxford, England, UK
Acknowledgements
The authors thank all the patients who participated in this study.
Source(s) of financial support:
This study was funded by a Natural Science Foundation of China Grant (81971294) and a grant from the Shanghai Science and Technology Commission (20410712000) to Dianyou Li. Valerie Voon was supported by a Medical Research Council Senior Clinical Fellowship (MR/P008747/1). Jun Li was supported by a Natural Science Foundation of China Grant (82001342).
Footnotes
For more information on author guidelines, an explanation of our peer review process, and conflict of interest informed consent policies, please see the journal’s Guide for Authors.
Conflict of Interest: The authors reported no conflict of interest.
SUPPLEMENTARY DATA
To access the supplementary material accompanying this article, visit the online version of Neuromodulation: Technology at the Neural Interface at www.neuromodulationjournal.org and at https://doi.org/10.1016/j.neurom.2022.04.033.
REFERENCES
- 1.Rossi PJ, Gunduz A, Okun MS. The subthalamic nucleus, limbic function, and impulse control. Neuropsychol Rev. 2015;25:398–410. [DOI] [PMC free article] [PubMed] [Google Scholar]
- 2.Lardeux S, Paleressompoulle D, Pernaud R, Cador M, Baunez C. Different populations of subthalamic neurons encode cocaine vs. sucrose reward and predict future error. J Neurophysiol. 2013;110:1497–1510. [DOI] [PubMed] [Google Scholar]
- 3.Baunez C, Dias C, Cador M, Amalric M. The subthalamic nucleus exerts opposite control on cocaine and ‘natural’ rewards. Nat Neurosci. 2005;8:484–489. [DOI] [PubMed] [Google Scholar]
- 4.Rouaud T, Lardeux S, Panayotis N, Paleressompoulle D, Cador M, Baunez C. Reducing the desire for cocaine with subthalamic nucleus deep brain stimulation. Proc Natl Acad Sci U S A. 2010;107:1196–1200. [DOI] [PMC free article] [PubMed] [Google Scholar]
- 5.Zénon A, Duclos Y, Carron R, et al. The human subthalamic nucleus encodes the subjective value of reward and the cost of effort during decision-making. Brain. 2016;139:1830–1843. [DOI] [PMC free article] [PubMed] [Google Scholar]
- 6.Voon V, Napier TC, Frank MJ, et al. Impulse control disorders and levodopa-induced dyskinesias in Parkinson’s disease: an update. Lancet Neurol. 2017;16:238–250. [DOI] [PubMed] [Google Scholar]
- 7.Haynes WI, Haber SN. The organization of prefrontal-subthalamic inputs in primates provides an anatomical substrate for both functional specificity and integration: implications for basal ganglia models and deep brain stimulation. J Neurosci. 2013;33:4804–4814. [DOI] [PMC free article] [PubMed] [Google Scholar]
- 8.Deuschl G, Schade-Brittinger C, Krack P, et al. A randomized trial of deep-brain stimulation for Parkinson’s disease. N Engl J Med. 2006;355:896–908. [DOI] [PubMed] [Google Scholar]
- 9.Mallet L, Polosan M, Jaafari N, et al. Subthalamic nucleus stimulation in severe obsessive-compulsive disorder. N Engl J Med. 2008;359:2121–2134. [DOI] [PubMed] [Google Scholar]
- 10.Tyagi H, Apergis-Schoute AM, Akram H, et al. A randomized trial directly comparing ventral capsule and anteromedial subthalamic nucleus stimulation in obsessive-compulsive disorder: clinical and imaging evidence for dissociable effects. Biol Psychiatry. 2019;85:726–734. [DOI] [PMC free article] [PubMed] [Google Scholar]
- 11.Wu H, Miller KJ, Blumenfeld Z, et al. Closing the loop on impulsivity via nucleus accumbens delta-band activity in mice and man. Proc Natl Acad Sci U S A. 2018;115:192–197. [DOI] [PMC free article] [PubMed] [Google Scholar]
- 12.Widge AS, Miller EK. Targeting cognition and networks through neural oscillations: next-generation clinical brain stimulation. JAMA Psychiatry. 2019;76:671–672. [DOI] [PMC free article] [PubMed] [Google Scholar]
- 13.Balodis IM, Potenza MN. Anticipatory reward processing in addicted populations: a focus on the monetary incentive delay task. Biol Psychiatry. 2015;77:434–444. [DOI] [PMC free article] [PubMed] [Google Scholar]
- 14.Weintraub D, Hoops S, Shea JA, et al. Validation of the questionnaire for impulsive-compulsive disorders in Parkinson’s disease. Mov Disord. 2009;24:1461–1467. [DOI] [PMC free article] [PubMed] [Google Scholar]
- 15.Evans AH, Okai D, Weintraub D, et al. Scales to assess impulsive and compulsive behaviors in Parkinson’s disease: critique and recommendations. Mov Disord. 2019;34:791–798. [DOI] [PubMed] [Google Scholar]
- 16.Oldham S, Murawski C, Fornito A, Youssef G, Yücel M, Lorenzetti V. The anticipation and outcome phases of reward and loss processing: a neuroimaging meta-analysis of the monetary incentive delay task. Hum Brain Mapp. 2018;39:3398–3418. [DOI] [PMC free article] [PubMed] [Google Scholar]
- 17.Brown P Oscillatory nature of human basal ganglia activity: relationship to the pathophysiology of Parkinson’s disease. Mov Disord. 2003;18:357–363. [DOI] [PubMed] [Google Scholar]
- 18.Ghahremani A, Aron AR, Udupa K, et al. Event-related deep brain stimulation of the subthalamic nucleus affects conflict processing. Ann Neurol. 2018;84:515–526. [DOI] [PMC free article] [PubMed] [Google Scholar]
- 19.Oostenveld R, Fries P, Maris E, Schoffelen JM. FieldTrip: open source software for advanced analysis of MEG, EEG, and invasive electrophysiological data. Comput Intell Neurosci. 2011;2011:156869. [DOI] [PMC free article] [PubMed] [Google Scholar]
- 20.Burgess AP. How conventional visual representations of time-frequency analyses bias our perception of EEG/MEG signals and what to do about it. Front Hum Neurosci. 2019;13:212. [DOI] [PMC free article] [PubMed] [Google Scholar]
- 21.Bastos AM, Schoffelen JM. A tutorial review of functional connectivity analysis methods and their interpretational pitfalls. Front Syst Neurosci. 2015;9:175. [DOI] [PMC free article] [PubMed] [Google Scholar]
- 22.Onslow AC, Bogacz R, Jones MW. Quantifying phase-amplitude coupling in neuronal network oscillations. Prog Biophys Mol Biol. 2011;105:49–57. [DOI] [PubMed] [Google Scholar]
- 23.Kiebel SJ, Tallon-Baudry C, Friston KJ. Parametric analysis of oscillatory activity as measured with EEG/MEG. Hum Brain Mapp. 2005;26:170–177. [DOI] [PMC free article] [PubMed] [Google Scholar]
- 24.Kilner JM, Kiebel SJ, Friston KJ. Applications of random field theory to electro-physiology. Neurosci Lett. 2005;374:174–178. [DOI] [PubMed] [Google Scholar]
- 25.Huebl J, Spitzer B, Brücke C, et al. Oscillatory subthalamic nucleus activity is modulated by dopamine during emotional processing in Parkinson’s disease. Cortex. 2014;60:69–81. [DOI] [PubMed] [Google Scholar]
- 26.Kojovic M, Higgins A, Jahanshahi M. In Parkinson’s disease STN stimulation enhances responsiveness of movement initiation speed to high reward value. Neuropsychologia. 2016;89:273–280. [DOI] [PubMed] [Google Scholar]
- 27.Rogers RD, Wielenberg B, Wojtecki L, Elben S, Campbell-Meiklejohn D, Schnitzler A. Deep brain stimulation of the subthalamic nucleus transiently enhances loss-chasing behaviour in patients with Parkinson’s disease. Exp Neurol. 2011;231: 181–189. [DOI] [PubMed] [Google Scholar]
- 28.Voon V, Droux F, Chabardes S, et al. Dissociable effects of subthalamic stimulation in obsessive compulsive disorder on risky reward and loss prospects. Neuroscience. 2018;382:105–114. [DOI] [PubMed] [Google Scholar]
- 29.Justin Rossi P, Peden C, Castellanos O, Foote KD, Gunduz A, Okun MS. The human subthalamic nucleus and globus pallidus internus differentially encode reward during action control. Hum Brain Mapp. 2017;38:1952–1964. [DOI] [PMC free article] [PubMed] [Google Scholar]
- 30.Voon V, Pessiglione M, Brezing C, et al. Mechanisms underlying dopamine-mediated reward bias in compulsive behaviors. Neuron. 2010;65:135–142. [DOI] [PMC free article] [PubMed] [Google Scholar]
- 31.Piray P, Zeighami Y, Bahrami F, Eissa AM, Hewedi DH, Moustafa AA. Impulse control disorders in Parkinson’s disease are associated with dysfunction in stimulus valuation but not action valuation. J Neurosci. 2014;34:7814–7824. [DOI] [PMC free article] [PubMed] [Google Scholar]
- 32.Worbe Y, Irvine M, Lange I, et al. Neuronal correlates of risk-seeking attitudes to anticipated losses in binge drinkers. Biol Psychiatry. 2014;76:717–724. [DOI] [PMC free article] [PubMed] [Google Scholar]
- 33.Ardouin C, Voon V, Worbe Y, et al. Pathological gambling in Parkinson’s disease improves on chronic subthalamic nucleus stimulation. Mov Disord. 2006;21:1941–1946. [DOI] [PubMed] [Google Scholar]
- 34.Eusebio A, Witjas T, Cohen J, et al. Subthalamic nucleus stimulation and compulsive use of dopaminergic medication in Parkinson’s disease. J Neurol Neurosurg Psychiatry. 2013;84:868–874. [DOI] [PubMed] [Google Scholar]
- 35.Cilia R, Siri C, Canesi M, et al. Dopamine dysregulation syndrome in Parkinson’s disease: from clinical and neuropsychological characterisation to management and long-term outcome. J Neurol Neurosurg Psychiatry. 2014;85:311–318. [DOI] [PubMed] [Google Scholar]
- 36.Pizzagalli DA, Holmes AJ, Dillon DG, et al. Reduced caudate and nucleus accumbens response to rewards in unmedicated individuals with major depressive disorder. Am J Psychiatry. 2009;166:702–710. [DOI] [PMC free article] [PubMed] [Google Scholar]
- 37.du Plessis S, Bossert M, Vink M, et al. Reward processing dysfunction in ventral striatum and orbitofrontal cortex in Parkinson’s disease. Parkinsonism Relat Disord. 2018;48:82–88. [DOI] [PubMed] [Google Scholar]
- 38.Eitan R, Shamir RR, Linetsky E, et al. Asymmetric right/left encoding of emotions in the human subthalamic nucleus. Front Syst Neurosci. 2013;7:69. [DOI] [PMC free article] [PubMed] [Google Scholar]
Associated Data
This section collects any data citations, data availability statements, or supplementary materials included in this article.


