Abstract
Aging induces marked alterations in the structural, mechanical, and transport properties in the extracellular matrix (ECM). To provide computational data on the impact of aging-related changes on ECM mechanical quantities and transport properties, we developed a computational model for the aging-related ECM fibrous network. A finite volume method was utilized to calculate the velocity field, pressure loss, hydraulic conductivity and drag force. Our results quantitatively demonstrated that the hydraulic conductivity in most of the aging ECM-mimetic fibrous networks tends to be significantly lower than young ECM-mimetic fibrous networks, while pressure loss and drag force show the opposite trend. All these findings highlight that such altered mechanical quantities and transport properties during aging can be important biological cues to assess the aging process and eventually provide insights in treating aging-related diseases.
Keywords: Aging extracellular matrix, Fiber orientation, Viscosity, Hydraulic conductivity, Pressure loss, Drag force, Wall shear stress
1. Introduction
Aging, both intrinsically and extrinsically, triggers a gradual or rapid functional decline in biological activity in various human tissues [1]. Among the tissue structural components, the extracellular matrix (ECM) plays a key role in providing physical support for the cells and regulating diverse cell dynamics and behaviors, and its structural organization or architecture is significantly altered during aging [2]. Early findings demonstrated that collagen fibers, a major ECM fiber, in aging tissues tend to be highly aligned compared to those in young tissue displaying randomly oriented where these observations were based on the advanced imaging techniques such as polarized-Fourier transform infrared (FTIR) imaging [3], polarized Raman spectroscopy [4] or second-harmonic-generation (SHG) microscopy [5].
So far, a number of studies have shown that ECM orientation or alignment is strongly related to transport properties such as permeability, hydraulic conductivity or diffusivity and mechanical stress. Prior studies showed that permeability is larger in fibrous networks parallel to the axis of fluid flow than those perpendicular to the axis [6–8]. Molecular diffusion anisotropy was also found to be higher in the 3D scaffolds with aligned fiber than with random fiber orientation [9]. Moreover, it has been proven that highly aligned collagen fibers in the aged dermis have a poor capability to transmit stress forces to surrounding cells compared to those in the young dermis, which may cause diverse biological dysfunctions and diseases [10]. However, when it comes to the relationship between aging, structural changes and mechanical/transport properties, and its implications, available data is relatively scarce.
Motivated by the unmet need, in this study, we developed a computational model for the aging-related ECM fibrous network to investigate the effects of aging-related structural changes on mechanical quantities and transport properties of ECM. To achieve this goal, we designed and constructed different structures of ECM to mimic aging and young ECM fibrous networks (aging networks and young networks for short, respectively). Aging networks include 1D or 2D parallel and perpendicular fibrous networks of interwoven chains, and 3D cubic fibrous networks (1D/2D parallel, perpendicular, and 3D cubic networks for short, respectively), while young networks include 3D randomly oriented fibrous networks composed of 30 fibers (F30) or 50 fibers (F50), designed by the second-order orientation tensor, based on the previous observation that the collagen fibers in aging/aged skin tissue are more anisotropically aligned than those in young skin tissue that has more randomly oriented networks [11]. We then calculated pressure loss, hydraulic conductivity and drag force for aging and young networks, and the results were compared and its implications were briefly discussed.
2. Computational methods
2.1. Geometric information for aging and young ECM-mimetic fibrous networks
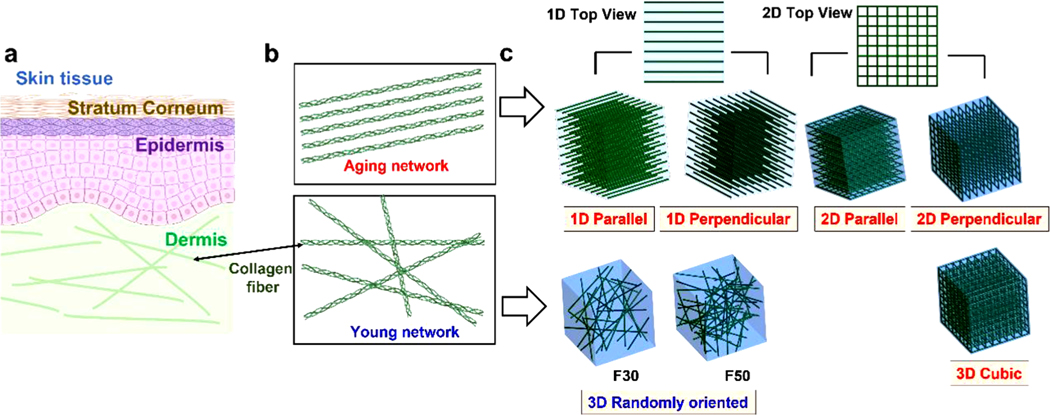
As mentioned before, through the experimental observation from early studies that aging collagen fibers at the skin dermis are highly aligned while young collagen fibers are randomly oriented (Fig. 1a,b) [12], we used 1D/2D parallel, perpendicular, and 3D cubic fibrous networks to the fluid flow to mimic the aging networks, and 3D randomly oriented fibrous networks with the number of F30 and F50 to mimic the young networks (Fig. 1c). To characterize and construct the randomly oriented networks, the second-order orientation tensor () was employed as follows [13]:
| (1) |
where and are the length of the fiber and the total fiber length, respectively. and are the elevation angle, which is formed by the fiber axis and the -axis, and the azimuth angle, which is formed between the projection of the fiber on the plane and the -axis, respectively. Since we utilize the isotropic model, on-diagonal components , , and are close to 0.33 where the trace of is always 1.
Fig. 1.
Computational modeling of aging and young extracellular matrix (ECM)-mimetic fibrous networks (aging and young networks for short, respectively). (a) Human skin tissue, composed of the epidermis and dermis. (b) Fiber orientation in aging and young networks. ECM fibers are highly aligned in the aging networks while randomly oriented in the young networks. (c) 1D Parallel and perpendicular fibrous networks, 2D Parallel and perpendicular fibrous networks of interwoven chains, and 3D cubic fibrous networks (1D/2D parallel, perpendicular, and 3D cubic networks for short, respectively) to mimic the aging networks, and 3D randomly oriented networks consisting of the number of 30 fibers (F30) and 50 fibers (F50) to mimic the young networks.
The detailed geometric information, including fiber diameter, porosity, and isotropic tensor for aging and young networks, is shown in Table 1 as reported previously [7].
Table 1.
Parameters of network models used in this study.
| Model type | Fiber diameter (D, nm) | Porosity | Isotropic tensor |
|---|---|---|---|
| 1D Parallel a) | 1000 | 0.978 | N/A c) |
| 1D Perpendicular a) | 1000 | 0.978 | |
| 2D Parallel a) | 1000 | 0.955 | |
| 2D Perpendicular a) | 1000 | 0.955 | |
| 3D Cubic a) | 500 | 0.984 | |
| 1000 | 0.936 | ||
| 2000 | 0.792 | ||
| Randomly oriented (F30) b) | |||
| Group 1 | 1000 | 0.991 | , , |
| 2000 | 0.964 | ||
| 3000 | 0.922 | ||
| Group 2 | 1000 | 0.992 | , , |
| 2000 | 0.969 | ||
| 3000 | 0.933 | ||
| Group 3 | 1000 | 0.991 | , , |
| 2000 | 0.964 | ||
| 3000 | 0.922 | ||
| Randomly oriented (F50) b) | |||
| Group 1 | 1000 | 0.986 | , , |
| 2000 | 0.943 | ||
| 3000 | 0.878 | ||
| Group 2 | 1000 | 0.987 | , , |
| 2000 | 0.949 | ||
| 3000 | 0.892 | ||
| Group 3 | 1000 | 0.986 | , , |
| 2000 | 0.949 | ||
| 3000 | 0.893 | ||
aging ECM-mimetic fibrous network;
young ECM-mimetic fibrous network;
N/A: not applicable.
2.2. Numerical conditions: modeling, meshing, boundary conditions and equations
All ECM network models were created using a computer-aided design (CAD) software program (SolidWorks 2016). For the randomly oriented networks, we seeded random nucleation points in the representative volume element (50 × 50 × 50 μm3) using MATLAB. The nucleation points were then designed to grow until they collided with walls. More detailed information regarding algorithms and methods is described in [7]. Using the macro function of the CAD program, 3D solid geometry models with different diameters were automatically created, and subsequently volumetric unstructured tetrahedral mesh, whose number ranges from 2 to 8 million, was applied to divide the geometry into elements using a commercial CFD software program (ANSYS 18/ICEM-CFD). To minimize the impact of mesh size and number on the calculated results, a grid dependence test was carried out (Fig. S1). Subsequently, a finite volume method was utilized to calculate the velocity field, pressure loss, hydraulic conductivity, and drag force.
To describe fluid flow in the aging and young networks, we solved two governing equations: mass and momentum conservation given by [14]:
| (2) |
| (3) |
where and are the fluid pressure and fluid velocity vector, respectively. Since the fluid flow is extremely slow in these networks (i.e., Reynolds number << 1), the momentum equation can be simplified to the Stokes equation (Eq. (3)).
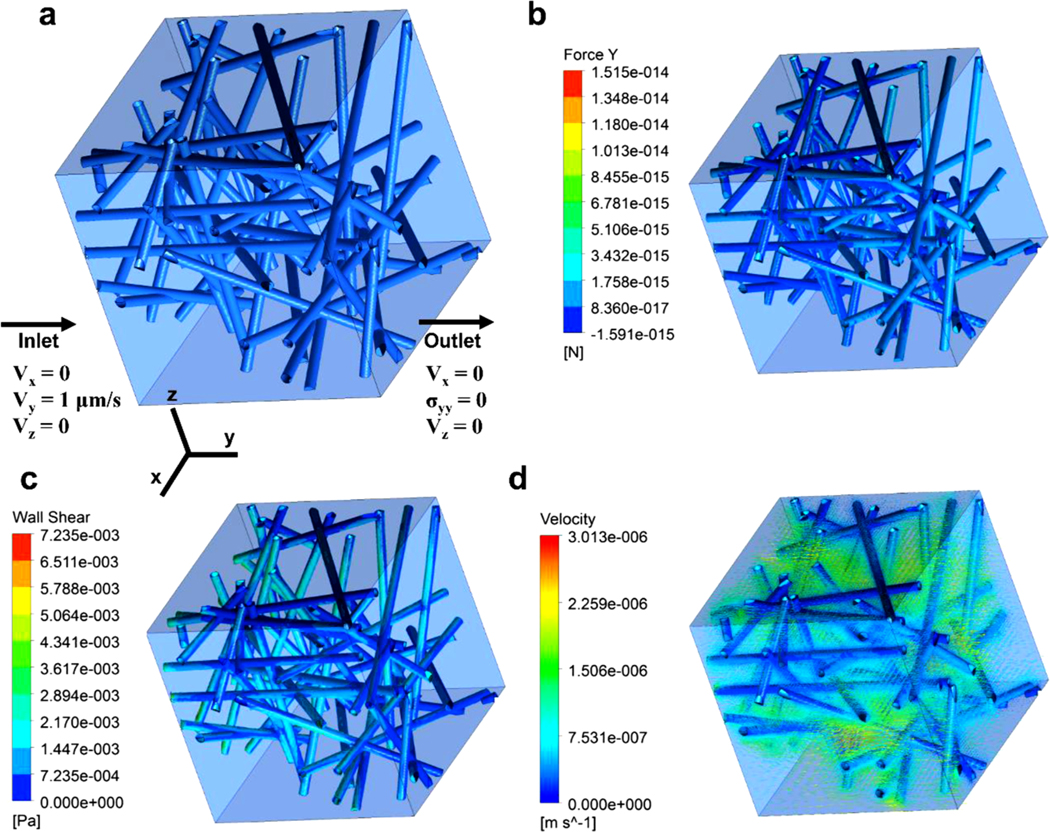
For the inlet condition, a constant velocity (1 μm/s) was applied to the inlet surface based on the physiologically relevant interstitial flow velocity ranging from 0.1 to 2 μm/s (Fig. 2a) while a pressure value of 0 Pa was applied to the outlet surface. For the boundary condition, a slip condition was set to the sidewalls, and a non-slip condition was assumed to the fiber surface. After solving the governing equations, the hydraulic conductivity was calculated using Darcy’s law:
| (4) |
where is the bulk-averaged interstitial fluid velocity and is the hydraulic conductivity.
Fig. 2.

Information for numerical analysis and representative results. (a) Boundary conditions, (b) drag force acting on fibers, (c) wall shear stress (WSS) and (d) fluid velocity.
The total drag force was calculated with the following form [15]:
| (5) |
where and are the normal and tangential direction to the surface with area , is the unit vector in the free stream direction, and is the wall shear stress (WSS). The first and second terms on the right-hand side are the pressure and skin friction drag force, respectively.
The representative results, including drag force, WSS, and velocity vectors in the network, are shown in Fig. 2b.
3. Results
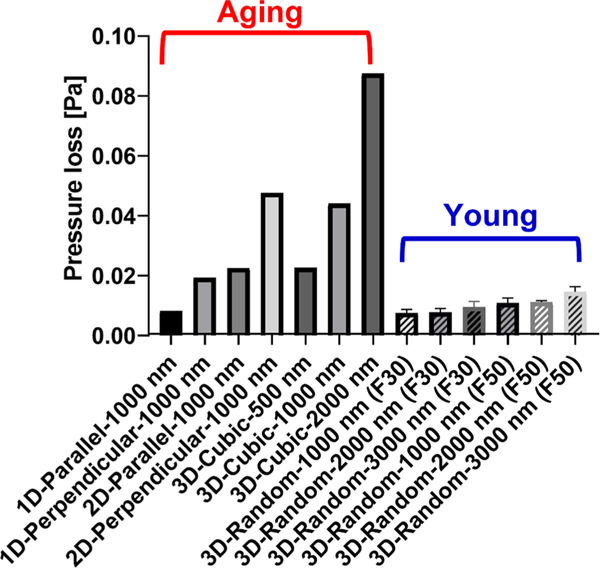
Results revealed that the pressure loss for most of the aging networks, except for the 1D parallel network with 1000 nm, is greater than that of young networks, showing maximal pressure loss as 0.088 Pa for aging networks and 0.015 Pa for young networks (Fig. 3). We also examined the impact of pure porosity on pressure loss by modulating fiber diameter in the same network group while maintaining the architecture. We found that as the fiber diameter increases and thus porosity decreases, the pressure loss tends to increase at 3D cubic and 3D randomly oriented networks for both F30 and F50. For the 3D cubic networks, for instance, as the fiber diameter increases from 500 nm to 2000 nm where the corresponding porosity is 0.948 to 0.792 respectively, the pressure loss increases from 0.023 Pa to 0.088 Pa. Similarly, for the randomly oriented networks for both F30 and F50, the pressure loss tends to increase with the increasing fiber diameter, thus decreasing porosity, while the degree of difference in pressure loss of these models is smaller compared to cubic networks. For comparison of perpendicular and parallel groups, both 1D/2D perpendicular networks yield higher pressure loss (0.019 Pa for 1D and 0.048 Pa for 2D) than 1D/2D parallel networks (0.008 Pa for 1D and 0.023 Pa for 2D), respectively.
Fig. 3.
The effect of aging-related structural changes on pressure loss. Bars filled with the diagonal pattern indicate young networks, while the rest indicates aging networks. Error bars represent a standard deviation.
In contrast to the pressure loss, the hydraulic conductivity tends to be negatively correlated to aging, displaying maximal hydraulic conductivity, except for the 1D parallel network with 1000 nm (Fig. 4). When it comes to the porosity effect, in the case of the 3D cubic networks, as the fiber diameter increases from 500 nm to 2000 nm where porosity decreases, the hydraulic conductivity decreases from 2.21 × 10⁻⁹ m2/Pa/sec to 5.71 × 10⁻¹⁰ m2/Pa/sec. Such a trend was observed in the 3D randomly oriented networks for both F30 and F50. The 1D/2D perpendicular networks exhibit a lower hydraulic conductivity than the 1D/2D parallel networks.
Fig. 4.
The effect of aging-related structural changes on hydraulic conductivity.
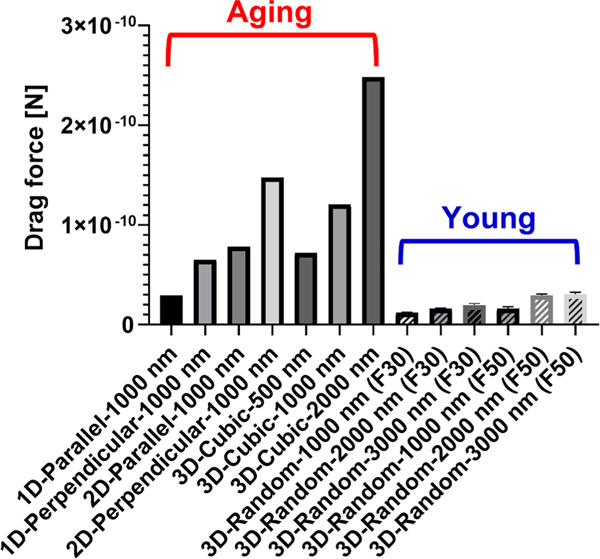
We also checked if aging-related structural changes affect ECM drag force (Fig. 5). It turned out that drag forces in most aging networks are much higher than young networks. In particular, the maximal drag forces in aging networks are 2.483 × 10⁻¹⁰ N (3D-Cubic-2000 nm) while in young networks, 2.828 × 10⁻¹¹ N (3D-Random-1000 nm (F30)) respectively, where the maximal drag forces in aging networks are approximately 8.8 times higher than those in young networks, respectively. The drag force of the 3D cubic and 3D randomly oriented networks increases as the fiber diameter increases (i.e., the porosity decreases), as is the case of pressure loss. Finally, both 1D/2D fibrous networks perpendicular to the fluid flow constantly undergoes higher drag force than those parallel to the fluid flow.
Fig. 5.
The effect of aging-related structural changes on drag force.
4. Discussion and conclusion
In this study, we proved the effects of aging-related structural changes on mechanical quantities and transport properties using the computational model. To mimic the aging-related ECM networks, we computationally simulated a geometric feature of aging and young ECM networks observed in dermal tissues or connective tissues: highly aligned networks (i.e., 1D/2D parallel, 1D/2D perpendicular and 3D cubic networks) and randomly oriented networks. In general, results showed a trend that aging networks tend to have lower hydraulic conductivity but higher pressure loss and drag force, compared to the young ECM networks. However, there was an exceptional case for the 1D parallel network with 1000 nm. 1D parallel network with 1000 nm exhibits a lower pressure loss than most of the young networks. These results indicate that depending on the fiber alignment relative to fluid flow, the mechanical quantities or transport properties of aging networks may be either greater or lower than those of young networks. This may imply that in aging tissue, fluid can flow either parallel or perpendicular to the fiber alignment, or both can occur together.
The highly aligned ECM fiber networks in aging tissue may alter diverse mechanical factors which may trigger abnormal biological processes. For example, the highly aligned ECM fiber networks could lead to the poor mechanical integrity of ECM due to the loss of crosslinking agents and thus potentially a decrease in mechanical properties. Not limited to the mechanical integrity, abnormally aligned fibers may result in poor gene or molecular expression, mechanical stimulation, cellular function and differentiation, [10,19–23].
It has been also suggested that the velocity field, pressure loss, hydraulic conductivity, and flow-driven drag force acting on the fiber may be highly associated with transport of various molecules such as cytokines or chemokines, direct cell migration, and capillary morphogenesis [8, 16, 17]. However, the ECM mechanics of fluid and solid components still remains to be more elucidated [18]. In addition, little is known about the complex multiple relationship between aging, ECM architecture, transport properties, and mechanics. Therefore, it is our next primary interest to correlate the ECM architecture and transport properties to mechanics and/or mechanical/viscoelastic properties of human tissue, which are altered during the aging process. In this regard, the present study will provide baseline data for the next study to understand the structure-function-property relationships of human aging tissue, thereby contributing to unraveling the underlying mechanism for diverse aging-related biological processes and improving the outcomes of treatment of aging-related diseases.
Supplementary Material
Funding
This study was supported by the National Institute on Aging of the National Institutes of Health under award number K25AG070286.
Footnotes
Ethics approval
Not required.
Declaration of Competing Interest
We declare no conflict of interests associated with this paper.
Supplementary materials
Supplementary material associated with this article can be found, in the online version, at doi:10.1016/j.medengphy.2022.103843.
References
- [1].Chalise HN. Aging: basic concept. Am J Biomed Sci Res 2019;1:8–10. 10.34297/ajbsr.2019.01.000503. [DOI] [Google Scholar]
- [2].Kusindarta DL, Wihadmadyatami H. The role of extracellular matrix in tissue regeneration. Tissue Regeneration. 2018.
- [3].Eklouh-Molinier C, Nguyen TT, Sebiskveradze D, et al. Interest of polarized FT-IR imaging to characterize the collagen network in human skin. Biomed Spectrosc Imaging 2014;3:281–6. 10.3233/bsi-140076. [DOI] [Google Scholar]
- [4].Van Gulick L, Saby C, Morjani H, Beljebbar A. Age-related changes in molecular organization of type I collagen in tendon as probed by polarized SHG and Raman microspectroscopy. Sci Rep 2019;9:7280. 10.1038/s41598-019-43636-2. [DOI] [PMC free article] [PubMed] [Google Scholar]
- [5].Ogura Y, Tanaka Y, Hase E, et al. Texture analysis of second-harmonic-generation images for quantitative analysis of reticular dermal collagen fibre in vivo in human facial cheek skin. Exp Dermatol 2019;28:899–905. 10.1111/exd.13560. [DOI] [PubMed] [Google Scholar]
- [6].Stylianopoulos T, Yeckel A, Derby JJ, et al. Permeability calculations in three-dimensional isotropic and oriented fiber networks. Phys Fluids 2008;20:123601. 10.1063/1.3021477. [DOI] [PMC free article] [PubMed] [Google Scholar]
- [7].Park S Computational modeling for prediction of the shear stress of three-dimensional isotropic and aligned fiber networks. Comput Methods Programs Biomed 2017;148:91–8. 10.1016/j.cmpb.2017.06.019. [DOI] [PubMed] [Google Scholar]
- [8].Pedersen JA, Lichter S, Swartz MA. Cells in 3D matrices under interstitial flow: effects of extracellular matrix alignment on cell shear stress and drag forces. J Biomech 2010;43:900–5. 10.1016/j.jbiomech.2009.11.007. [DOI] [PubMed] [Google Scholar]
- [9].Chen P, Chen X, Hepfer RG, et al. A noninvasive fluorescence imaging-based platform measures 3D anisotropic extracellular diffusion. Nat Commun 2021;12: 1913. 10.1038/s41467-021-22221-0. [DOI] [PMC free article] [PubMed] [Google Scholar]
- [10].Marcos-Garcés V, Molina Aguilar P, Bea Serrano C, et al. Age-related dermal collagen changes during development, maturation and ageing - a morphometric and comparative study. J Anat 2014;225:98–108. 10.1111/joa.12186. [DOI] [PMC free article] [PubMed] [Google Scholar]
- [11].Kaur A, Ecker BL, Douglass SM, et al. Remodeling of the collagen matrix in aging skin promotes melanoma metastasis and affects immune cell motility. Cancer Discov 2019. 10.1158/2159-8290.CD-18-0193. [DOI] [PMC free article] [PubMed]
- [12].Kaur A, Ecker BL, Douglass SM, et al. Remodeling of the collagen matrix in aging skin promotes melanoma metastasis and affects immune cell motility. Cancer Discov 2019;9:64–81. 10.1158/2159-8290.CD-18-0193. [DOI] [PMC free article] [PubMed] [Google Scholar]
- [13].Stylianopoulos T, Barocas VH. Multiscale, structure-based modeling for the elastic mechanical behavior of arterial walls. J Biomech Eng 2007;129:611–8. 10.1115/1.2746387. [DOI] [PubMed] [Google Scholar]
- [14].Park S, Whittington C, Voytik-Harbin SL, Han B. Microstructural parameter-based modeling for transport properties of collagen matrices. J Biomech Eng 2015;137. 10.1115/1.4029920. [DOI] [PMC free article] [PubMed]
- [15].Park S, Joo YK, Chen Y. Dynamic adhesion characterization of cancer cells under blood flow-mimetic conditions: effects of cell shape and orientation on drag force. Microfluid Nanofluidics 2018;22:108. 10.1007/s10404-018-2132-7. [DOI] [Google Scholar]
- [16].Fleury ME, Boardman KC, Swartz MA. Autologous morphogen gradients by subtle interstitial flow and matrix interactions. Biophys J 2006. 10.1529/biophysj.105.080192. [DOI] [PMC free article] [PubMed]
- [17].Shields JD, Fleury ME, Yong C, et al. Autologous chemotaxis as a mechanism of tumor cell homing to lymphatics via interstitial flow and autocrine CCR7 Signaling. Cancer Cell 2007. 10.1016/j.ccr.2007.04.020. [DOI] [PubMed]
- [18].Shrestha P, Stoeber B. Imaging fluid injections into soft biological tissue to extract permeability model parameters. Phys Fluids 2020. 10.1063/1.5131488. [DOI]
- [19].Boardman KC, Swartz MA. Interstitial flow as a guide for lymphangiogenesis. Circ Res 2003. 10.1161/01.RES.0000065621.69843.49. [DOI] [PubMed]
- [20].Hernández Vera R, Genové E, Alvarez L, Borrós S, Kamm R, Lauffenburger D, et al. Interstitial fluid flow intensity modulates endothelial sprouting in restricted Src-activated cell clusters during capillary morphogenesis. Tissue Eng - Part A 2009. 10.1089/ten.tea.2007.0314. [DOI] [PMC free article] [PubMed]
- [21].Ng CP, Hinz B, Swartz MA. Interstitial fluid flow induces myofibroblast differentiation and collagen alignment in vitro. J Cell Sci 2005. 10.1242/jcs.02605. [DOI] [PubMed]
- [22].Ng CP, Swartz MA. Mechanisms of interstitial flow-induced remodeling of fibroblast-collagen cultures. Ann Biomed Eng 2006. 10.1007/s10439-005-9067-3. [DOI] [PubMed]
- [23].Urbanczyk M, Layland SL, Schenke-Layland K. The role of extracellular matrix in biomechanics and its impact on bioengineering of cells and 3D tissues. Matrix Biol 2020;8586:114. 10.1016/j.matbio.2019.11.005. [DOI] [PubMed] [Google Scholar]
Associated Data
This section collects any data citations, data availability statements, or supplementary materials included in this article.


