Abstract
Brigatinib, a next-generation anaplastic lymphoma kinase (ALK) inhibitor designed to overcome mechanisms of resistance associated with crizotinib, is approved for the treatment of ALK-positive advanced or metastatic non-small cell lung cancer. After oral administration of single doses of brigatinib 30–240 mg, the median time to reach maximum plasma concentration ranged from 1 to 4 h. In patients with advanced malignancies, brigatinib showed dose linearity over the dose range of 60–240 mg once daily. A high-fat meal had no clinically meaningful effect on systemic exposures of brigatinib (area under the plasma concentration–time curve); thus, brigatinib can be administered with or without food. In a population pharmacokinetic analysis, a three-compartment pharmacokinetic model with transit absorption compartments was found to adequately describe brigatinib pharmacokinetics. In addition, the population pharmacokinetic analyses showed that no dose adjustment is required based on body weight, age, race, sex, total bilirubin (< 1.5× upper limit of normal), and mild-to-moderate renal impairment. Data from dedicated phase I trials have indicated that no dose adjustment is required for patients with mild or moderate hepatic impairment, while a dose reduction of approximately 40% (e.g., from 180 to 120 mg) is recommended for patients with severe hepatic impairment, and a reduction of approximately 50% (e.g., from 180 to 90 mg) is recommended when administering brigatinib to patients with severe renal impairment. Brigatinib is primarily metabolized by cytochrome P450 (CYP) 3A, and results of clinical drug–drug interaction studies and physiologically based pharmacokinetic analyses have demonstrated that coadministration of strong or moderate CYP3A inhibitors or inducers with brigatinib should be avoided. If coadministration with a strong or moderate CYP3A inhibitor cannot be avoided, the dose of brigatinib should be reduced by approximately 50% (strong CYP3A inhibitor) or approximately 40% (moderate CYP3A inhibitor), respectively. Brigatinib is a weak inducer of CYP3A in vivo; data from a phase I drug–drug interaction study showed that coadministration of brigatinib 180 mg once daily reduced the oral midazolam area under the plasma concentration–time curve from time zero to infinity by approximately 26%. Brigatinib did not inhibit CYP1A2, CYP2B6, CYP2C8, CYP2C9, CYP2C19, or CYP2D6 at clinically relevant concentrations in vitro. Exposure–response analyses based on data from the ALTA (ALK in Lung Cancer Trial of AP26113) and ALTA-1L pivotal trials of brigatinib confirm the favorable benefit versus risk profile of the approved titration dosing regimen of 180 mg once daily (after a 7-day lead-in at 90 mg once daily).
Key Points
| The clinical pharmacology of brigatinib, an orally administered anaplastic lymphoma kinase (ALK) inhibitor, approved for the treatment of metastatic ALK-positive non-small cell lung cancer has been extensively characterized based on data from phase I–III clinical trials, as well as integrated population pharmacokinetic, physiologically based pharmacokinetic, and exposure–response analyses. |
| Sex, age, race, body weight, food, and mild or moderate renal or hepatic impairment do not have a clinically meaningful effect on the pharmacokinetics of brigatinib. |
| Exposure–response analyses confirm the favorable benefit versus risk profile of the approved titration dosing regimen of a 7-day lead-in at 90 mg once daily followed by 180 mg once daily. |
Introduction
Approximately 3–5% of patients with non-small cell lung cancer (NSCLC) have oncogenic anaplastic lymphoma kinase (ALK) rearrangements [1–3], which leads to dysregulation and incorrect signaling through the ALK kinase domain [4, 5]. ALK-rearrangement targeted therapies, including crizotinib, ceritinib, alectinib, brigatinib, and lorlatinib, have improved outcomes for patients with ALK-positive NSCLC [6–14]. Although first- (crizotinib) and next-generation (alectinib, ceritinib, brigatinib, and lorlatinib) ALK inhibitors show high initial activity, resistance eventually develops. The central nervous system has been identified as the primary site of failure in most patients with crizotinib resistance, likely owing to its limited blood–brain barrier penetration [14]. These findings highlight the need for highly potent ALK inhibitors with enhanced blood–brain barrier penetration, acceptable tolerability, and the potential to overcome resistance in order to provide further clinical benefit for patients with ALK-activating mutations and rearrangements [15].
Owing to the resistance associated with the first-generation (crizotinib) and second-generation (alectinib and ceritinib) ALK inhibitors, brigatinib was developed to achieve potent activity against a broad range of ALK resistance mutations [16]. In preclinical studies, brigatinib showed higher potency and the capability to overcome mechanisms of resistance associated with crizotinib [16]. In a single-arm, open-label, phase I/II study (NCT01449461) in patients with advanced malignancies, which included a high proportion (58%) of patients with ALK-positive NSCLC, brigatinib demonstrated promising clinical activity and an acceptable safety profile in both crizotinib-treated and ALK inhibitor-naive patients with ALK-positive NSCLC [17]. Among those patients with ALK+ NSCLC, brigatinib daily doses ranged from 60 to 180 mg. The confirmed objective response rate (ORR) was 62 and 100% in crizotinib-pretreated and crizotinib-naive patients, respectively, and the median progression-free survival (PFS) was 13.2 months in crizotinib-pretreated patients and was not reached in crizotinib-naive patients [17]. The favorable data from this phase I/II study supported further clinical development of brigatinib in the randomized, multicenter, phase II ALTA (ALK in Lung Cancer Trial of AP26113) study (NCT02094573) [10]. In ALTA, treatment with brigatinib 180 mg once daily (with a 7-day lead-in at 90 mg once daily) resulted in a confirmed ORR of 57% and a median PFS of 16.7 months [18]. The brigatinib titration dosing regimen (i.e., 180 mg once daily with a 7-day lead-in at 90 mg once daily) was selected as the recommended posology because starting treatment at the lower initial dose mitigated the risk of moderate-to-severe pulmonary adverse events that had been observed in a small subset of patients within the first 7 days after initiation of higher doses of brigatinib, while maintaining the efficacy associated with the 180-mg once-daily dose [17, 19, 20]. The results of ALTA led to the initial accelerated approval of brigatinib in the USA for patients with crizotinib-refractory advanced ALK-positive NSCLC in April 2017 [21]. Subsequently, brigatinib received full approval for first-line use based on favorable data from the pivotal, open-label, randomized phase III ALTA-1L study (NCT02737501) [20]. In ALTA-1L, brigatinib demonstrated superior efficacy against systemic and intracranial disease compared with crizotinib [20]. At the final analysis, with a median follow-up of 40.4 months in the brigatinib arm, brigatinib continued to provide clinically meaningful improvements in efficacy (median PFS: brigatinib, 24 months; crizotinib, 11.1 months; hazard ratio, 0.48; log-rank p < 0.0001) and acceptable tolerability compared with crizotinib [11]. Brigatinib also has demonstrated robust clinical activity in the central nervous system. Among patients treated with 180 mg once daily (7-day lead-in at 90 mg once daily) in ALTA, independent review committee–assessed intracranial response in patients with measurable brain metastases was 67% and median intracranial PFS (iPFS) in patients with baseline brain metastases was 18.4 months. In patients treated with brigatinib in ALTA-1L, the blinded independent review committee–assessed confirmed rate of intracranial ORR (iORR) in patients with measurable baseline brain metastases was 78% and median iPFS in patients with baseline brain metastases was 24.0 months. The safety profile of brigatinib was consistent in ALTA-1L compared with ALTA, with no new safety concerns identified [11, 22].
To support clinical development and dosing recommendations across clinical contexts of use, brigatinib pharmacokinetics was extensively studied in multiple clinical and dedicated clinical pharmacology studies. In addition, integrated population pharmacokinetic (PK), physiologically based pharmacokinetic (PBPK), and exposure–response analyses have been conducted [15, 23–25]. Herein, we provide the first comprehensive review of the clinical pharmacology of brigatinib.
Molecular Structure
The molecular formula of brigatinib is C29H39ClN7O2P and its chemical structure is depicted in Fig. 1 [26]. The chemical structure of brigatinib is constructed around a bisanilinopyrimidine core, containing a C4 aniline with an ortho dimethylphosphine oxide substituent [16]. This phosphine oxide is a unique structural feature of brigatinib, which along with a hydrogen-bond acceptor, provided selective potency and favorable preclinical pharmacokinetic and pharmacodynamic characteristics [26]. The phosphine oxide bond does not undergo redox chemistry like carbonyls and alcohols, and its ability to function as a hydrogen-bond acceptor makes it an important complement to more conventional hydrogen-bond acceptors such as carbonyls and sulfones [26]. Brigatinib binds to the ATP-binding site of ALK [16, 26]. Brigatinib is considered a Biopharmaceutics Classification System class 1 molecule owing to its high permeability and high solubility over the physiological pH range [27, 28].
Fig. 1.
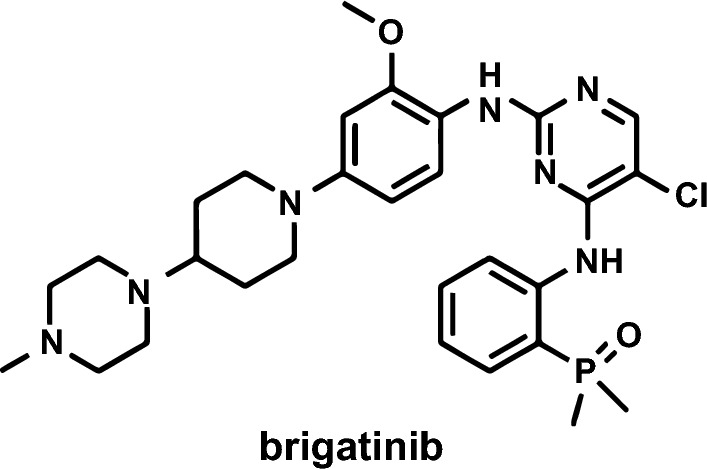
Chemical structure of brigatinib
Mechanism of Action and Pharmacodynamics of Brigatinib
In Vitro Studies
In vitro studies have demonstrated that brigatinib is a potent inhibitor of ALK. In in vitro kinase screening assays, brigatinib inhibited the kinase activity of native ALK with a 50% inhibitory concentration (IC50) of 0.6 nM and the kinase activity of an additional five mutant ALK variants (IC50 values range from 0.6 to 6.6 nM), which included the G1202R mutant that represents the leading ALK secondary mutation that causes resistance to ceritinib and alectinib (Fig. 2) [16, 24, 29]. Brigatinib kinase selectivity was further assessed using a broad in vitro screen against a panel of 289 kinases [16]. Among the 289 kinases that were screened, only 11 (3%) were inhibited with IC50 values < 10 nM, thereby indicating a relatively high degree of selectivity. Specifically, brigatinib potently inhibited ROS1, FLT3, a mutant variant of FLT3 (D835Y), and a mutant variant of EGFR (L858R) with IC50 values of 1.9, 2.1, 1.5, and 1.5 nM, respectively [16]. Brigatinib showed relatively modest activity against native EGFR, an EGFR mutant (L858R/T790M), IGF-1R, and INSR (IC50, 29–160 nM) [16]. Brigatinib did not show any inhibitory activity against MET (IC50 > 1000 nM) [16].
Fig. 2.
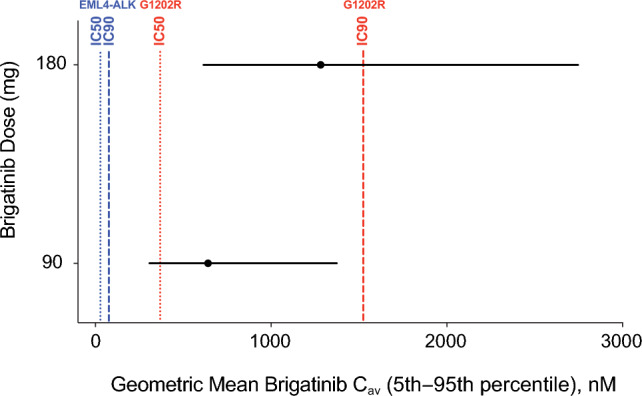
Simulated average drug concentration at steady state (Cav) for brigatinib 90 and 180 mg (black circles and lines) versus 50% inhibitory concentration (IC50) and 90% inhibitory concentration (IC90) values for native EML4-ALK (blue lines) and the G1202R mutant (red lines). In vitro potency estimates were adjusted upward by a factor of two to account for the observed in vitro potency shift in the presence of plasma proteins [24]. Reprinted from Gupta et al. [24] (with permission indicated by the Creative Commons License Deed; CC BY-NC 4.0)
Following the initial kinase screening assays, the activity of brigatinib against native ALK and non-ALK kinases was examined in cellular assays [16]. Consistent with the kinase screening assays, the cellular assays demonstrated that brigatinib is a selective and potent inhibitor of ALK and ROS1, with IC50 values of 14 and 18 nM, respectively [16]. Brigatinib inhibited FLT3, a mutant variant of FLT3 (D835Y), a mutant variant of EGFR (L858R), and IGF-1R with a lower potency (IC50, 148–397 nM) than what was observed in the kinase screening assays and lacked cellular activity against INSR and native EGFR (IC50 > 3000 nM) [16].
The in vitro activity of brigatinib has also been compared with crizotinib using a panel of seven ALK-rearranged ALCL and NSCLC cell lines expressing NPM-ALK or EML4-ALK fusions [16]. In the ALK-positive cell lines tested, the potency of ALK inhibition was 12-fold higher with brigatinib than with crizotinib (IC50, 1.5–12.0 nM and 23–55 nM for brigatinib and crizotinib, respectively) [16]. Furthermore, the concentration of brigatinib that inhibited growth by 50% ranged from 4 to 31 nM [16]. A 100-fold selectivity was observed for ALK-rearranged versus ALK wild-type cell lines with brigatinib [16].
Pharmacokinetics of Brigatinib
The pharmacokinetics of brigatinib has been extensively characterized in both healthy volunteers and patients with cancer [17, 24, 30, 31]. This section summarizes the key absorption, distribution, metabolism, and elimination properties of brigatinib.
Absorption
Dose Linearity and Absolute Bioavailability
Brigatinib is rapidly absorbed following oral administration, with a median time to reach maximum plasma concentration (Tmax) of 2 h post-dose for the 90- and 180-mg once-daily doses [32]. In the phase I/II study, brigatinib demonstrated dose-proportional increases in systemic exposure over the dose range of 60–240 mg once daily [17]. After administration of 180 mg once daily, the geometric mean (% coefficient of variation) maximum observed plasma concentration (Cmax) and area under the plasma concentration–time curve during a dosing interval (AUC0–τ) at steady state were 1452 (60%) ng/mL and 20,276 (62%) ng⋅h/mL, respectively [17].
The absolute bioavailability (F) of brigatinib is unknown as PK data after intravenous administration are not available. However, an estimated F value of 46% can be derived using a previously described method [33] for calculating this parameter based upon renal clearance (CLR) and apparent oral clearance (CL/F) data obtained from healthy volunteers with normal renal function enrolled in the dedicated renal impairment study [34]. Based on the fundamental principles of clearance, CL/F is equal to the sum of CLR divided by F and non-renal clearance (CLNR) divided by F [33]:
Therefore, a linear regression analysis using the CLR and CL/F data from the renal impairment study, in which the dependent variable is CL/F, and the independent variable is CLR takes the form of y = m*x + b, with the slope equal to 1/F and the intercept equal to CLNR/F [33]. The slope of the linear regression line in this analysis was 2.172, thereby resulting in an estimated F value of 0.46 (i.e., 46%) for brigatinib (i.e., 1/2.172; Fig. 3).
Fig. 3.
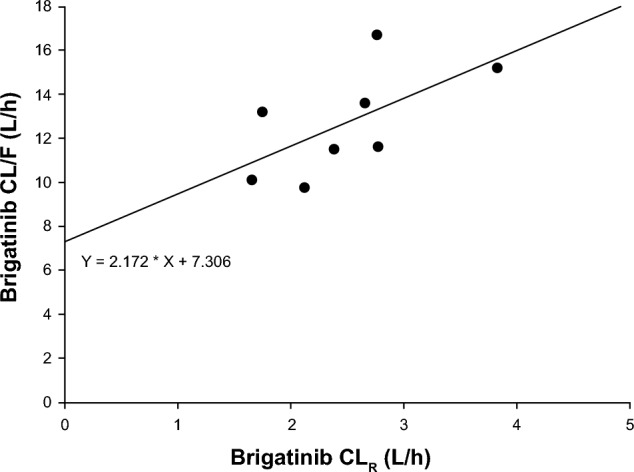
Linear regression plot of apparent oral clearance (CL/F) versus renal clearance (CLR) based on data from healthy volunteers with normal renal function in the dedicated renal impairment study [34]
Food Effect
The effect of a standardized, high-calorie, high-fat meal on the pharmacokinetics of brigatinib was evaluated in a phase I, single-dose, randomized, open-label, two-period, two-sequence, crossover study in healthy volunteers [30]. The two treatment periods were separated by a washout period of at least 16 days between brigatinib doses [30]. During both treatment periods, patients received a single oral dose of brigatinib 180 mg after consumption of a high-fat meal (i.e., fed state; N = 21) or after an overnight fast of at least 10 h (i.e., fasted state; N = 24) [30]. In the fed state, brigatinib Tmax was delayed by approximately 3 h compared with administration in the fasted state (5.0 vs 2.0 h) and the geometric mean Cmax was reduced by approximately 13% in the fed state compared with the fasted state (604.6 vs 701.3 ng/mL; Table 1). However, consumption of a high-fat meal did not have a clinically meaningful effect on the total systemic exposure of brigatinib (geometric mean area under the plasma concentration–time curve [AUC] values of 12,944 and 13,261 ng⋅h/mL in the fed and fasted state, respectively). These findings indicate that brigatinib can be administered with or without food [30].
Table 1.
Plasma pharmacokinetic parameters of brigatinib 180 mg once daily under fasted and fed conditions [30]
| PK parameter | Fasted (N = 21) | Fed (N = 24) | Fed vs fasted, geometric mean ratioa (90% CI) |
|---|---|---|---|
| Cmax, ng/mL | |||
| Mean (SD) | 743.0 (251.9) | 621.9 (145.8) | 0.87 (0.78–0.97) |
| Geometric mean (% CV) | 701.3 (36.6) | 604.6 (25.2) | |
| AUC0–∞, ng⋅h/mL | |||
| Mean (SD) | 13,767 (3599) | 13,354 (3408) | 0.98 (0.89–1.07) |
| Geometric mean (% CV) | 13,261 (29.8) | 12,944 (26.6) | |
| Tmax, h | |||
| Median (minimum–maximum) | 2.00 (1.00–6.00) | 5.00 (2.50–7.00) | – |
| t1/2, h | |||
| Mean (SD) | 31.0 (4.2) | 31.1 (3.9) | – |
AUC0–∞ area under the plasma concentration–time curve from time 0 to infinity, CI confidence interval, Cmax maximum plasma concentration, CV coefficient of variation, PK pharmacokinetic, SD standard deviation, t1/2 terminal elimination half-life, Tmax time to maximum plasma concentration
aGeometric mean ratios reported in this column are based on N = 21
Distribution
Brigatinib is 91% bound to human plasma proteins and binding is not concentration dependent [34].The blood-to-plasma concentration ratio for brigatinib is 0.69, suggesting the lack of preferential binding to red blood cells [35]. The mean apparent volume of distribution of brigatinib was estimated to be 307 L [35].
Brigatinib is a substrate of P-glycoprotein and breast cancer resistance protein in vitro [35]. Although brigatinib is a P-glycoprotein substrate, it is also highly permeable, which should minimize any impact of active efflux at the blood–brain barrier. Brigatinib is not a substrate of organic anion transporting polypeptide (OATP1B1, OATP1B3), organic anion transporter (OAT1, OAT3), organic cation transporter (OCT1, OCT2), multidrug and toxin extrusion protein (MATE1, MATE2K), or bile salt export pump. In vitro studies indicated that brigatinib is an inhibitor of P-glycoprotein, breast cancer resistance protein, OCT1, MATE1, and MATE2K.
Metabolism
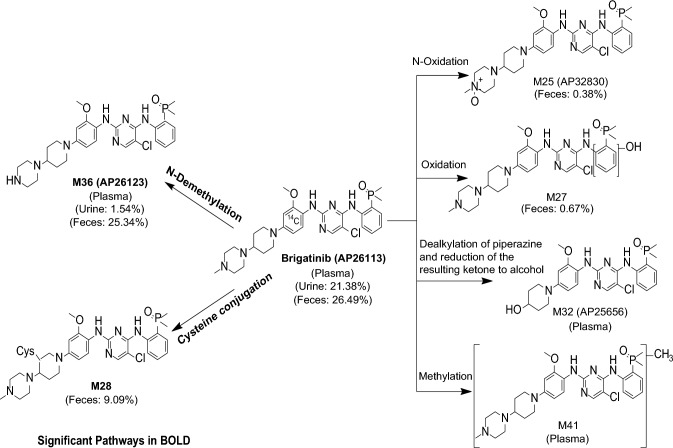
CYP2C8 and CYP3A4 were the primary enzymes involved in the in vitro metabolism of brigatinib [32]. In the human absorption, distribution, metabolism, and excretion study, the major metabolic clearance pathways were N-demethylation and cysteine conjugation (Fig. 4). Following oral administration of a single dose of 180 mg [14C]-brigatinib in healthy volunteers, unchanged brigatinib represented the majority of circulating radioactivity (91.5%) with the primary metabolite AP26123 accounting for 3.5%. In patients with advanced malignancies, systemic exposure of AP26123 was < 10% of brigatinib exposure. In addition, AP26123 inhibits ALK with a four-fold lower potency than brigatinib; thus, this metabolite is not expected to be a meaningful contributor to pharmacological activity [32].
Fig. 4.
In vivo metabolic pathways of brigatinib after administration of a single oral 180-mg dose of [14C]-brigatinib to healthy male volunteers
Elimination
Following oral administration of a single dose of 180 mg [14C]-brigatinib in healthy volunteers, 65% of the administered dose was recovered in the feces (41% as unchanged brigatinib) and 25% of the administered dose was recovered in the urine (86% as unchanged brigatinib) [32]. Thus, brigatinib is eliminated by a mixed contribution of hepatic clearance and renal clearance. Based on the population PK analysis, brigatinib CL/F is 10.6 L/h with an interindividual variability of 48.4% [24]. Taken together with the approximate estimate of oral bioavailability of 46% discussed earlier, the systemic clearance of brigatinib suggests that it is a low extraction ratio drug. After multiple-dose administration of 180 mg once daily, the mean terminal half-life was 25 h and the mean accumulation ratio based on AUC was 2.06 [17].
Intrinsic Factors
Age, Race, Sex, and Body Weight
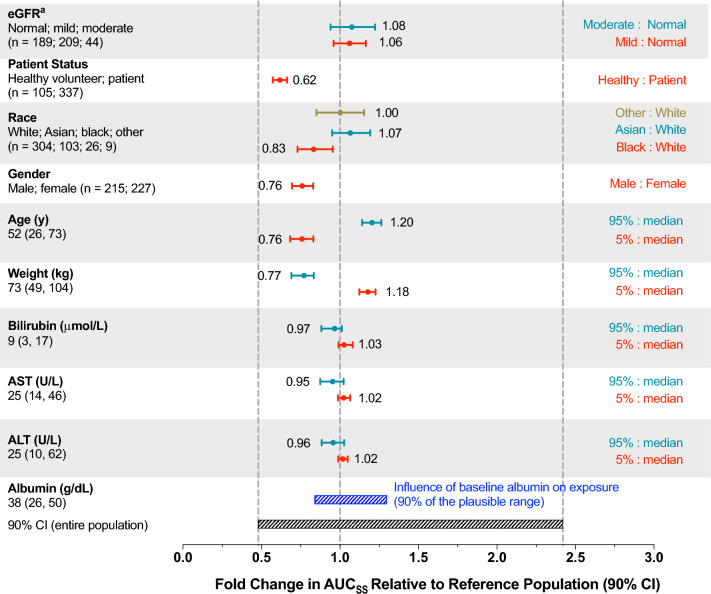
A population PK model for brigatinib was developed using data from 442 individuals enrolled across five clinical studies (i.e., three phase I studies in healthy volunteers, the phase I/II study in patients with advanced malignancies, and the phase II ALTA study in patients with crizotinib-refractory advanced ALK-positive NSCLC) [24]. In this analysis, brigatinib pharmacokinetics was best described by a three-compartment model with a transit compartment for absorption. The final model included albumin as a covariate on brigatinib CL/F. However, inclusion of albumin in the model only explained approximately 5% of the CL/F variability, thereby indicating a lack of a clinically meaningful effect of albumin on systemic exposures of brigatinib. Furthermore, none of the additional covariates evaluated, including age, sex, race, body weight, mild or moderate renal impairment, total bilirubin, aspartate aminotransferase, and alanine aminotransferase, were found to explain variability in brigatinib CL/F to a meaningful extent. The final population PK model was also used to predict steady-state brigatinib systemic exposures (AUC) for individual patients receiving 180 mg once daily using the individual estimated CL/F values and covariates of interest as predictors. As shown in Fig. 5, post-hoc stratification of predicted AUC by each covariate demonstrated that no covariate had a clinically meaningful effect on systemic exposure as the fold changes in brigatinib AUC at the 5th and 95th percentiles of the distributions of each covariate relative to the median covariate value were contained within the 90% confidence interval for the entire population [24]. Taken together, the population PK analysis results indicate that no dose adjustments are required based on these intrinsic factor-related covariates.
Fig. 5.
Predicted brigatinib exposure for the 180-mg dose based on the final population pharmacokinetic model stratified by covariates of interest using data from the phase I/II and phase II ALTA (ALK in Lung Cancer Trial of AP26113) studies. The vertical dashed lines represent the median and 5th and 95th percentiles of predicted area under the plasma concentration–time curve (AUC) in a typical patient with a baseline albumin level of 38 g/dL. For categorical covariates, the ratio of exposure for the category versus the reference category is shown whereas the ratio of exposure for the 95th and 5th percentiles of the covariate versus the medians is shown for continuous covariates. The black shaded bar represents the 5th–95th percentile exposure range across the entire population. The blue shaded bar represents the influence of baseline albumin on exposure. ALT alanine aminotransferase, AST aspartate aminotransferase, AUCSS area under the plasma concentration–time curve at steady state, CI confidence interval, eGFR estimated glomerular filtration rate. aCategories for eGFR: normal, ≥ 90 mL/min/1.73 m2; mild impairment, 60 to < 90 mL/min/1.73 m2; moderate impairment, 30 to < 60 mL/min/1.73 m2 [24]. Adapted or reprinted from Gupta et al. [24]
Renal Function
Renal impairment is known to occur at varying degrees in some patients with ALK-positive NSCLC [36], particularly, among those who have received prior treatments associated with renal toxicity [34]. Renal impairment can alter the pharmacokinetics of drugs, which may lead to an increased risk for toxicities [34, 37]. Patients with mild-to-moderate renal impairment (estimated glomerular filtration rate [eGFR] 30 to < 90 mL/min/1.73 m2) were eligible to enroll in clinical studies as were patients with normal renal function (eGFR ≥ 90 mL/min/1.73 m2) [34]; these studies applied approaches to inclusive development [38–40] and were guided by the knowledge that metabolism is the major clearance mechanism for brigatinib. Accordingly, data were available to characterize the effect of mild-to-moderate renal impairment on brigatinib pharmacokinetics. In the population PK analysis, eGFR was not identified as a significant covariate on brigatinib CL/F, indicating that mild-to-moderate renal impairment had no impact on systemic exposures of brigatinib [24]. Accordingly, no dose adjustment is required for patients with mild or moderate renal impairment.
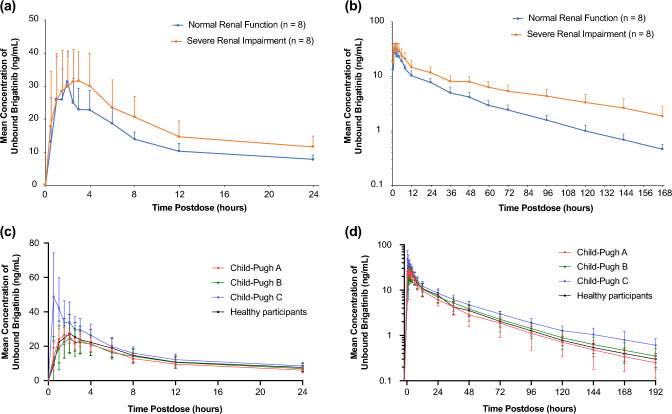
Patients with severe renal impairment, defined as an eGFR < 30 mL/min/1.73 m2, were excluded from clinical trials. Therefore, a dedicated phase I study was conducted in patients with severe renal impairment and matched healthy volunteers with normal renal function to characterize the effect of severe renal impairment on brigatinib pharmacokinetics in order to guide dosing in these patients [34]. Severe renal impairment did not impact the plasma protein binding of brigatinib. Unbound brigatinib AUC from time zero to infinity (AUC0–∞) was 92% higher in patients with severe renal impairment compared with healthy volunteers (Fig. 6a, b). Additionally, renal clearance in patients with severe renal impairment was approximately 20% of that observed in healthy volunteers. Based on the findings of this study, a brigatinib dose reduction of approximately 50% (i.e., from 180 to 90 mg or from 90 to 60 mg) is recommended when administering brigatinib to patients with severe renal impairment [34].
Fig. 6.
Mean (± standard deviation) unbound brigatinib plasma concentration–time profiles from a 0 to 24 h postdose, linear scale and b from 0 to 168 h post-dose, log-linear scale in patients with normal renal function versus severe renal impairment, and c from 0 to 24 h post-dose, linear scale, and d from 0 to 192 h postdose, log-linear scale in patients with normal hepatic function versus chronic hepatic impairment [34, 41, 48]. Figure 5a, b are reprinted from Gupta et al. [34]. Figure 5c, d are adapted from Hanley et al. [48]
Hepatic Impairment
Reduced hepatic function may result in higher systemic exposures as hepatic clearance is the major clearance mechanism for the elimination of brigatinib. As a result, a dedicated phase I study was conducted to evaluate the impact of varying degrees of hepatic impairment, defined using the Child-Pugh criteria, on the pharmacokinetics of brigatinib [41, 42]. The study enrolled six patients with mild hepatic impairment (Child-Pugh A), six patients with moderate hepatic impairment (Child-Pugh B), six patients with severe hepatic impairment (Child-Pugh C), and nine matched healthy volunteers with normal hepatic function. Brigatinib plasma protein binding was comparable across the mild hepatic impairment (mean fraction bound of 88.9%), moderate hepatic impairment (mean fraction bound of 89.2%), and normal hepatic function (mean fraction bound of 91.5%) groups. However, binding was reduced in the severe hepatic impairment group with a mean fraction bound of 76.9%. Accordingly, the mean fraction unbound value in the severe hepatic impairment group (23.1%) was 2.7-fold higher than the unbound value observed in the normal hepatic function group (8.5%). Free plasma brigatinib in the mild hepatic impairment (11.1%) and in the moderate hepatic impairment (10.8%) groups was not meaningfully different from that observed in the normal hepatic function group. While there were no clinically meaningful effects of mild or moderate hepatic impairment on the pharmacokinetics of brigatinib, severe hepatic impairment was associated with increases in unbound systemic exposures of brigatinib. Notably, AUC0–∞ and Cmax were approximately 37% and 65% higher, respectively, in patients with severe hepatic impairment compared with healthy volunteers with normal hepatic function (Fig. 6c, d) [41]. Consequently, the results of this study supported the recommendation of an approximate 40% reduction (i.e., from 180 to 120 mg, from 120 to 90 mg, or from 90 to 60 mg) of the brigatinib dose for patients with severe hepatic impairment.
Drug–Drug Interactions
Data from in vitro phenotyping studies suggested that brigatinib is primarily metabolized by CYP2C8 and CYP3A. Consequently, a phase I, three-arm, drug–drug interaction (DDI) study was conducted to evaluate the effects of multiple-dose coadministration of a strong CYP2C8 inhibitor (gemfibrozil 600 mg twice daily), a strong CYP3A inhibitor (itraconazole 200 mg twice daily), and a strong CYP3A inducer (rifampin 600 mg once daily) on the single-dose pharmacokinetics of brigatinib [31]. Coadministration of gemfibrozil had no clinically relevant effect on total systemic exposures of brigatinib as it reduced brigatinib AUC0–∞ by only 12% (Fig. 7a). This indicates that CYP2C8 is not a meaningful contributor to brigatinib clearance and that no dose adjustment is necessary during coadministration with CYP2C8 inhibitors. In contrast, coadministration of the strong CYP3A inhibitor itraconazole increased brigatinib AUC0–∞ by 101% (Fig. 7b), while the strong CYP3A inducer rifampin reduced brigatinib AUC0–∞ by 80% (Fig. 7c) [31]. These data demonstrate that CYP3A-mediated metabolism is a primary contributor to brigatinib clearance. Moreover, these DDI study results support the recommendation that strong CYP3A inhibitors or inducers should be avoided during treatment with brigatinib. If coadministration of a strong CYP3A inhibitor is unavoidable, the dose of brigatinib should be reduced by approximately 50% (i.e., from 180 to 90 mg, or from 90 to 60 mg).
Fig. 7.
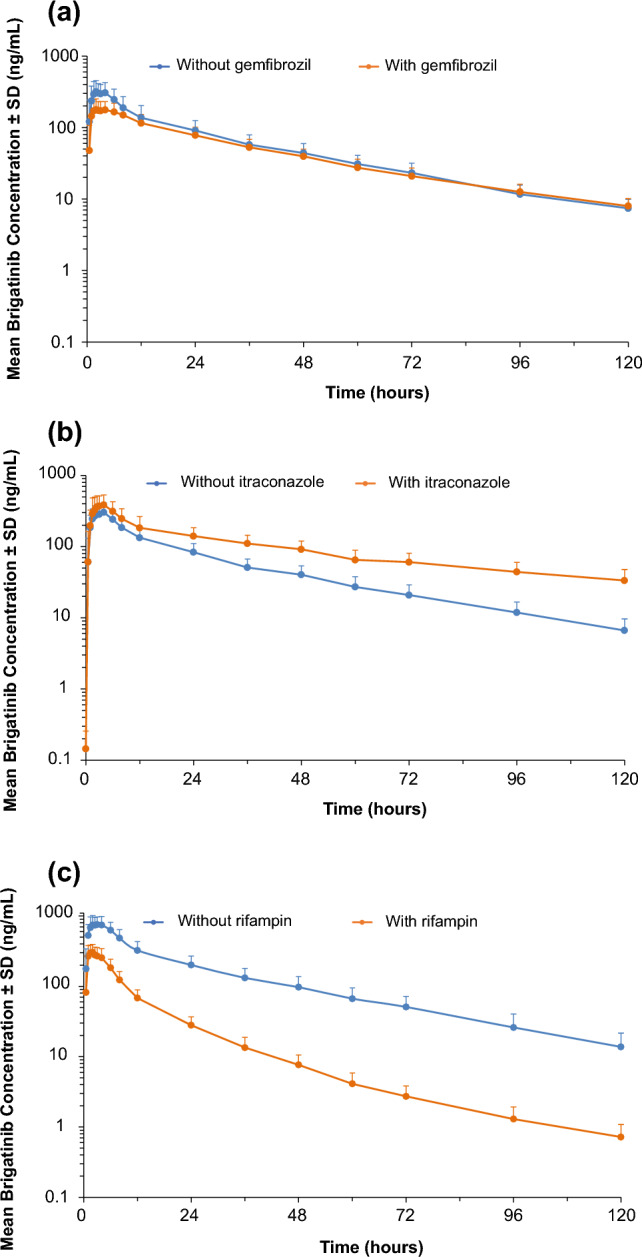
Log-linear plots of mean (± standard deviation [SD]) plasma brigatinib concentration–time profiles with and without coadministration of a the strong cytochrome P450 (CYP) 2C8 inhibitor gemfibrozil, b the strong CYP3A inhibitor itraconazole, and c the strong CYP3A inducer rifampin [31]. Adapted from Tugnait et al. [31]
In lieu of conducting dedicated clinical DDI studies, PBPK modeling was used to inform dosing recommendations for patients requiring coadministration of moderate CYP3A inhibitors or inducers, as is common in oncology drug development [43, 44]. The model was built based on the results of the mass balance study and verified to predict the results of clinical DDI studies with the strong inhibitor itraconazole and the strong inducer rifampin, aligned with best practices for developing high-fidelity PBPK models [45–47]. Model-based simulations predicted an approximate 40% increase in brigatinib AUC in the presence of a moderate CYP3A inhibitor, and an approximate 50% decrease in the AUC of brigatinib during coadministration with a moderate CYP3A inducer [15]. These PBPK analysis results informed dosing recommendations for patients requiring concomitant treatment with moderate CYP3A inhibitors or inducers. Specifically, if coadministration with a moderate CYP3A inhibitor cannot be avoided, the brigatinib dose should be reduced by approximately 40% (i.e., from 180 to 120 mg, from 120 to 90 mg, or from 90 to 60 mg). If coadministration with a moderate CYP3A inducer is unavoidable, the brigatinib dose may be increased in 30-mg increments (after 7 days of treatment with the current brigatinib dose as tolerated) up to a maximum of twice the brigatinib dose that was tolerated before starting the moderate CYP3A inducer [35].
At clinically relevant concentrations, brigatinib did not inhibit CYP1A2, CYP2B6, CYP2C8, CYP2C9, CYP2C19, or CYP2D6 in vitro. However, in vitro studies using human hepatocytes indicated the potential for CYP3A induction. Thus, a phase I DDI study was conducted in patients with ALK-positive or ROS1-positive solid tumors to characterize the effect of multiple-dose administration of brigatinib 180 mg once daily on the single-dose pharmacokinetics of the sensitive CYP3A probe substrate, midazolam (3-mg oral solution dose) [48]. Results from this clinical DDI study demonstrated that brigatinib is a weak inducer of CYP3A in vivo as oral midazolam AUC0–∞ was reduced by approximately 26% in the presence of brigatinib (geometric least-squares mean ratio [90% confidence interval] of 0.741 [0.600–0.915]). Consequently, there is a limited potential for clinically meaningful DDIs when brigatinib is coadministered with CYP3A substrates [48].
Exposure–Response Analyses
Concentration–Corrected QT Relationship
Relationships between brigatinib plasma concentrations and the change from baseline in the QT interval corrected using Fridericia’s formula, PR interval, and heart rate were modeled using PK time-matched triplicate electrocardiogram data collected in the phase I/II study. This PK/pharmacodynamic model-based analysis of electrocardiogram data from phase I/II clinical studies was conducted as an alternative to a dedicated corrected QT study, and this approach has also been successfully undertaken previously [43, 49, 50]. In this analysis, the model predicted an increase of 0.134 ms (95% confidence interval − 1.94 to 2.19) in the QT interval corrected using Fridericia’s formula at the steady-state Cmax for brigatinib after 180 mg once-daily administration [23]. The corresponding values based on the final PR interval and heart rate models were an increase of 9.36 ms (95% CI 7.64–11.1) and a decrease of 3.86 beats per minute (95% CI 1.48–6.27), respectively (Fig. 8) [23]. The increases in QT interval corrected using Fridericia’s formula and the PR interval were not considered clinically meaningful. The observed decrease in heart rate was not unexpected, as bradycardia is a class effect among ALK inhibitors, including brigatinib.
Fig. 8.
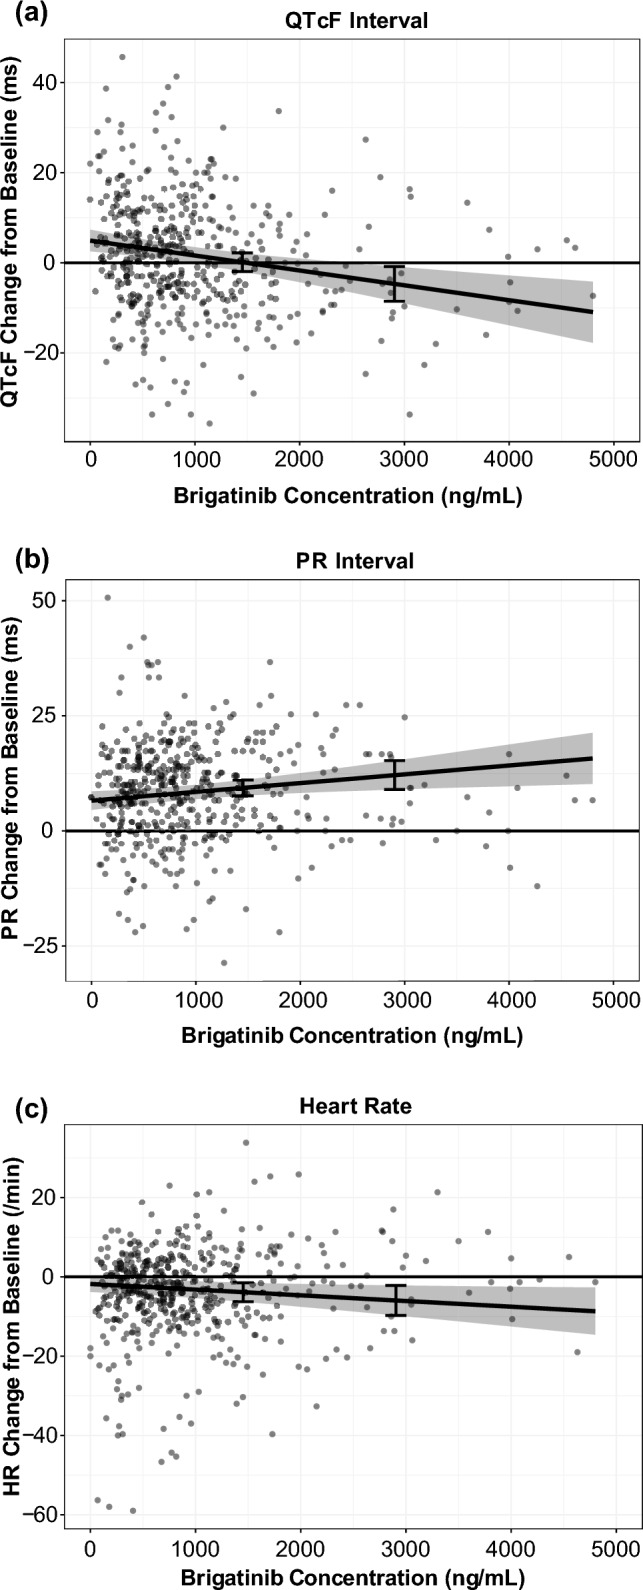
Scatterplots of a the QT interval corrected using Fridericia’s formula (QTcF) [23], b the PR interval, and c heart rate (HR) responses versus brigatinib concentrations with model-predicted typical responses and a 90% confidence interval. Dots represent brigatinib concentrations, and in each graph, the line and gray area represent the model-predicted typical responses and 90% confidence intervals. Error bars show the response at 1452 ng/mL (i.e., geometric mean steady-state maximum plasma concentration at 180 mg once daily) and 2904 ng/mL (i.e., maximum plasma concentration for patients with impaired elimination, corresponding to twice the geometric mean steady-state maximum plasma concentration). Adapted from Gupta et al. [23]
Phase I/II and Phase II ALTA Studies
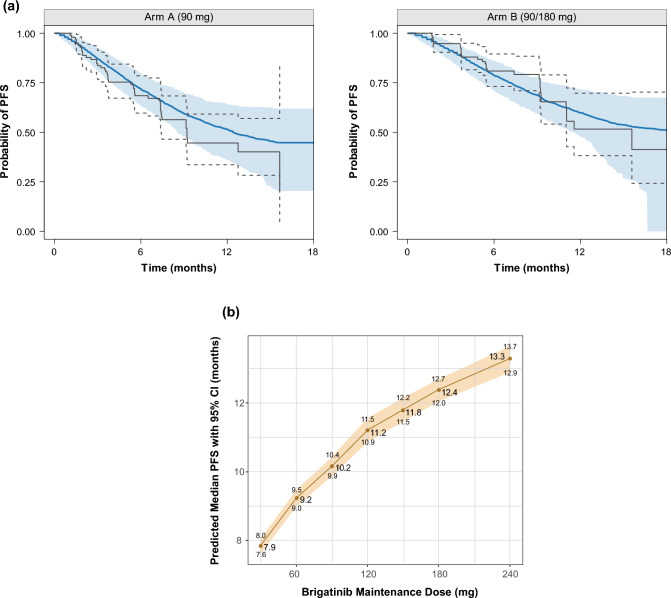
Exposure–response analyses were conducted using data from 279 patients with ALK-positive NSCLC from the phase I/II and phase II ALTA studies who had received brigatinib and had at least one post-baseline tumor scan. The outcomes assessed in relation to brigatinib exposure estimates were PFS, iPFS, overall survival, confirmed ORR, and iORR [23]. Use of a static exposure metric (i.e., time-averaged brigatinib exposure) in the exposure–response analyses did not permit the estimation of an exposure–efficacy relationship for PFS that could explain the dose–PFS relationship observed in the ALTA study (i.e., longer PFS observed in the 180-mg once-daily arm after a 7-day lead-in at the 90-mg once-daily arm vs the 90 mg once-daily continuous arm) [23]. A parametric time-to-event survival model was therefore developed to describe the probability of PFS as a function of time and other potential or known risk factors using daily time-varying AUC values. Brigatinib exposure and baseline tumor burden were both significant predictors of PFS in the models for PFS and overall survival [23]. The model-predicted values (95% CI) for the brigatinib 90- and 180-mg once-daily doses were 10.2 (9.9–10.4) and 12.4 (12.0–12.7) months for PFS (Fig. 9), 12.7 (12.4–13.1) and 15.7 (15.3–16.2) months for iPFS, and 9.3 (8.8–9.7) and 11.7 (11.2–12.1) months for overall survival (80%) [23, 51–54]. In the safety exposure–response analysis, increases in grade ≥ 2 rash and grade ≥ 2 amylase were the only events that showed a higher probability of occurrence with increasing brigatinib exposure. Both events were predicted to increase with dose and did not exceed 10% at the recommended clinical dose (Fig. 10) [23].
Fig. 9.
Parametric time-to-event final model for progression-free survival (PFS): a visual predictive check of the final model by the ALTA (ALK in Lung Cancer Trial of AP26113) treatment arm, and b median PFS under different brigatinib dosing regimens (N = 10,000 simulated patients) [23]. In panel a, the blue shaded area represents the spread (5th–95th percentiles) of the simulated Kaplan–Meier curve based on the 500 simulated replicates from the final model; the blue solid line represents the median of the values of the simulated Kaplan–Meier curves. The gray solid lines represent the actual Kaplan–Meier curves, with the gray dashed lines representing the corresponding 95% confidence interval (CI). The visual predictive check evaluated the model by taking the individual survival function values, , at the time () of all events and predicting PFS status for each patient by timepoint based on the final model estimates and each patient’s daily exposure [51]. A survival time () for patient was generated by the inverse cumulative distribution function method [52–54]. Survival times were randomly simulated based on survival probabilities on a grid of timepoints using the algorithm of Rich et al. [54]. In panel b, the red line represents the median survival with the tan shaded area representing the 95% CI for the median PFS. Adapted from Gupta et al. [23]
Fig. 10.
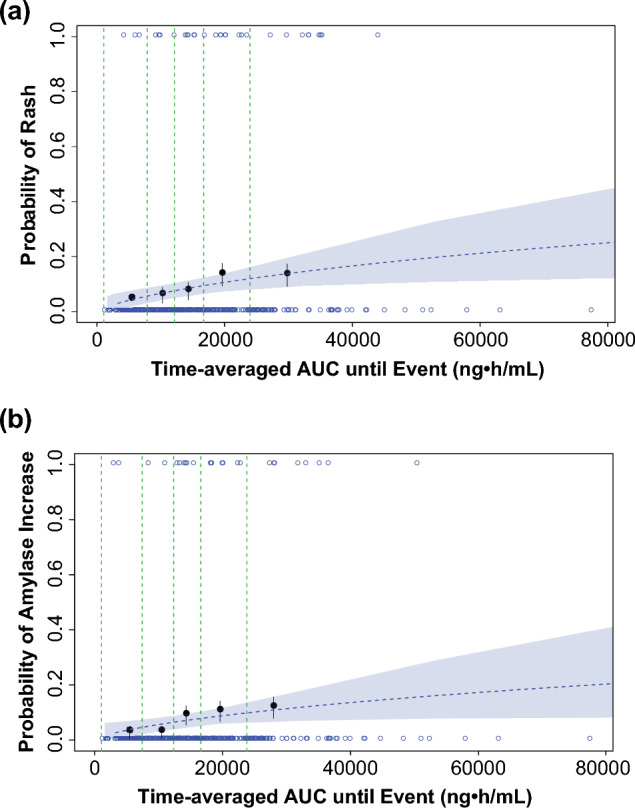
Visual predictive check of a logistic regression model for a grade ≥ 2 rash and b grade ≥ 2 amylase increase based on time-averaged brigatinib exposure. Open blue circles reflect the observed events. The filled black symbols are the observed probability of an event, and the error bars are standard error [sqrt (P*(1 − P)/N)] for quantiles at (100 × 1/5th) percentiles (vertical dotted lines) of exposures (plotted at the median value within each quantile). The blue dashed lines are the predicted probabilities based on the final models. The blue shaded areas represent the 95% confidence band based on 1000 bootstrap samples [23]. AUC area under the plasma concentration–time curve. Adapted from Gupta et al. [23]
The recommended clinical dose range (90–180 mg once daily) of brigatinib is associated with concentrations that are higher than in vitro estimates of the drug concentrations producing 50 and 90% inhibition of native EML4-ALK and mutants associated with resistance to other ALK inhibitors (e.g., G1202R) [23]. Simulations from the population PK model showed that approximately 95% of patients receiving brigatinib 180 mg once daily would achieve trough concentrations more than eight-fold higher than the concentration of brigatinib producing 50 and 90% inhibition for native EML4-ALK. Moreover, the fifth percentile of average concentrations at 180 mg once daily was 1.7-fold higher compared with the adjusted concentration of brigatinib producing 50% inhibition for the G1202R mutant [23]. Overall, these data provided support for the 180 mg once-daily dose as the recommended dose.
Phase III ALTA-1L Study
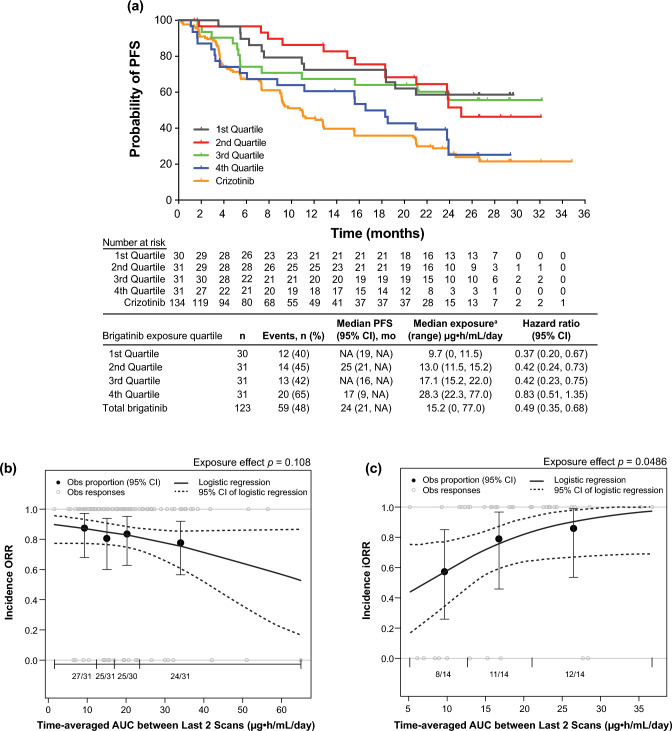
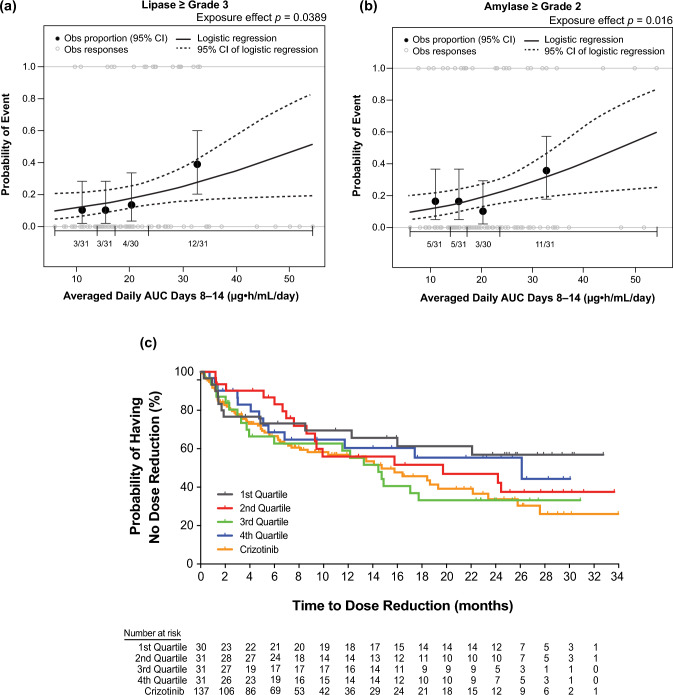
We conducted exposure–response analyses using data from 123 patients with ALK-positive NSCLC from the phase III ALTA-1L study who received first-line brigatinib 180 mg once daily after a 7-day lead-in at 90 mg once daily (Fig. 11) [25]. Relationships between static (time-independent) and dynamic (time-varying) exposure metrics and efficacy (PFS, ORR, and iORR) and safety outcomes (selected grade ≥ 2 and grade ≥ 3 adverse events) were evaluated using logistic regression and time-to-event analyses [25]. These analyses showed no significant effect of time-varying brigatinib exposure on PFS [25]. Brigatinib exposure was not significantly related to ORR, but higher exposure was associated with higher iORR (odds ratio: 1.13, 95% confidence interval 1.01–1.28, p = 0.049) [25]. Across the observed median exposure (5th–95th percentile) at steady state for 180 mg once daily, the predicted probability of iORR was 0.83 (0.58–0.99) [25]. Elevated lipase (grade ≥ 3) and amylase (grade ≥ 2) were significantly associated with higher exposure [25]. The time to first brigatinib dose reduction was not related to exposure [25]. These results supported the favorable benefit-risk profile of first-line brigatinib 180 mg once daily (after a 7-day lead-in at 90 mg once daily) in patients with ALK+ NSCLC (Fig. 12) [25].
Fig. 11.
Exposure–efficacy analyses. a Kaplan–Meier probability of progression-free survival (PFS) by simulated brigatinib exposure quartiles. To evaluate the relationship between brigatinib exposure and PFS, a static exposure metric of time‐averaged area under the plasma concentration–time curve (AUC) between the last two disease assessment scans preceding progression or censoring was used. Progression-free survival Kaplan–Meier estimates plotted by exposure quartiles suggested that patients with higher exposure had a faster onset and a higher incidence of disease progression than those with lower exposure. Values for the crizotinib arm of the study are superimposed; however, no exposure values were available for crizotinib. For median PFS values, NA indicates that the probability of having no disease progression or death has not yet gone beyond 0.50 and hence the median survival time cannot be determined. aSimulated exposure metric is time‐averaged AUC between the last two disease assessment scans preceding progression for PFS or censoring. Observed (Obs) incidence and model‐predicted probability of b objective response rate (ORR) and c intracranial objective response rate (iORR) as a function of brigatinib exposure. The relationships between ORR and iORR and brigatinib exposure were analyzed using the static exposure metric of time‐averaged AUC between the last two disease assessment scans preceding best confirmed response. The probability of response was plotted against predicted exposure values, and probabilities were calculated by observed exposure quartiles or tertiles. Exposure–clinical response relationships were characterized by logistic regression models, which did not show a significant relationship between the probability of achieving ORR and time‐averaged brigatinib AUC between the last two disease assessment scans preceding the best confirmed objective response. In contrast, time‐averaged brigatinib AUC between the last two disease assessment scans preceding best confirmed intracranial response was a statistically significant predictor of iORR in patients with brain metastases at baseline. Dotted curves represent the 95% confidence interval (CI) of the logistic regression model prediction. The horizontal black line separated by vertical black solid lines denotes the brigatinib exposure range in each quartile (ORR) and tertile (iORR). Black dots (vertical lines) represent the observed proportion of patients (95% CI) in each quartile (ORR) and tertile (iORR). n/N is the number of patients with events/total number of patients in each quartile (ORR) and tertile (iORR). Gray open circles represent observed individual data [25]. NA not available. Reprinted from Gupta et al. [25]
Fig. 12.
Exposure–safety analyses. Observed (Obs) incidence and predicted probability of a grade ≥ 3 lipase increase and b grade ≥ 2 amylase increase as a function of brigatinib exposure. The relationship between time‐averaged area under the plasma concentration–time curve (AUC) across days 8–14 of cycle 1 and adverse event probability was examined using logistic regression models. The analysis demonstrated a statistically significant relationship between exposure and grade ≥ 3 lipase increase and grade ≥ 2 amylase increase. c Kaplan–Meier estimates for the time to first brigatinib dose reduction stratified by time‐averaged AUC quartiles. To explore the relationship between brigatinib exposure and dose reductions, Kaplan–Meier plots of the time to first brigatinib dose reduction were generated for brigatinib exposure (time‐averaged AUC to the first occurrence of a dose reduction) quartiles. No discernible effect of brigatinib exposure on the time to first brigatinib dose reduction was noted. Values for the crizotinib arm of the study are superimposed; however, no exposure values were available for crizotinib. Dotted curves represent the 95% confidence interval (CI) of the logistic regression model prediction. The horizontal black line separated by vertical black solid lines denotes the brigatinib exposure range in each quartile. Black dots (vertical lines) represent the observed proportion of patients (95% CI) in each quartile. n/N is the number of patients with events/total number of patients in each quartile. Gray open circles represent observed individual data [25]. Reprinted from Gupta et al. [25]
Conclusions
The pharmacokinetics of brigatinib and its relationship to clinical outcomes have been comprehensively evaluated in multiple clinical trials as well as model-based analyses using population PK, PBPK, and exposure–response models [15, 23–25]. The findings from these studies have played a key role in establishing the recommended dose of brigatinib, as well as applicable dose adjustments to support brigatinib administration across clinical contexts of use. Phase I studies and population PK analyses have identified the appropriate posology for patients with organ impairment. Phase I studies in healthy volunteers have also helped determine the impact of a high-fat meal on the pharmacokinetics of brigatinib and guide dosing recommendations for brigatinib during concomitant administration with strong CYP3A inhibitors or inducers [30, 31]. A PBPK analysis informed dose reduction recommendations for patients requiring treatment with moderate CYP3A inhibitors or inducers, in lieu of a clinical study [15]. In fact, brigatinib represents a unique example of PBPK model-informed dosing recommendations including a higher dose during coadministration with moderate CYP3A inducers in product labeling [35]. The evaluation of food effects and DDIs, as well as the effects of renal and hepatic impairment on brigatinib pharmacokinetics, formed an important component of the product labeling of brigatinib, and thereby serve as valuable guidance for clinicians with respect to appropriate dosing and administration practices across clinical contexts of use [30, 34]. Of note, the development plan for brigatinib included a randomized evaluation of the safety and efficacy of two doses, enabling a robust characterization of exposure–response relationships for time-to-event endpoints such as PFS and OS. Viewed from a broader perspective, this aspect of the development of brigatinib is exemplary of the current emerging recommendations for prospective dose optimization under the US Food and Drug Administration’s Project Optimus [55, 56]. Taken together with the safety and tolerability profile and associated exposure–response relationships, these exposure–response analyses of efficacy support the favorable benefit-risk profile of the approved posology of 180 mg once daily (after a 7-day lead-in at 90 mg once daily) in a titration dosing regimen.
Acknowledgements
Medical writing support for the development of this article, under the direction of the authors, was provided by Lauren Gallagher, RPh, PhD, of Peloton Advantage, LLC, an OPEN Health company, Parsippany, NJ, USA, and funded by Takeda Development Center Americas, Inc., Lexington, MA, USA, and complied with the Good Publications Practice guidelines (DeTora LM, et al. Ann Intern Med. 2022;175:1298–304).
Declarations
Funding
Professional medical writing assistance was funded by Takeda Development Center Americas, Inc., Lexington, MA, USA.
Conflict of interest
Neeraj Gupta, Michael J. Hanley, Robert Griffin, and Pingkuan Zhang are employed with Takeda. Karthik Venkatakrishnan is employed with EMD Serono Research and Development Institute, Inc. and was employed with Takeda during the conduct of the research reviewed in this article. Vikram Sinha is employed with Novartis Development Corporation and was employed with Takeda during article development.
Ethics approval
Ethics approval was not required for this review.
Consent to participate
Not applicable.
Consent for publication
Not applicable.
Availability of data and material
Not applicable.
Code availability
Not applicable.
Author contributions
NG: conceived the article concept; drafted, critically revised, and approved the manuscript. MJH: performed the data analysis; drafted, critically revised, and approved the manuscript. RG: provided nonclinical absorption, distribution, metabolism, and excretion/drug–drug interaction data, helped author the related sections, and reviewed and approved the manuscript. PZ: critically revised and approved the manuscript. KV: critically revised and approved the manuscript. VS: critically reviewed and approved the manuscript.
References
- 1.Gainor JF, Varghese AM, Ou SH, Kabraji S, Awad MM, Katayama R, et al. ALK rearrangements are mutually exclusive with mutations in EGFR or KRAS: an analysis of 1,683 patients with non-small cell lung cancer. Clin Cancer Res. 2013;19:4273–4281. doi: 10.1158/1078-0432.Ccr-13-0318. [DOI] [PMC free article] [PubMed] [Google Scholar]
- 2.Wong DW, Leung EL, So KK, Tam IY, Sihoe AD, Cheng LC, et al. The EML4-ALK fusion gene is involved in various histologic types of lung cancers from nonsmokers with wild-type EGFR and KRAS. Cancer. 2009;115:1723–1733. doi: 10.1002/cncr.24181. [DOI] [PubMed] [Google Scholar]
- 3.Koivunen JP, Mermel C, Zejnullahu K, Murphy C, Lifshits E, Holmes AJ, et al. EML4-ALK fusion gene and efficacy of an ALK kinase inhibitor in lung cancer. Clin Cancer Res. 2008;14:4275–4283. doi: 10.1158/1078-0432.Ccr-08-0168. [DOI] [PMC free article] [PubMed] [Google Scholar]
- 4.Mossé YP, Wood A, Maris JM. Inhibition of ALK signaling for cancer therapy. Clin Cancer Res. 2009;15:5609–5614. doi: 10.1158/1078-0432.ccr-08-2762. [DOI] [PubMed] [Google Scholar]
- 5.Soda M, Choi YL, Enomoto M, Takada S, Yamashita Y, Ishikawa S, et al. Identification of the transforming EML4-ALK fusion gene in non-small-cell lung cancer. Nature. 2007;448:561–566. doi: 10.1038/nature05945. [DOI] [PubMed] [Google Scholar]
- 6.Shaw AT, Kim DW, Nakagawa K, Seto T, Crino L, Ahn MJ, et al. Crizotinib versus chemotherapy in advanced ALK-positive lung cancer. N Engl J Med. 2013;368:2385–2394. doi: 10.1056/NEJMoa1214886. [DOI] [PubMed] [Google Scholar]
- 7.Shaw AT, Kim DW, Mehra R, Tan DS, Felip E, Chow LQ, et al. Ceritinib in ALK-rearranged non-small-cell lung cancer. N Engl J Med. 2014;370:1189–1197. doi: 10.1056/NEJMoa1311107. [DOI] [PMC free article] [PubMed] [Google Scholar]
- 8.Soria JC, Tan DS, Chiari R, Wu YL, Paz-Ares L, Wolf J, et al. First-line ceritinib versus platinum-based chemotherapy in advanced ALK-rearranged non-small-cell lung cancer (ASCEND-4): a randomised, open-label, phase 3 study. Lancet. 2017;389:917–929. doi: 10.1016/s0140-6736(17)30123-x. [DOI] [PubMed] [Google Scholar]
- 9.Mok T, Camidge DR, Gadgeel SM, Rosell R, Dziadziuszko R, Kim DW, et al. Updated overall survival and final progression-free survival data for patients with treatment-naive advanced ALK-positive non-small-cell lung cancer in the ALEX study. Ann Oncol. 2020;31:1056–1064. doi: 10.1016/j.annonc.2020.04.478. [DOI] [PubMed] [Google Scholar]
- 10.Kim DW, Tiseo M, Ahn MJ, Reckamp KL, Holmskov Hansen K, Kim SW, et al. Brigatinib in patients with crizotinib-refractory anaplastic lymphoma kinase-positive non-small-cell lung cancer: a randomized, multicenter phase II trial. J Clin Oncol. 2017;35:2490–2498. doi: 10.1200/JCO.2016.71.5904. [DOI] [PubMed] [Google Scholar]
- 11.Camidge DR, Kim HR, Ahn M-J, Yang JCH, Han J-Y, Hochmair MJ, et al. Brigatinib versus crizotinib in ALK inhibitor-naive advanced ALK-positive NSCLC: final results of phase 3 ALTA-1L trial. J Thorac Oncol. 2021;16:2091–2108. doi: 10.1016/j.jtho.2021.07.035. [DOI] [PubMed] [Google Scholar]
- 12.Solomon BJ, Besse B, Bauer TM, Felip E, Soo RA, Camidge DR, et al. Lorlatinib in patients with ALK-positive non-small-cell lung cancer: results from a global phase 2 study. Lancet Oncol. 2018;19:1654–1667. doi: 10.1016/s1470-2045(18)30649-1. [DOI] [PubMed] [Google Scholar]
- 13.Shaw AT, Bauer TM, de Marinis F, Felip E, Goto Y, Liu G, et al. First-line lorlatinib or crizotinib in advanced ALK-positive lung cancer. N Engl J Med. 2020;383:2018–2029. doi: 10.1056/NEJMoa2027187. [DOI] [PubMed] [Google Scholar]
- 14.Pan Y, Deng C, Qiu Z, Cao C, Wu F. The resistance mechanisms and treatment strategies for ALK-rearranged non-small cell lung cancer. Front Oncol. 2021;11:713530. doi: 10.3389/fonc.2021.713530.15. [DOI] [PMC free article] [PubMed] [Google Scholar]
- 15.European Medicines Agency. Assessment report: alunbrig [procedure no. EMEA/H/C/004248/0000]. September 20, 2018. Available from: https://www.ema.europa.eu/. Accessed 7 Jul 2023.
- 16.Zhang S, Anjum R, Squillace R, Nadworny S, Zhou T, Keats J, et al. The potent ALK inhibitor brigatinib (AP26113) overcomes mechanisms of resistance to first- and second-generation ALK inhibitors in preclinical models. Clin Cancer Res. 2016;22:5527–5538. doi: 10.1158/1078-0432.CCR-16-0569. [DOI] [PubMed] [Google Scholar]
- 17.Gettinger SN, Bazhenova LA, Langer CJ, Salgia R, Gold KA, Rosell R, et al. Activity and safety of brigatinib in ALK-rearranged non-small-cell lung cancer and other malignancies: a single-arm, open-label, phase 1/2 trial. Lancet Oncol. 2016;17:1683–1696. doi: 10.1016/S1470-2045(16)30392-8. [DOI] [PubMed] [Google Scholar]
- 18.Gettinger SN, Huber RM, Kim D, Bazhenova L, Hansen KH, Tiseo M, et al. Long-term efficacy and safety of brigatinib in crizotinib-refractory ALK+ non–small cell lung cancer: final results of the phase 1/2 and randomized phase 2 (ALTA) trials. JTO Clin Res Rep. 2022;3:100385. doi: 10.1016/j.jtocrr.2022.100385. [DOI] [PMC free article] [PubMed] [Google Scholar]
- 19.Ng TL, Narasimhan N, Gupta N, Venkatakrishnan K, Kerstein D, Camidge DR. Early-onset pulmonary events associated with brigatinib use in advanced NSCLC. J Thorac Oncol. 2020;15:1190–1199. doi: 10.1016/j.jtho.2020.02.011. [DOI] [PubMed] [Google Scholar]
- 20.Camidge DR, Kim HR, Ahn MJ, Yang JCH, Han JY, Lee JS, et al. Brigatinib versus crizotinib in ALK-positive non-small-cell lung cancer. N Engl J Med. 2018;379:2027–2039. doi: 10.1056/NEJMoa1810171. [DOI] [PubMed] [Google Scholar]
- 21.Markham A. Brigatinib: first global approval. Drugs. 2017;77:1131–1135. doi: 10.1007/s40265-017-0776-3. [DOI] [PubMed] [Google Scholar]
- 22.Huber RM, Hansen KH, Paz Ares Rodríguez L, West HL, Reckamp KL, Leighl NB, et al. Brigatinib in crizotinib-refractory ALK+ NSCLC: 2-year follow-up on systemic and intracranial outcomes in the phase 2 ALTA trial. J Thorac Oncol. 2020;15:404–415. doi: 10.1016/j.jtho.2019.11.004. [DOI] [PubMed] [Google Scholar]
- 23.Gupta N, Wang X, Offman E, Rich B, Kerstein D, Hanley M, et al. Brigatinib dose rationale in anaplastic lymphoma kinase-positive non-small cell lung cancer: exposure-response analyses of pivotal ALTA study [Corrigendum in CPT Pharmacometrics Syst Pharmacol. 2021;10:1119–1122] CPT Pharmacometr Syst Pharmacol. 2020;9:718–730. doi: 10.1002/psp4.12569. [DOI] [PMC free article] [PubMed] [Google Scholar]
- 24.Gupta N, Wang X, Offman E, Prohn M, Narasimhan N, Kerstein D, et al. Population pharmacokinetics of brigatinib in healthy volunteers and patients with cancer. Clin Pharmacokinet. 2021;60:235–247. doi: 10.1007/s40262-020-00929-4. [DOI] [PMC free article] [PubMed] [Google Scholar]
- 25.Gupta N, Reckamp KL, Camidge DR, Kleijn HJ, Ouerdani A, Bellanti F, et al. Population pharmacokinetic and exposure-response analyses from ALTA-1L: model-based analyses supporting the brigatinib dose in ALK-positive NSCLC. Clin Transl Sci. 2022;15:1143–1154. doi: 10.1111/cts.13231. [DOI] [PMC free article] [PubMed] [Google Scholar]
- 26.Huang WS, Liu S, Zou D, Thomas M, Wang Y, Zhou T, et al. Discovery of brigatinib (AP26113), a phosphine oxide-containing, potent, orally active inhibitor of anaplastic lymphoma kinase. J Med Chem. 2016;59:4948–4964. doi: 10.1021/acs.jmedchem.6b00306. [DOI] [PubMed] [Google Scholar]
- 27.208772orig1s000 chemistry reviews. Alunbrig. 2017. Available from: https://www.accessdata.fda.gov/drugsatfda_docs/nda/2017/208772Orig1s000ChemR.pdf. Accessed 25 Aug 2022.
- 28.Zhao D, Chen J, Chu M, Long X, Wang J. Pharmacokinetic-based drug-drug interactions with anaplastic lymphoma kinase inhibitors: a review. Drug Des Devel Ther. 2020;14:1663–1681. doi: 10.2147/DDDT.S249098. [DOI] [PMC free article] [PubMed] [Google Scholar]
- 29.Gainor JF, Dardaei L, Yoda S, Friboulet L, Leshchiner I, Katayama R, et al. Molecular mechanisms of resistance to first- and second-generation ALK inhibitors in ALK-rearranged lung cancer. Cancer Discov. 2016;6:1118–1133. doi: 10.1158/2159-8290.CD-16-0596. [DOI] [PMC free article] [PubMed] [Google Scholar]
- 30.Tugnait M, Gupta N, Hanley MJ, Venkatakrishnan K, Sonnichsen D, Kerstein D, et al. The effect of a high-fat meal on the pharmacokinetics of brigatinib, an oral anaplastic lymphoma kinase inhibitor, in healthy volunteers. Clin Pharmacol Drug Dev. 2019;8:734–741. doi: 10.1002/cpdd.641. [DOI] [PMC free article] [PubMed] [Google Scholar]
- 31.Tugnait M, Gupta N, Hanley MJ, Sonnichsen D, Kerstein D, Dorer DJ, et al. Effects of strong CYP2C8 or CYP3A inhibition and CYP3A induction on the pharmacokinetics of brigatinib, an oral anaplastic lymphoma kinase inhibitor, in healthy volunteers. Clin Pharmacol Drug Dev. 2020;9:214–223. doi: 10.1002/cpdd.723. [DOI] [PMC free article] [PubMed] [Google Scholar]
- 32.Center for Drug Evaluation and Research. NDA 208772 multidisciplinary review and evaluation: Alunbrig (brigatinib). 2017. Available from: https://www.accessdata.fda.gov/drugsatfda_docs/nda/2017/208772Orig1s000MultidisciplineR.pdf. Accessed 14 Nov 2017.
- 33.Hinderling PH, Shi J. Absolute bioavailability estimated from oral data. J Pharm Sci. 1995;84:385–386. doi: 10.1002/jps.2600840323. [DOI] [PubMed] [Google Scholar]
- 34.Gupta N, Hanley MJ, Kerstein D, Tugnait M, Narasimhan N, Marbury TC, et al. Effect of severe renal impairment on the pharmacokinetics of brigatinib. Invest New Drugs. 2021;39:1306–1314. doi: 10.1007/s10637-021-01095-5. [DOI] [PMC free article] [PubMed] [Google Scholar]
- 35.Alunbrig [package insert]. Lexington: Takeda Pharmaceuticals America, Inc.; 2022.
- 36.Leduc C, Antoni D, Charloux A, Falcoz PE, Quoix E. Comorbidities in the management of patients with lung cancer. Eur Respir J. 2017;49:1601721. doi: 10.1183/13993003.01721-2016. [DOI] [PubMed] [Google Scholar]
- 37.Zhang Y, Zhang L, Abraham S, Apparaju S, Wu TC, Strong JM, et al. Assessment of the impact of renal impairment on systemic exposure of new molecular entities: evaluation of recent new drug applications. Clin Pharmacol Ther. 2009;85:305–311. doi: 10.1038/clpt.2008.208. [DOI] [PubMed] [Google Scholar]
- 38.Suri A, Chapel S, Lu C, Venkatakrishnan K. Physiologically based and population PK modeling in optimizing drug development: a predict-learn-confirm analysis. Clin Pharmacol Ther. 2015;98:336–344. doi: 10.1002/cpt.155. [DOI] [PMC free article] [PubMed] [Google Scholar]
- 39.Venkatakrishnan K, Benincosa LJ. Diversity and inclusion in drug development: rethinking intrinsic and extrinsic factors with patient centricity. Clin Pharmacol Ther. 2022;112:204–207. doi: 10.1002/cpt.2416. [DOI] [PMC free article] [PubMed] [Google Scholar]
- 40.Li C, Watson K, Wang S, Diderichsen PM, Gupta N. Population pharmacokinetics of mivavotinib (TAK-659), a dual spleen tyrosine kinase and FMS-like tyrosine kinase 3 inhibitor, in patients with advanced solid tumors or hematologic malignancies. J Clin Pharmacol. 2022;63:326–337. doi: 10.1002/jcph.2174. [DOI] [PubMed] [Google Scholar]
- 41.Hanley MJ, Kerstein D, Tugnait M, Narashimhan N, Marbury TC, Venkatakrishnan K, et al. Brigatinib pharmacokinetics in patients with chronic hepatic impairment. Invest New Drugs. 2023;41:402–410. doi: 10.1007/s10637-023-01339-6. [DOI] [PMC free article] [PubMed] [Google Scholar]
- 42.US Food and Drug Administration. Guidance for industry: pharmacokinetics in patients with impaired hepatic function: study design, data analysis, and impact on dosing and labeling. 2003 May. Available from: https://www.fda.gov/regulatory-information/search-fda-guidance-documents/pharmacokinetics-patients-impaired-hepatic-function-study-design-data-analysis-and-impact-dosing-and. Accessed 7 Jul 2023.
- 43.Faucette S, Wagh S, Trivedi A, Venkatakrishnan K, Gupta N. Reverse translation of US Food and Drug Administration reviews of oncology new molecular entities approved in 2011–2017: lessons learned for anticancer drug development. Clin Transl Sci. 2018;11:123–146. doi: 10.1111/cts.12527. [DOI] [PMC free article] [PubMed] [Google Scholar]
- 44.Yoshida K, Budha N, Jin JY. Impact of physiologically based pharmacokinetic models on regulatory reviews and product labels: frequent utilization in the field of oncology. Clin Pharmacol Ther. 2017;101:597–602. doi: 10.1002/cpt.622. [DOI] [PMC free article] [PubMed] [Google Scholar]
- 45.Rowland Yeo K, Venkatakrishnan K. Physiologically-based pharmacokinetic models as enablers of precision dosing in drug development: pivotal role of the human mass balance study. Clin Pharmacol Ther. 2021;109:51–54. doi: 10.1002/cpt.2092. [DOI] [PMC free article] [PubMed] [Google Scholar]
- 46.Kilford PJ, Chen KF, Crewe K, Gardner I, Hatley O, Ke AB, et al. Prediction of CYP-mediated DDIs involving inhibition: approaches to address the requirements for system qualification of the Simcyp Simulator. CPT Pharmacometr Syst Pharmacol. 2022;11:822–832. doi: 10.1002/psp4.12794. [DOI] [PMC free article] [PubMed] [Google Scholar]
- 47.Zhao P, Rowland M, Huang SM. Best practice in the use of physiologically based pharmacokinetic modeling and simulation to address clinical pharmacology regulatory questions. Clin Pharmacol Ther. 2012;92:17–20. doi: 10.1038/clpt.2012.68. [DOI] [PubMed] [Google Scholar]
- 48.Hanley MJ, D’Arcangelo M, Felip E, Garrido P, Zhu J, Ye M, et al. A phase 1 drug-drug interaction study between brigatinib and the CYP3A substrate midazolam in patients with ALK-positive or ROS1-positive solid tumors. J Clin Pharmacol. 2023;63:583–592. doi: 10.1002/jcph.2198. [DOI] [PubMed] [Google Scholar]
- 49.Gupta N, Huh Y, Hutmacher MM, Ottinger S, Hui AM, Venkatakrishnan K. Integrated nonclinical and clinical risk assessment of the investigational proteasome inhibitor ixazomib on the QTc interval in cancer patients. Cancer Chemother Pharmacol. 2015;76:507–516. doi: 10.1007/s00280-015-2815-7. [DOI] [PubMed] [Google Scholar]
- 50.Cohen-Rabbie S, Berges AC, Rekić D, Parkinson J, Dota C, Tomkinson HK. Qt prolongation risk assessment in oncology: Lessons learned from small-molecule new drug applications approved during 2011–2019. J Clin Pharmacol. 2021;61:1106–1117. doi: 10.1002/jcph.1844. [DOI] [PubMed] [Google Scholar]
- 51.Thomas L, Reyes EM. Tutorial: survival estimation for Cox regression models with time-varying coefficients using SAS and R. J Stat Softw. 2014;61:1–23. doi: 10.18637/jss.v061.c01. [DOI] [Google Scholar]
- 52.Leemis LM. Variate generation for accelerated life and proportional hazard models. Oper Res. 1987;35:892–894. doi: 10.1287/opre.35.6.892. [DOI] [Google Scholar]
- 53.Bender R, Augustin T, Blettner M. Generating survival times to simulate Cox proportional hazards models. Stat Med. 2005;24:1713–1723. doi: 10.1002/sim.2059. [DOI] [PubMed] [Google Scholar]
- 54.Rich B, Mouksassi S. R-based VPC for time-to-event models with non-linear hazard functions [abstract] J Pharmacokinet Pharmacodyn. 2017;44:S11–143. [Google Scholar]
- 55.Shah M, Rahman A, Theoret MR, Pazdur R. The drug-dosing conundrum in oncology: when less is more. N Engl J Med. 2021;385:1445–1447. doi: 10.1056/NEJMp2109826. [DOI] [PubMed] [Google Scholar]
- 56.Mittapalli RK, Guo C, Drescher SK, Yin D. Oncology dose optimization paradigms: knowledge gained and extrapolated from approved oncology therapeutics. Cancer Chemother Pharmacol. 2022;90:207–216. doi: 10.1007/s00280-022-04444-0. [DOI] [PubMed] [Google Scholar]


