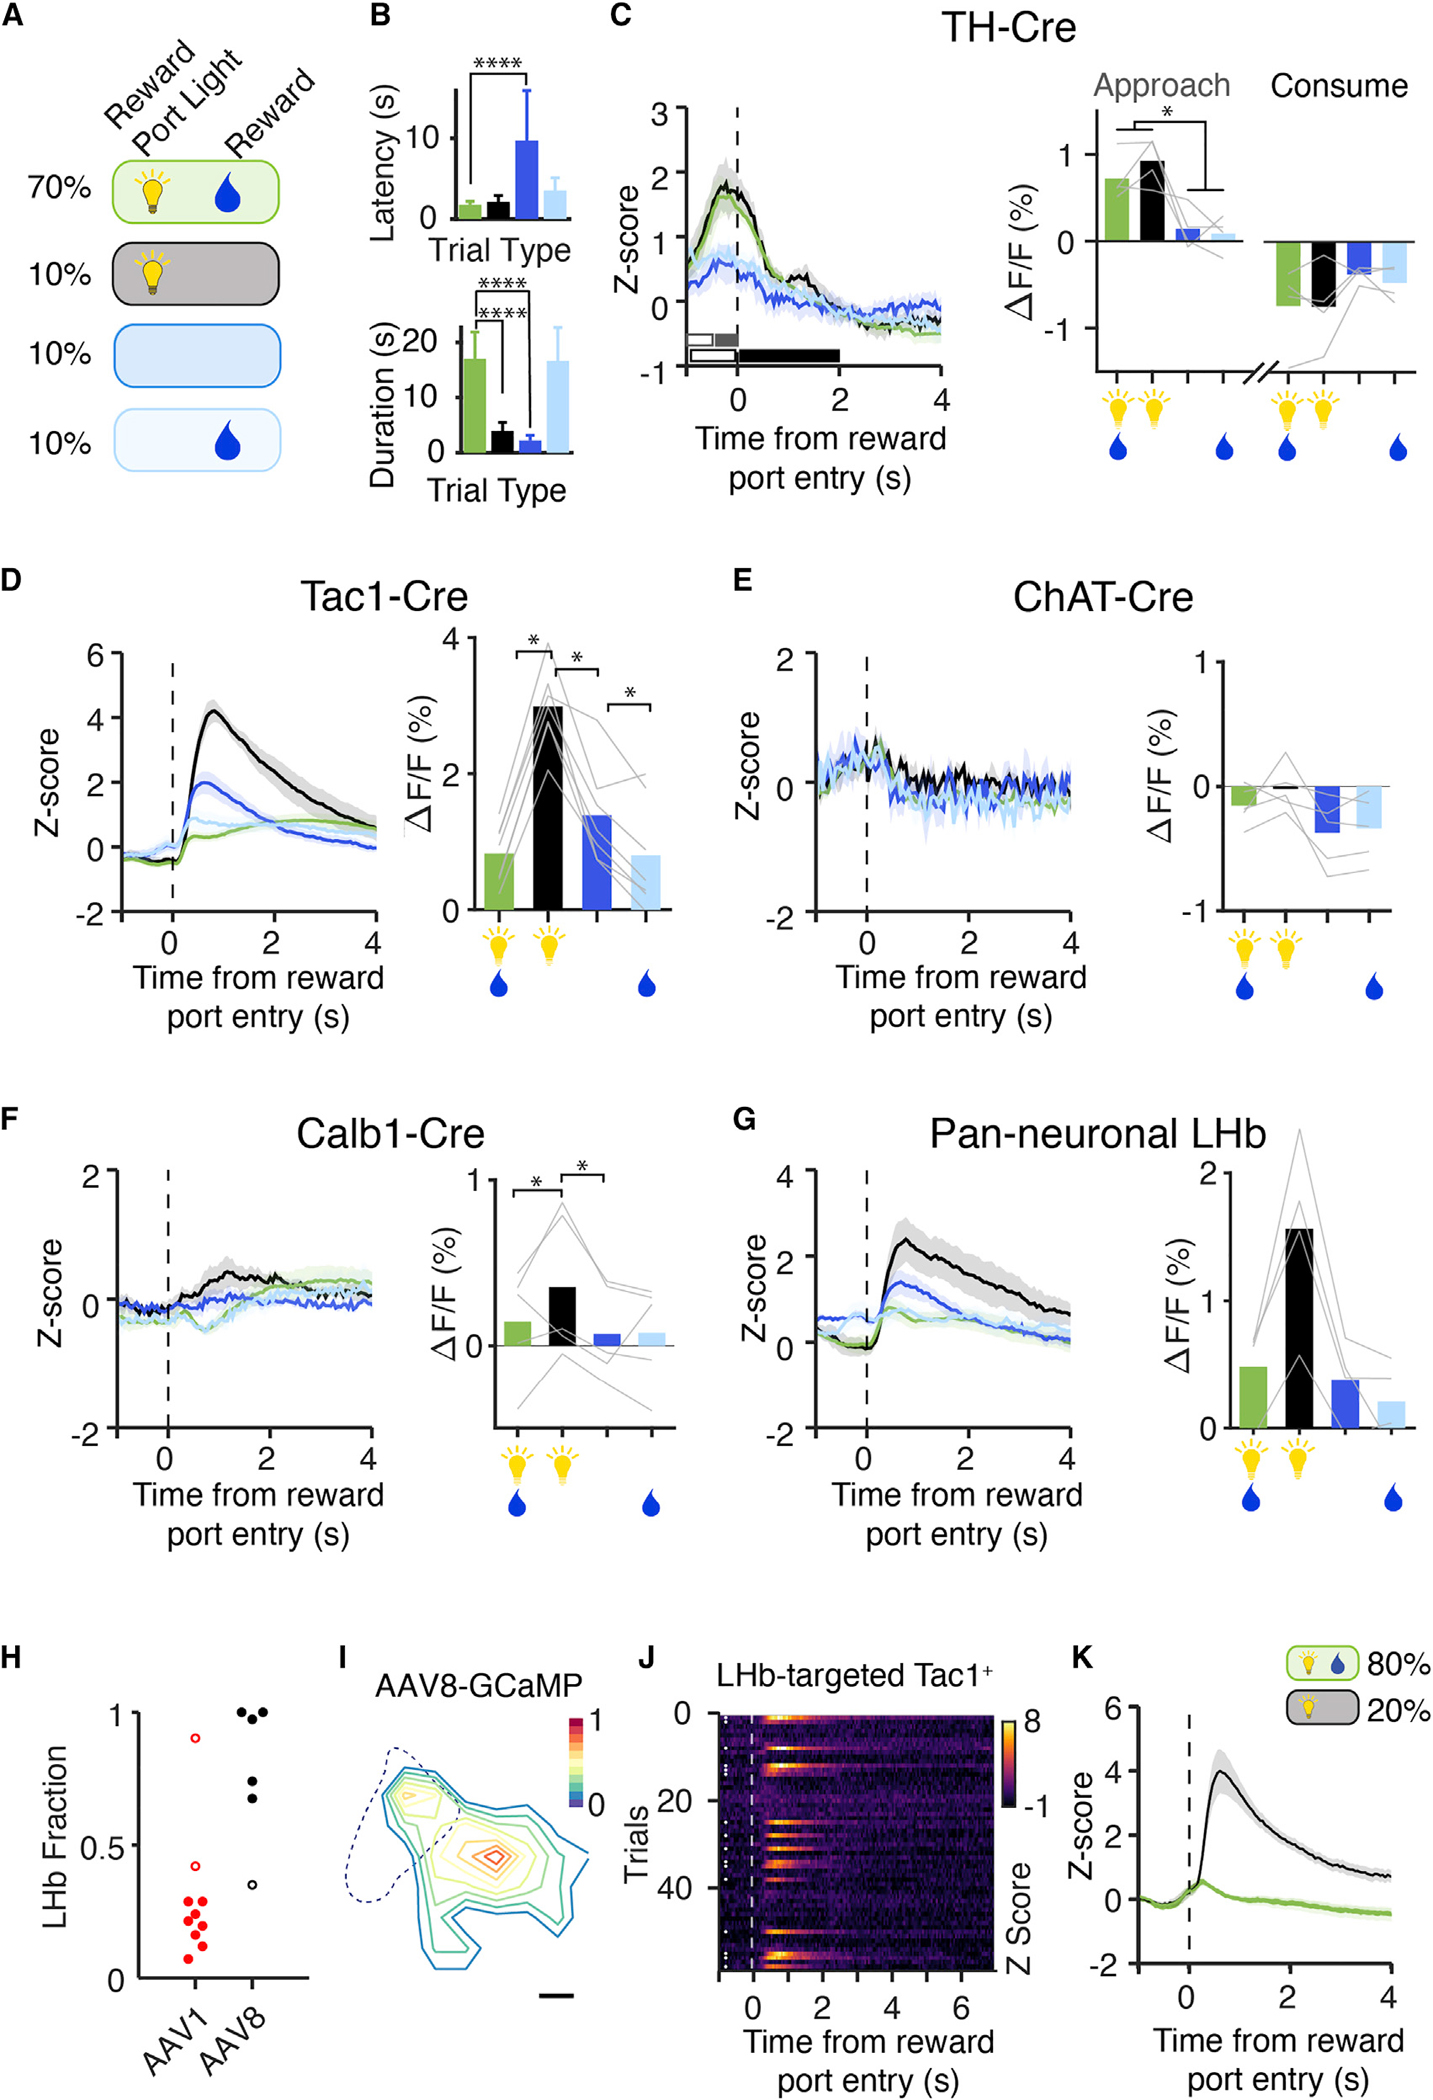
Figure 3. Cell-type-specific segregation of cue-related and outcome-related reward activity.

(A) A variant of the task where reward-predicting cues and reward probabilities were modified. In 70% of correct trials, rewards were cued and delivered (green). In the remaining correct trials, the reward was not cued (light blue), the reward was not delivered (black, 10%), or the reward was neither cued nor delivered (navy, 10%).
(B) Latency to retrieve reward on correct trials, and the duration in the reward port consuming the reward. Two-way ANOVA with repeated measures, corrected for FRD. For reward latency: cue effect, p < 0.01, reward effect, p < 0.01, Interaction, p < 0.01. For reward delivery: reward effect, p < 0.0001. n = 25 animals. Error bars: SEM.
(C–G) Reward-related activity in Hb cell types to predictive cues and reward delivery. Left panels, mean Z scored photometry data aligned to reward port entry. Black and gray bars indicate pre- (open bar) and post- (closed bar) comparison. Color indicates trial type in (A). Right panels, %ΔF/F at reward approach and consumption (C) or consumption (D–G). Gray lines represent individual animals, bars indicate the mean for each reward contingency: TH-Cre, n = 4 mice; Tac1-Cre, n = 7 mice (MHb-Targeted, 82% of neurons in the MHb); ChAT-Cre, n = 5 mice; Calb1-Cre, n = 5 animals; LHb, n = 4 animals. One-way ANOVA with repeated measures and FDR correction, *p < 0.05.
(H) Serotype tropism for LHb neurons. The ratio of GCaMP+ LHb neurons to all GCaMP+ neurons (see STAR Methods) was calculated for AAV1 and AAV8 injections. AAV1, n = 10 animals; AAV8, n = 5 animals. For photometry experiments in Figures 2 and 3, animals with confirmed fiber placement and >70% MHb neurons were included in the analysis in order to assess the activity of MHb Tac1 neurons (the majority of Tac1 neurons in the Hb). Animals excluded from analysis are indicated by open circles.
(I) Spatial distribution of LHb-targeted Tac1+ neurons. All GCaMP+ neurons in the LHb were counted and registered to a common coordinate system. Contour lines: the deciles of normalized cell density.
(J) Tac1+ neurons in the LHb were targeted for fiber photometry recording using Tac1-Cre mice (88% of neurons in the LHb) and lateral injection of AAV8-DIO-GCaMP6f. Example from one animal in a session where 20% of rewards were withheld, showing all correct trials aligned to the reward port entry. White dots: withheld trials.
(K) Mean Z score for LHb-targeted Tac1+ neurons at reward port entry for rewarded (green) and withheld (black) trials. n = 7 animals.
See also Figure S3.
