

SUMMARY
Neutrophils are critical in the host defense against Staphylococcus aureus, a major human pathogen. However, even in the setting of a robust neutrophil response, S. aureus can evade immune clearance. Here, we demonstrate that S. aureus impairs neutrophil function by triggering the production of the anti-inflammatory metabolite itaconate. The enzyme that synthesizes itaconate, Irg1, is selectively expressed in neutrophils during S. aureus pneumonia. Itaconate inhibits neutrophil glycolysis and oxidative burst, which impairs survival and bacterial killing. In a murine pneumonia model, neutrophil Irg1 expression protects the lung from excessive inflammation but compromises bacterial clearance. S. aureus is thus able to evade the innate immune response by targeting neutrophil metabolism and inducing the production of the anti-inflammatory metabolite itaconate.
Graphical Abstract

In brief
Staphylococcus aureus is a major human pathogen that causes persistent lung infections. Tomlinson et al. demonstrate that S. aureus elicits a specific metabolic response from neutrophils—the primary immune cells required for eliminating S. aureus—that impairs their ability to kill the bacteria and clear the infection.
INTRODUCTION
Neutrophils are critical phagocytes in the innate immune response to bacterial pathogens. The importance of neutrophils in host defense is underscored by patients with chronic granulomatous disease, who suffer from recurrent infections with Staphylococcus aureus due to defective neutrophil reactive oxygen species (ROS) production.1,2 S. aureus has a large number of gene products that specifically counteract neutrophil ROS,3 including staphyloxanthin,4,5 superoxide dismutase,6,7 and catalase.7,8 Each of these gene products represents a different strategy for protecting the bacteria from neutrophil-derived oxidants, demonstrating the importance of these interactions in the pathogenesis of S. aureus infections.
Neutrophils generate ROS through the oxidative burst.9 The oxidative burst is fueled by nicotinamide adenine dinucleotide phosphate (NADPH) oxidase, which converts oxygen to superoxide radicals that can directly react with target molecules or be used to generate other ROS like hydrogen peroxide.9,10 NADPH oxidase is a multi-subunit enzyme comprised of a catalytic flavocytochrome b core (Nox2, Cyba), regulatory cytosolic factors (Ncf4, Ncf1, Ncf2), and a Rho GTPase (Rac1 or Rac2).11,12 NADPH oxidase activity is dependent on the availability of its substrates, including oxygen and the electron donor NADPH, which is generated by the pentose phosphate pathway.13 As oxygen consumption is largely used to fuel the oxidative burst, neutrophils rely on fermentative glycolysis for energy production during infections and avidly consume glucose and glycogen to fuel their effector functions and survival.14,15
Airway metabolites contribute substantially to the inflammatory tone of the airway during infection. In response to Gram-negative components like lipopolysaccharide (LPS), macrophages release succinate, which stabilizes HIF-1α and promotes interleukin-1β (IL-1β) release.16,17 This pro-inflammatory process is countered by itaconate, a mitochondrial metabolite synthesized by immune response gene 1 (Irg1).18,19 Itaconate regulates macrophage-driven inflammation through a variety of mechanisms, including inhibiting glycolysis, limiting succinate oxidation, preventing inflammasome activation, and inhibiting JAK signaling.20–29 Itaconate is also a critical mediator of oxidant homeostasis.26,30 This anti-inflammatory, anti-oxidant metabolite accumulates in the airway during pulmonary infection and is especially abundant in response to major healthcare-associated pathogens like P. aeruginosa, K. pneumoniae, and S. aureus.31–34 While these pathogens cannot synthesize itaconate, itaconate impacts their metabolism, inhibiting key pathways like the glyoxylate shunt in P. aeruginosa35 and glycolysis in S. aureus34. In contrast to the Gram-negative pathogens, exactly how itaconate participates in the innate immune response to S. aureus has not been established.
In the studies detailed in this article, we characterize the impact of Irg1 and itaconate production in the pathogenesis of S. aureus pneumonia. We demonstrate that neutrophils are the main source of itaconate in the setting of S. aureus pneumonia and that itaconate limits the neutrophil oxidative burst and impedes S. aureus clearance.
RESULTS
Itaconate production impairs S. aureus clearance during lung infection
We identified itaconate as a prominent metabolite in the host response to S. aureus by performing unbiased metabolomics on mouse bronchoalveolar lavage (BAL) fluid 24 h after intranasal infection with a standard methicillin-resistant S. aureus (MRSA) strain, USA300 LAC. Itaconate was one of the most highly upregulated metabolites in the infected airway, second only to uridine-5-monophosphate, which was already highly abundant in the uninfected basal state (Figure 1A). To better understand the kinetics of itaconate production, we performed BAL metabolomics at 3, 6, 9, 24, 48, and 72 h after LAC infection. We found that itaconate starts to significantly accumulate after 9 h, climbing to a concentration of 98 nM in the diluted BAL fluid by 24 h, with a steady increase to 110 nM at 48 h and 125 nM at 72 h (Figure 1B).
Figure 1. Itaconate impairs bacterial clearance during S. aureus lung infection.

(A) Relative abundance of metabolites in the bronchoalveolar lavage (BAL) fluid of mice infected with S. aureus (LAC) compared with mock-infected mice (PBS).
(B) Itaconate in the BAL fluid of LAC-infected mice over the course of infection.
(C–F) Bacterial colony-forming units (CFUs) (C), neutrophils (D), monocytes (E), and alveolar macrophages (F) in the BAL fluid and lungs of WT and itaconate-deficient (Irg1−/−) mice 24 h after infection.
Data are shown as mean ± SEM from n = (A and B) 3 mice or (C–F) 9–12 mice. Statistics are from Student’s t test; *p < 0.05.
When we quantified bacterial clearance in wild-type (WT) mice and mice that are unable to produce itaconate (Irg1−/−), we found that WT mice had a significantly greater bacterial burden than the Irg1−/− mice 24 h after infection (Figure 1C) despite no significant differences in the numbers of immune cells, including neutrophils, monocytes, and alveolar macrophages (Figures 1D–1F). This increased bacterial burden in the WT mice indicated that host itaconate production impaired bacterial clearance at the peak of infection.
Neutrophils are the main source of itaconate during S. aureus lung infection
To identify the cell types and pathways involved in the itaconate-mediated response to S. aureus, we performed single-cell RNA sequencing (scRNA-seq) on whole lungs from LAC-infected WT and Irg1−/− mice, as well as PBS-treated control mice. The scRNA-seq dataset contained all of the expected lung cell populations, including epithelial cells, endothelial cells, and fibroblasts, as well as immune cell populations like neutrophils, classical monocytes, non-classical monocytes, alveolar macrophages, interstitial macrophages, dendritic cells, natural killer (NK) cells, innate lymphoid cells (ILCs), T cells, and B cells (Figures 2A and S1A). Unsupervised clustering yielded four neutrophil subpopulations, including immature neutrophils, intermediate neutrophils, and two mature neutrophil populations, one that was rich in interferon-stimulated genes (Isg+) and one that highly expressed Retnlg and Mmp8, which is consistent with the neutrophil heterogeneity observed in other studies.36–38 The scRNA-seq data suggested that the relative abundances of the major cell types were similar between the LAC-infected WT and Irg1−/− mice (Figure 2B), which agreed with our flow cytometry data (Figures 1D–1F). It also indicated that there were differences in the relative abundances of the neutrophil subpopulations, as the WT mice had a higher proportion of immature neutrophils and a lower proportion of Isg+ mature neutrophils (Figure 2B), though statistical significance could not be assessed.
Figure 2. Neutrophils are the main source of itaconate during S. aureus lung infection.

(A) Uniform manifold approximation and projection (UMAP) representation of all cell clusters in scRNA-seq data from the lungs of WT and Irg1−/− mice 24 h after infection with S. aureus (LAC).
(B) Relative abundance of different scRNA-seq cell populations in LAC-infected WT and Irg1−/− mice.
(C) UMAP representation of Irg1 expression in all cell clusters of LAC-infected WT mice.
(D) Irg1 expression (qRT-PCR) in neutrophils after LAC infection.
(E) Itaconate accumulation in the supernatant of neutrophils during LAC infection.
(F and G) Neutrophils (F) and bacterial CFUs (G) in the BAL fluid and lung tissue of neutrophil-depleted (+αLy6G) and control mice 24 h after LAC infection.
(H) Itaconate in the BAL fluid of neutrophil-depleted (+αLy6G) and control mice 24 h after lung infection.
Data are shown as mean ± SEM from n = (D) 5 mice (3 replicates/mouse), (E) 3 mice (3 replicates/mouse), or (G–I) 6–7 mice. Statistics are from multiple t test with false discovery rate (FDR) correction; *p < 0.05, **p < 0.01, ***p < 0.001, ****p < 0.0001.
Neutrophils were the predominant source of Irg1 expression during S. aureus pneumonia (Figure 2C). In this S. aureus lung infection model, the macrophage and monocyte populations exhibited minimal Irg1 expression, differing from previous reports of robust itaconate production in macrophages stimulated with LPS.18 To determine if this difference was pathogen specific, we queried Irg1 expression in scRNA-seq data from the lungs of P. aeruginosa (PAO1)-infected mice that were prepared in parallel with the S. aureus infection. In the PAO1-infected mice, Irg1 was expressed in the neutrophil subpopulations as well as the alveolar macrophages, interstitial macrophages, and classical monocytes (Figure S1B). Thus, S. aureus induced a distinct response wherein Irg1 expression was largely restricted to neutrophils.
We verified that neutrophils express Irg1 and produce itaconate with a combination of in vitro and in vivo infection models. We used qRT-PCR to show that neutrophils express Irg1 after infection with S. aureus (Figure 2D) and metabolomics to demonstrate the accumulation of itaconate in the cell supernatant (Figure 2E). To confirm that neutrophils were the predominant source of itaconate in vivo, we quantified itaconate in the BAL fluid of neutrophil-depleted mice that were treated with an anti-Ly6G antibody compared with controls that were administered an isotype antibody.39,40 S. aureus infection induced substantial neutrophil recruitment to the airway and lungs of control mice, which was significantly reduced in the anti-Ly6G-treated mice (Figure 2F). This loss of neutrophils corresponded with reduced bacterial clearance (Figure 2G). The anti-Ly6G-treated mice had comparable numbers of alveolar macrophages but more recruited monocytes compared with the isotype-treated controls (Figures S2A and S2B), likely due to the greater bacterial burden. Despite the higher bacterial load and the increase in monocytes, the neutrophil-depleted mice did not generate airway itaconate (Figure 2H), confirming that neutrophils were the main source of itaconate during S. aureus lung infection.
Itaconate impacts neutrophil metabolism, survival, and recruitment during infection
One of the major mechanisms of action of itaconate in macrophages is the inhibition of glycolysis.27 Glycolysis is critical for the survival and function of neutrophils.14,15 To define the impact of itaconate on the expression of key pathways like glycolysis in neutrophils during in vivo infection, we performed pathway scoring on the neutrophil populations in the scRNA-seq dataset. We found that the neutrophils from WT mice had a significant (p < 0.05) and substantial (|Cohen’s D| > 0.2) decrease in their glycolysis score compared with the Irg1−/− mice (Figure 3A). This reduced glycolytic score was accompanied by an increase in the electron transport chain score (Figure 3A), which was largely driven by genes associated with oxidant homeostasis rather than energy production. Given that the scRNA-seq data only capture the transcriptional state of the cell, we also monitored neutrophil glycolytic activity in vitro with a metabolic flux assay, which uses the extracellular acidification rate (ECAR) in response to glucose as a proxy for glycolysis. As expected, S. aureus infection induced a robust increase in neutrophil ECAR, which was significantly inhibited by a physiological dose of itaconate28 (Figure 3B), confirming that itaconate inhibits neutrophil glycolysis during infection.
Figure 3. Itaconate impacts neutrophil survival and recruitment during infection.
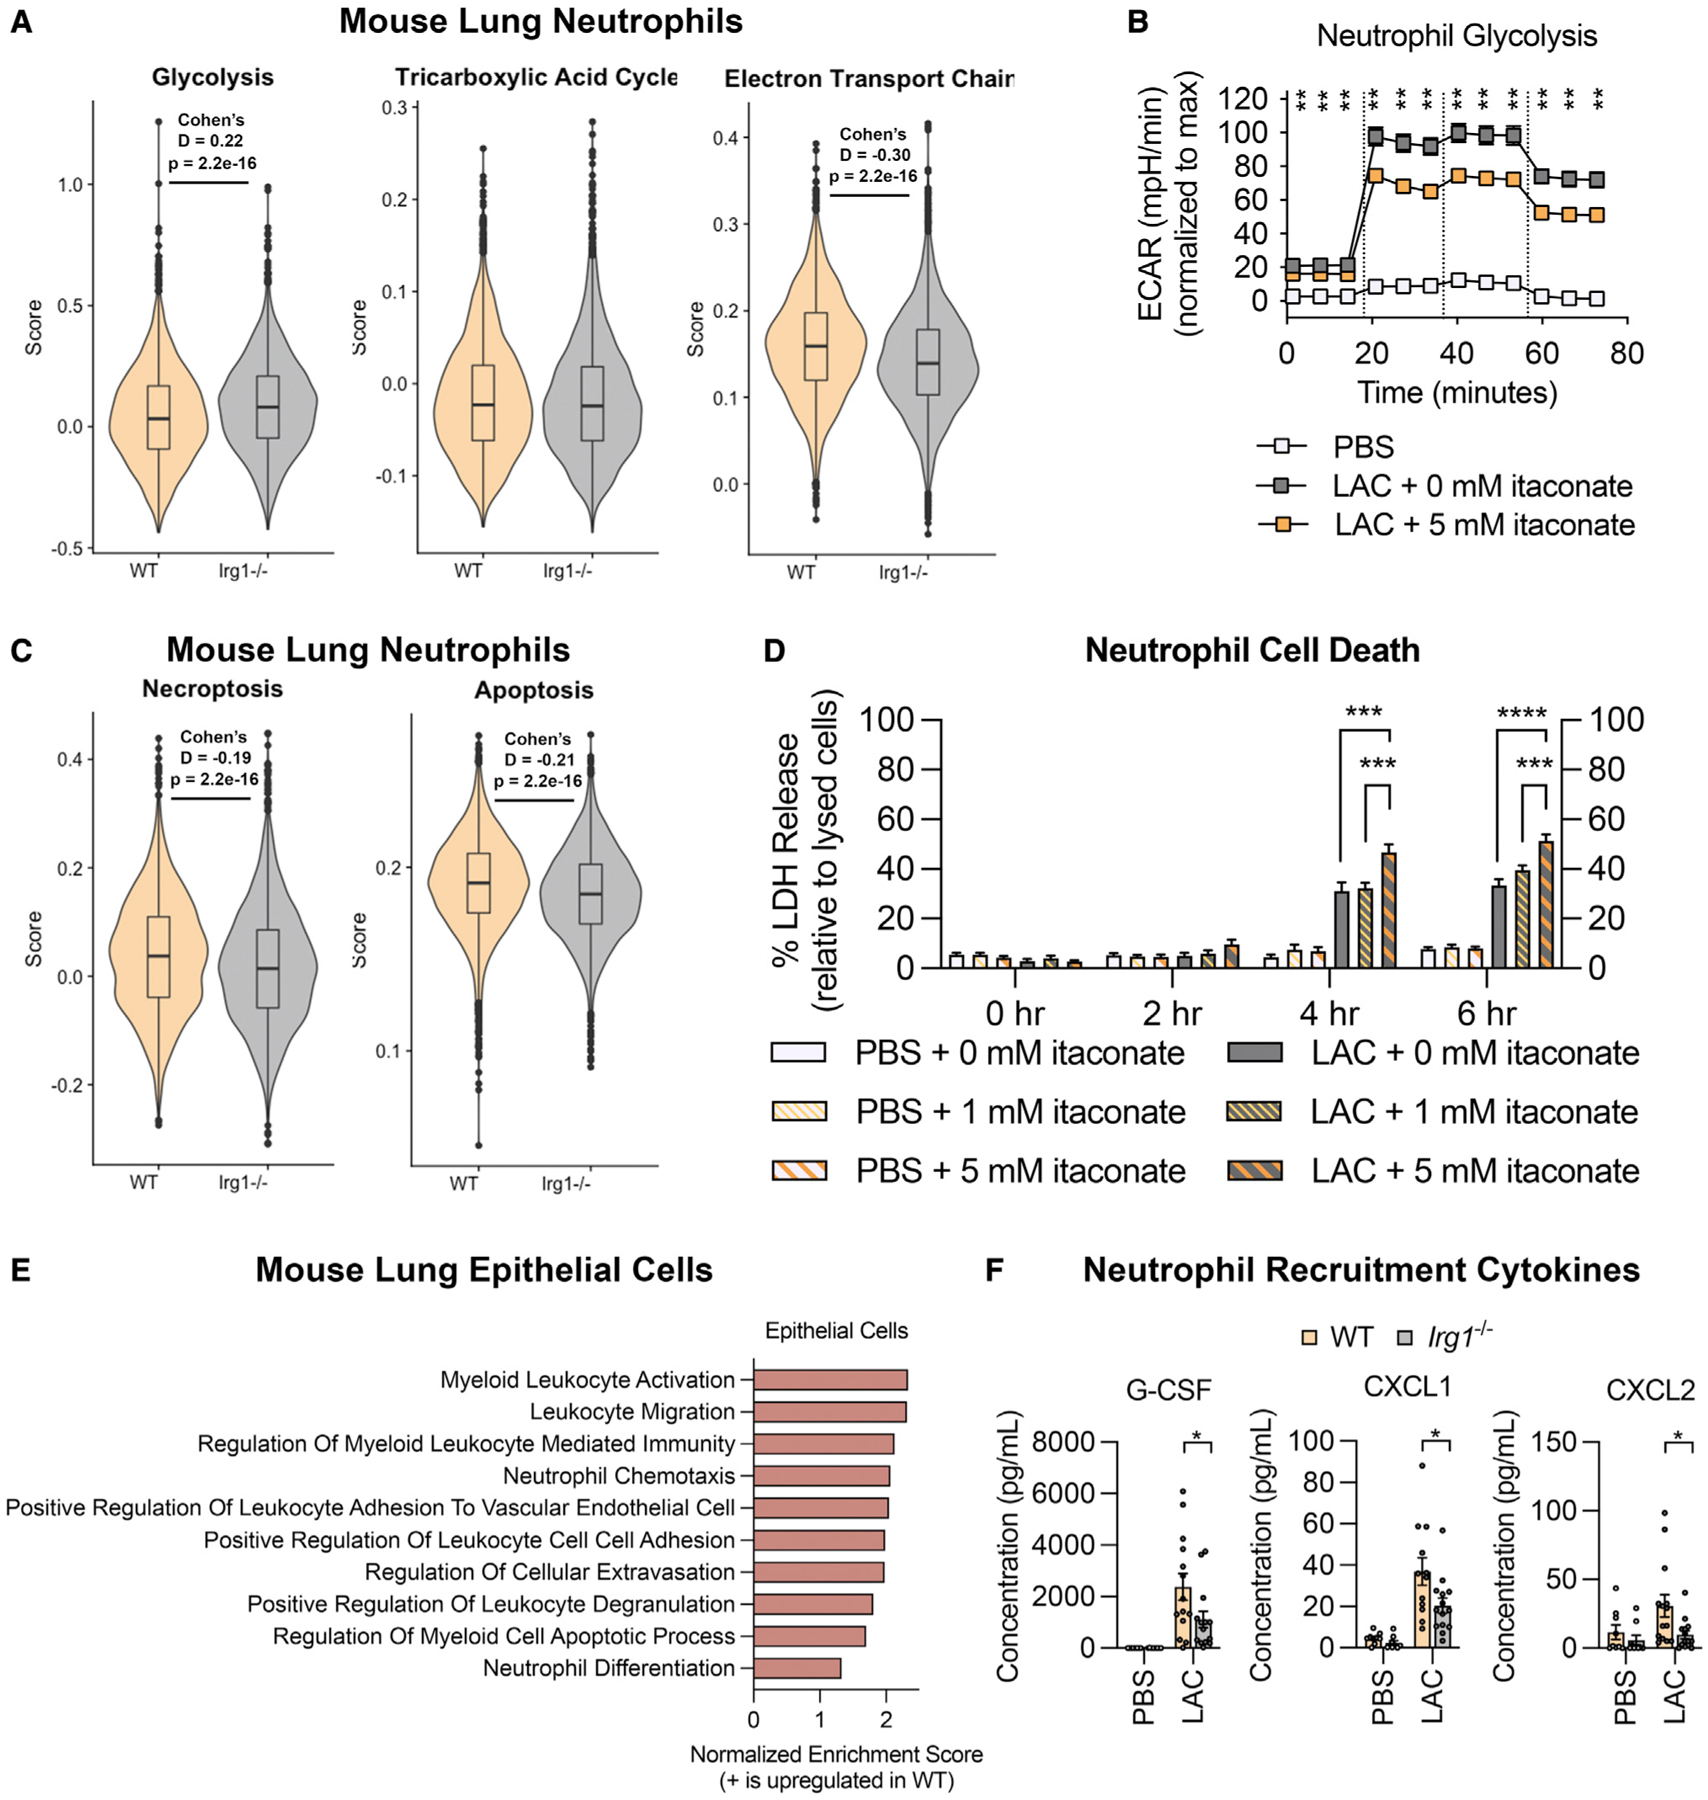
(A) Glycolysis, TCA cycle, and electron transport chain scores in the scRNA-seq neutrophil populations from WT and Irg1−/− mouse lungs 24 h after LAC infection.
(B) Neutrophil glycolytic activity (measured by extracellular acidification rate [ECAR]) during LAC infection in the presence of 0 or 5 mM itaconate; glucose was added at the first dotted line, oligomycin at the second, and 2-deoxyglucose at the third.
(C) Neutrophil necroptosis and apoptosis scores in the scRNA-seq neutrophil populations.
(D) Neutrophil cell death during LAC infection or mock-infection (PBS) in the presence of 0, 1, or 5 mM itaconate.
(E) Enriched gene sets in the lung epithelial cell populations of LAC-infected WT vs. Irg1−/− mice.
(F) Neutrophil recruitment cytokines in the BAL fluid of WT or Irg1−/− mice 24 h after LAC infection or mock infection.
Data are shown as mean ± SEM from n = (B) 3 mice (3 replicates/mouse), (D) 4 mice (3 replicates/mouse), or (F) 14 mice. Statistics are from (A, C, and F) Student’s t test, (B) multiple t test with FDR correction, or (D) one-way ANOVA for each time point; *p < 0.05, **p < 0.01, ***p < 0.001, ****p < 0.0001.
To assess if this inhibition of glycolysis impaired neutrophil survival, we calculated cell death pathway scores and found that the neutrophils from the WT mice had significant and substantial increases in their necroptosis and apoptosis scores compared with the Irg1−/− mice (Figure 3C). We also monitored neutrophil cell death in vitro by measuring lactate dehydrogenase (LDH) release. As expected, infection induced neutrophil cell death, and itaconate augmented this cell death in a dose-dependent manner (Figure 3D). Importantly, itaconate did not induce LDH release from mock-infected neutrophils (Figure 3D), indicating that itaconate only augmented the cell death during infection, when the neutrophils were highly dependent on glycolysis (Figure 3B). Together, these data demonstrate that itaconate inhibited neutrophil glycolysis and survival during S. aureus infection.
Given the effects of itaconate on neutrophil metabolism and survival, we expected to see fewer neutrophils in the WT mice. However, our flow cytometry data showed no significant differences in overall neutrophil numbers (Figure 1D). We also had noted that the WT mice had a higher ratio of immature to mature neutrophils in the scRNA-seq data (Figure 2B), suggesting greater neutrophil turnover. We thus hypothesized that neutrophil numbers in the WT mice were being maintained by increased neutrophil recruitment to the airway. Differential gene expression and fast gene set enrichment analysis (FGSEA) on the epithelial cell populations in the scRNA-seq data revealed that the WT mice upregulated gene sets involved in neutrophil chemotaxis and differentiation, leukocyte activation and migration, leukocyte adhesion to endothelial cells, and extravasation compared with the Irg1−/− mice (Figure 3E). We confirmed that the WT mice had significantly increased production of granulopoetic cytokines and chemokines like G-CSF, CXCL1, and CXCL2 (Figure 3F), consistent with increased signaling for neutrophil recruitment to the airway in the setting of itaconate production.
Itaconate inhibits the oxidative burst and S. aureus killing
Neutrophil function is also highly dependent on NADPH oxidase, which generates superoxide ROS that drive the oxidative burst.10 Recent studies that used proteomic analysis to identify the targets of itaconate in activated macrophages found that multiple components of the NADPH oxidase complex, including the activating cytosolic factors (Ncf2 and Ncf4) and the Rho GTPase (Rac2), are covalently modified by itaconate (Figure 4A).27,41 To determine if these covalent interactions impact NADPH oxidase function, we monitored the impact of itaconate on neutrophil oxidative burst. Using metabolic flux analysis, we found that S. aureus infection induced a robust increase in neutrophil oxygen consumption rate (OCR), which was significantly inhibited by itaconate (Figure 4B). We also quantified neutrophil superoxide production using a ferrocytochrome C reduction assay,42 which reaffirmed that itaconate inhibited S. aureus-induced oxidative burst in a dose-dependent manner (Figure 4C). Administration of the NADPH oxidase inhibitor diphenyleneiodonium chloride (DPI) significantly inhibited superoxide production, confirming that the observed oxidative burst was largely driven by NADPH oxidase activity (Figure 4C). When we calculated NADPH oxidase pathway scores with the scRNA-seq data, we found that neutrophils from WT mice had a significant (p < 0.05) but not substantial (|Cohen’s D| < 0.2) decrease in NADPH scores compared with the Irg1−/− mice (Figure S3A), likely because itaconate largely acts as a post-translational modification. Together, these functional data support the identification of NADPH oxidase as a target of itaconate and demonstrate that itaconate suppresses the oxidative burst in neutrophils during S. aureus infection.
Figure 4. Itaconate inhibits bacterial killing by suppressing neutrophil oxidative burst.

(A) Covalent modification of NADPH oxidase by itaconate.
(B) Neutrophil oxygen consumption rate (OCR) during LAC infection in the presence of 0 or 5 mM itaconate; glucose added at the first dotted line, oligomycin at the second, and 2-deoxyglucose at the third.
(C) Neutrophil superoxide production during LAC infection or mock infection (PBS) in the presence of 0, 1, or 5 mM itaconate or an NADPH oxidase inhibitor (DPI) compared with the positive control (PMA).
(D) Bacterial killing by neutrophils in 0 or 5 mM itaconate.
(E and F) Enriched gene sets in the scRNA-seq (E) epithelial and (F) endothelial cell populations of LAC-infected WT vs. Irg1−/− mice.
(G–I) H&E-stained lung sections (24 h post-infection) (G), inflammation scoring (H), and albumin (I) in the BAL fluid from PBS-treated and LAC-infected WT and Irg1−/− mice.
Data are shown as mean ± SEM from n = (B and C) 3 mice (3 replicates/mouse) or (D) 6 mice (3 replicates/mouse). Statistics are from (B) multiple t test with FDR correction, (C) one-way ANOVA, or (D) Student’s t test; *p < 0.05, **p < 0.01, ***p < 0.001, ****p < 0.0001.
Given that itaconate inhibits key neutrophil functions like glycolysis and the oxidative burst, we postulated that it would impair neutrophil bacterial killing. In the in vitro model, neutrophils killed ~50% of bacteria by 4 h (Figure 4D). Administration of itaconate significantly reduced bacterial killing to ~20% (Figure 4D). This impaired bacterial killing was not confounded by differences in bacterial growth or uptake. In the conditions used for these in vitro assays, itaconate did not significantly impact bacterial growth (Figure S3B). In the scRNA-seq data, the neutrophils from the LAC-infected WT and Irg1−/− mice had equivalent phagocytosis scores (Figure S3C). To confirm that itaconate did not impact bacterial uptake via phagocytosis, we infected neutrophils with LAC that stably express yellow fluorescent protein (LAC-YFP) and monitored bacterial uptake by flow cytometry. Itaconate did not alter the uptake of LAC-YFP, while the actin polymerization inhibitor cytochalasin D significantly reduced the number of LAC-YFP+ cells, demonstrating that the detected LAC-YFPs were internalized by the neutrophils (Figure S3D). These findings establish that itaconate impedes neutrophil bacterial killing by inhibiting key functional pathways like glycolysis and the oxidative burst. Given the importance of neutrophils in controlling bacterial burden during S. aureus lung infection (Figures 2F and 2G), this inhibition of neutrophil bacterial killing explains the impaired bacterial clearance we observed in the WT mice (Figure 1C).
Itaconate controls inflammation during S. aureus pneumonia
Neutrophil itaconate production may seem counterproductive given that it impairs neutrophil function and bacterial clearance during infection. However, itaconate has many anti-inflammatory functions that may benefit the host during staphylococcal pneumonia. We postulated that Irg1 expression and itaconate production protects the lung from inflammation and tissue damage. To establish the how S. aureus infection impacts the cell populations that are critical for lung function, we performed FGSEA on the scRNA-seq epithelial and endothelial cells from the LAC-infected vs. PBS-treated mice. As expected, infection triggered the upregulation of pathways involved in the bacterial defense response (Figures S4A and S4B), driven by increased expression of cytokines (Il1a, Il1b, Tnf, Cxcl1, Cxcl2) as well as recognition receptors and signaling proteins (Cd14, Il1r2, Tlr2, Nlrp3, Icam1, Vcam1, Rela) (Figures S4C and S4D). In addition to these critical defense pathways, the epithelial and endothelial cell upregulated pathways associated with oxidant detoxification and the regulation of cell death (Figures S4A and S4B), driven by increased expression of genes that detoxify ROS and maintain cellular redox balance (Sod2, Hif1a, Nfe2l2, Hmox1, Hsbp1, Esd, Gclc, Gpx2, Slc7a11) as well as genes that negatively regulate apoptosis (Bcl2a1a, Bcl2l1, Clu, Mcl1, Eif5a) (Figures S4C and S4D). These data demonstrate that S. aureus infection induces a robust response in lung epithelial and endothelial cells that involves both bacterial defense pathways as well as pathways that protect these critical cells from oxidant stress and cell death.
We hypothesized that Irg1 would promote these protective pathways during S. aureus pneumonia. FGSEA of the epithelial and endothelial cells from the LAC-infected WT vs. Irg1−/− mice demonstrated that Irg1 upregulated pathways involved in oxidant detoxification, cell death regulation, and wound healing (Figures 4E and 4F). In epithelial cells, upregulation of the oxidant defense pathway was driven by increased expression of genes involved in oxidant detoxification (Sod2, Pon1) and genes involved in maintaining glutathione levels and cellular redox homeostasis (Gclc, Esd, Glul, Slc7a11), while cell survival was protected by increased expression of negative regulators of apoptosis (Clu, Igfbp7, Nr4a1) (Figures S4E and S4F). Similarly, in endothelial cells, Irg1 drove increased expression of genes that metabolize ROS (Sod2), reduce ROS production (Ucp2), and maintain cellular redox balance (Slc7a11), as well as genes that negatively regulate apoptosis (Bcl2l1, Sphk1, Tnfaip3) (Figures S4E and S4F). Irg1 thus promotes the pathways that protect epithelial and endothelial cells from oxidant stress and cell death during S. aureus pneumonia.
To confirm that the increased expression of these protective genes in the WT mice was not due to greater inflammation caused by the higher bacterial load (Figure 1C), we monitored inflammation in fixed and stained lung sections (Figure 4G). Blinded scoring of these lung sections showed that the WT mice were not more inflamed than the Irg1−/− mice (Figure 4H). Other markers of lung damage like albumin in the airway fluid also demonstrated that the WT lungs were not more damaged than the Irg1−/− lungs. This controlled inflammation despite the increased bacterial burden, along with the upregulation of anti-oxidant and anti-apoptotic genes in epithelial and endothelial cells, is consistent with the overarching function of Irg1 and itaconate in protecting the host from inflammation.
DISCUSSION
S. aureus has evolved numerous mechanisms to counteract neutrophils during infection. In the studies detailed in this article, we found that S. aureus specifically induced Irg1 expression and itaconate production in neutrophils. While itaconate controlled inflammation during S. aureus pneumonia, it also limited bacterial clearance. Mechanistically, itaconate inhibited neutrophil glycolysis and NADPH oxidase, impeding neutrophil survival and bacterial killing.
An effective innate immune response requires balance between pro-inflammatory effectors to eradicate the pathogen and anti-inflammatory mechanisms to protect the host. Our studies indicate that the induction of neutrophil Irg1 expression by S. aureus is beneficial for both host and pathogen. For the host, Irg1-mediated itaconate production controls inflammation and prevents excessive tissue damage. However, it also inhibits neutrophil glycolysis and NADPH oxidase. The resulting impact on both neutrophil survival and the oxidative burst are compensated to some degree by the continual recruitment of neutrophils to the site of infection to help clear the pathogen. This is especially important in the response to S. aureus, in which neutrophils are crucial for infection control.43,44
For the pathogen, induction of neutrophil Irg1 expression is consistent with the conservation of numerous S. aureus gene products that specifically thwart bacterial killing.3,45–47 In contrast to other common pathogens that stimulate Irg1 expression in multiple myeloid cell populations, the overwhelming predominance of Irg1 expression in neutrophils reflects their dominance in the response to S. aureus. A previous report showed that itaconate also promotes S. aureus survival by directly restructuring bacterial metabolism. As in neutrophils, itaconate inhibits staphylococcal glycolysis, which selects for strains with increased carbon flux through pathways that generate the extracellular polysaccharides used in biofilms.34 Thus, itaconate enables bacterial survival both by impairing the host innate immune response and by promoting protective biofilms.
Other pulmonary pathogens also induce and are impacted by the generation of itaconate. In a model of Mycobacterium tuberculosis infection, Irg1 expression in myeloid cells prevented lethal neutrophil-driven inflammation and tissue damage.48 Similarly, Irg1 expression limited excessive inflammation during lung infection with K. pneumoniae.33 In these infection models, Irg1 is expressed in numerous myeloid cell populations, including neutrophils, macrophages, and monocytes. Whereas the Gram-negative pathogens trigger Irg1 expression through LPS-TLR4 signaling, M. tuberculosis induces Irg1 through a combination of TLR2 and IFNAR signaling,49 pathways that are also activated by S. aureus. The relevance of these intracellular signaling cascades to S. aureus infection and neutrophil immunometabolism should be addressed in future studies.
These findings add a deeper layer to our understanding of the success of S. aureus as a pathogen, as it elicits a distinctive immunometabolic response that impairs neutrophil function and enables bacterial persistence.
Limitations of the study
We acknowledge that direct comparison of WT and Irg1−/− neutrophils in vitro would provide a better understanding of how endogenous itaconate production impacts neutrophil function. We found that these assays are not feasible, given that the in vitro neutrophil studies are all performed within the first 4 h of infection, before the neutrophils start producing itaconate. Although longer time points would enable itaconate production, the data would be complicated by the high levels of neutrophil cell death after 4 h of infection. For these reasons, we chose to use exogenous itaconate to monitor its impact of neutrophil function with the understanding that it may not fully recapitulate the effects of endogenous itaconate production. We also used only one strain of S. aureus for all our studies. The immunometabolic responses to other strains of S. aureus may vary.
STAR★METHODS
RESOURCE AVAILABILITY
Lead contact
Further information and requests for resources and reagents should be directed to and will be fulfilled by the lead contact, Dr. Alice Prince (asp7@cumc.columbia.edu).
Materials availability
S. aureus strains used in this work are available from the lead contact without restriction.
Data and code availability
All data discussed in this study are presented in the published article and its supplementary files. Single-cell RNA-seq data have been deposited at NIH Gene Expression Omnibus (GEO: GSE215195) and are publicly available as of the date of publication. Accession numbers are listed in the key resources table. No original code was developed for this study. Any additional information required to reanalyze the data reported in this paper is available from the lead contact upon request.
KEY RESOURCES TABLE
| REAGENT or RESOURCE | SOURCE | IDENTIFIER |
|---|---|---|
| Antibodies | ||
| anti-Ly6G clone 1A8 | BioXCell | BE0075-1 |
| isotype control clone 2A3 | BioXCell | BE0089 |
| anti-CD45-AF700 | BioLegend | 103127 |
| anti-CD11b-AF594 | BioLegend | 101254 |
| anti-CD11c-Bv605 | BioLegend | 117334 |
| anti-SiglecF-APC-Cy7 | BD Biosciences | 565527 |
| anti-Epcam-FITC | BioLegend | 118207 |
| anti-F4/80-Pe-Cy7 | BioLegend | 123114 |
| anti-Ly6C-Bv421 | BioLegend | 128032 |
| anti-Ly6G-PerCp-Cy5.5 | BioLegend | 127616 |
| Bacterial and virus strains | ||
| USA300 LAC | Our laboratory | N/A |
| USA300 LAC-YFP | This study | N/A |
| Chemicals, peptides, and recombinant proteins | ||
| Luria Bertani Broth | Becton Dickinson | 244610 |
| Agar | Sigma | 400400010 |
| Chloramphenicol | Sigma | C-0378 |
| eBioscience RBC Lysis Buffer | Invitrogen | 00-4333-57 |
| autoMACS Rinsing Solution | MACS Miltenyi | 130-091-222 |
| Bovine Serum Albumin | MACS Miltenyi | 130-091-376 |
| RPMI 1640 with L-glutamine | Corning | 10-040-CV |
| Fetal Bovine Serum | Sigma | F4135 |
| Itaconate | Aldrich | 129204 |
| Sodium Hydroxide | Fisher Scientific | SS-2661 |
| LIVE/DEAD Stain | Invitrogen | L23105A |
| Paraformaldehyde | Electron Microscopy Sciences | 15714-S |
| Collagenase I | Gibco | 17100-017 |
| Dispase | Gibco | 17105-041 |
| Elastase | Worthington | LS006365 |
| DNAse | Invitrogen | 2224G |
| PowerUp SYBR Green PCR Mastermix | Applied Biosystems | A25742 |
| Methanol | Alpha Aesar | 22909 |
| XF Base Medium | Agilent | 102353-100 |
| Glutamine | LifeLine | LS-1031 |
| HBSS | Corning | 21-023-CV |
| Ferrocytochrome C from Bovine Heart | Millipore Sigma | C3131 |
| Diphenyleneiodonium Chloride | Millipore-Sigma | D2926 |
| Phorbol Myristate Acetate | Sigma-Aldrich | P8139 |
| NP-40 | Thermo Scientific | 28324 |
| Cytochalasin D | Sigma-Aldrich | C8273 |
| Lysostaphin | Sigma-Aldrich | L7386 |
| Formalin-Free tissue Fixative | Sigma | A5472 |
| Critical commercial assays | ||
| MACS Miltenyi Mouse Neutrophil Isolation kit | MACS Miltenyi | 130-097-658 |
| Mouse Cytokine Proinflammatory Focused 10-plex Discovery Assay | Eve Technologies | MDF10 |
| Mouse Cytokine/Chemokine 31-plex Discovery Assay | Eve Technologies | MD31 |
| E.Z.N.A. Total RNA Kit | Omega Bio-tek | R6834-02 |
| DNA-free DNA removal kit | Fisher Scientific | AM1906 |
| High Capacity cDNA Reverse transcription kit | Applied Biosystems | 43688-14 |
| LDH Release Assay | Abcam | ab65393 |
| Albumin (BCG) Assay Kit (Colorimetric) | Abcam | ab235628 |
| Deposited data | ||
| Raw and Analyzed scRNA-Seq Data | This study | GEO: GSE215195 |
| Experimental models: Organisms/strains | ||
| Irg1−/− C57BL/6NJ mice | Jackson Laboratories | 029340 |
| WT C57BL/6NJ mice | Jackson Laboratories | 005304 |
| Oligonucleotides | ||
| Mouse Irg1 F: CGTGAGAAAGCACCTTGTGA |
This study | N/A |
| Mouse Irg1 R: CTGTGGAAGGATGGGACAGT |
This study | N/A |
| Mouse actin F: AGCCATGTACGTAGCCATCC |
This study | N/A |
| Mouse actin R: CTCTCAGCTGTGGTGGTGAA |
This study | N/A |
| Software and algorithms | ||
| FlowJo v10 | FlowJo | https://www.flowjo.com/ |
| FACSDiva v9 | BD Biosciences | https://www.bdbiosciences.com/en-us/products/software/instrument-software/bd-facsdiva-software |
| Cell Ranger | 10X Genomics | https://support.10xgenomics.com/single-cell-gene-expression/software/pipelines/latest/what-is-cell-ranger |
| Seurat v4.0.4 | Satija Laboratory | https://satijalab.org/seurat/ |
| R v4.1.1 | R Project | https://www.r-project.org/ |
| StepOne v2.3 | ThermoFisher | https://www.thermofisher.com/us/en/home/technical-resources/software-downloads/StepOne-and-StepOnePlus-Real-Time-PCR-System.html |
| E-Maven v0.10.0 | Rabinowitz Laboratory | http://maven.princeton.edu/index.php |
| Seahorse Wave Desktop v2.6.0 | Agilent | https://www.agilent.com/en/product/cell-analysis/real-time-cell-metabolic-analysis/xf-software/seahorse-wave-desktop-software-740897 |
| Prism v9.2.0 | GraphPad | https://www.graphpad.com/scientific-software/prism/ |
| Other | ||
| LS Column | MACS Miltenyi | 130-042-401 |
| MidiMACS Separator magnet | MACS Miltenyi | 130-042-302 |
| 40 μm cell strainers | Falcon | 352340 |
| 70 μm cell strainers | CELLTREAT | 229483 |
| XFe24 sensor cartridge | Agilent | 102340-100 |
| XF24 well plate | Agilent | 102340-100 |
EXPERIMENTAL MODEL AND SUBJECT DETAILS
Bacterial strains
Laboratory strains used in this study were USA300 LAC and USA300 LAC-YFP. To construct a stable strong YFP reporter, the PisaA-YFP fragment was digested (SacI/KpnI) from pIMC8-PisaA-YFP50 and ligated into complementary digested pIMC10a.51 The ligation was transformed into Escherichia coli IM08B and selected on L-agar containing 10 μg/mL chloramphenicol (Cm10). The plasmid pIMC10a-PisaA-YFP was extracted and transformed into electrocompetent cells of S. aureus LAC.52 The integration of the plasmid into the neutral amy locus on the chromosome was selected on BHI agar (Cm10).
USA300 LAC was grown at 37°C on plates of Luria-Bertani broth (LB) with 1% agar (w/v). Overnight cultures and subcultures were grown in LB at 37°C with shaking. For the USA300 LAC-YFP strain, the LB agar plates and LB medium were supplemented with Cm10. Bacterial concentrations were quantified by optical density at 600 nm (OD600) and confirmed by serial dilution and plating on LB agar plates.
Mouse infection model
Breeding pairs of Irg1−/− C57BL/6NJ mice were purchased from Jackson Laboratories and used to establish a colony at Columbia University. Wildtype (WT) C57BL/6NJ mice were purchased from Jackson Laboratories for each experiment. All mice were housed in humidity-controlled conditions at 18–23°C, with 12-h light/dark cycles. All animal studies were approved under Columbia IACUC Protocol AABE8600, and were carried out in strict accordance with the NIH Guide for the Care and Use of Laboratory Animals, the Animal Welfare Act, and US federal law. Each in vivo and in vitro experiment was performed with 8–10 week-old mice, using an equal ratio of male:female animals that were randomly assigned to cages. Mouse health was routinely checked by an IACUC veterinarian.
For antibody-mediated neutrophil depletion, WT mice were given an intraperitoneal injection of 170 μg of anti-Ly6G clone 1A8 or isotype control clone 2A3 2 days and 2 h before infection.39,40 Neutrophil depletion was confirmed by FACS analysis (described below).
Neutrophil infection model
Mouse neutrophils were isolated from C57BL/6NJ mouse bone marrow using the MACS Miltenyi Mouse Neutrophil Isolation kit. Femurs and tibias were surgically removed from euthanized mice and sterilized with 70% ethanol. The bone marrow was extracted by flushing with PBS and the resulting cell suspension was centrifuged at 500 xg for 5 min at 4°C. Red blood cell lysis was performed with the eBioscience RBC lysis buffer. The remaining cells were resuspended in autoMACS Rinsing Solution supplemented with bovine serum albumin (BSA) and labeled according to the kit protocol. The labeled cell suspension was passed through an LS Column in a MidiMACS Separator magnet. The flowthrough cells (neutrophils) were resuspended in RPMI 1640 with L-glutamine supplemented with 10% heat inactivated fetal bovine serum (hiFBS) and used the same day. For the experiments that used media supplemented with itaconate, the pH of the medium was corrected to 7.0 with 10N sodium hydroxide.
To assess neutrophil purity, aliquots were stained with LIVE/DEAD, anti-CD45-AF700, anti-CD11b-AF594, anti-CD11c-Bv605, anti-Ly6C-Bv421, and anti-Ly6G-PerCp-Cy5.5 at a concentration of 1:200 in PBS, for 1 h at 4°C. After washing, the cells were stored in 2% paraformaldehyde until analysis on the BD LSRII. Data were analyzed with FlowJo. Neutrophils were defined as CD45+CD11b+Ly6G+ cells.
METHOD DETAILS
Mouse infection
Mice aged 8–10 weeks were infected intranasally with 2 × 10⁷ USA300 LAC in 50 μL phosphate-buffered saline (PBS); PBS alone was administered to mock-infected control animals. 24, 48, or 72 h after infection, the mice were sacrificed for collection of bronchoalveolar lavage (BAL) fluid and lung tissue. BAL fluid was collected in 3 mL of PBS by a series of 1 mL flushes. Lung tissue was homogenized through 40 μm cell strainers with 2 mL of PBS. BAL and lung volumes were equivalent between conditions and genotypes. Aliquots of the BAL and lung homogenates were serially diluted and plated on LB agar plates to quantify bacterial colony forming units (CFUs). The BAL and lung homogenates were centrifuged at 1400 × g for 7 min at 4°C, and the BAL supernatant was collected for cytokine analysis (described below). After red blood cell lysis with the eBioscience RBC Lysis buffer, the BAL and lung cells were prepared for fluorescence-activated cell sorting (FACS) (described below).
Multiarray cytokine quantification
Cytokine concentrations in BAL supernatants were measured with Eve Technologies Mouse Cytokine Proinflammatory Focused 10-plex Discovery Assay and Mouse Cytokine/Chemokine 31-plex Discovery Assay.
FACS of mouse BAL and lung cells
Mouse BAL and lung cells were stained with LIVE/DEAD stain, anti-CD45-AF700, anti-CD11b-AF594, anti-CD11c-Bv605, anti-SiglecF-APC-Cy7, anti-Epcam-FITC, anti-F4/80-Pe-Cy7, anti-Ly6C-Bv421, and anti-Ly6G-PerCp-Cy5.5, each at a concentration of 1:200 in PBS, for 1 h at 4°C. After centrifuging at 2500 ×g for 2 min at 4°C and washing twice with PBS, the cells were stored in 2% paraformaldehyde until analysis on the BD LSRII (BD Biosciences) using FACSDiva. Data was analyzed with FlowJo. Mouse BAL and lung cells were identified as follows: alveolar macrophages were Epcam−CD45+CD11b+/−SiglecF+CD11c+; monocytes were CD45+CD11b+SiglecF−CD11c−Ly6G−Ly6C+/−; neutrophils were CD45+CD11b+SiglecF−CD11c−Ly6G+Ly6C+/−.
scRNA-sequencing sample preparation and data acquisition
8-week old WT and Irg1−/− C57BL/6NJ mice were intranasally infected with 2 × 10⁷ USA300 LAC in 50 μL PBS or treated with PBS alone. 24 h after infection, mice were euthanized and their lungs were harvested. To create a single cell suspension, the lungs were placed in an Eppendorf tube containing an enzymatic digestion solution of 2 mg/mL collagenase I, 20 mg/mL dispase, 1 mg/mL elastase, and 1 μL/mL DNAse in PBS. The lungs were minced in the Eppendorf tube, then incubated with shaking at 37°C for 30 min. The digestion was quenched with 4 volumes of PBS supplemented with 10% hiFBS, and strained over a 70 μm cell strainer. The cell suspension was centrifuged at 1400 × g for 7 min at 4°C. Red blood cell lysis was performed with the eBioscience RBC lysis buffer. The resulting cell pellet was resuspended in PBS supplemented with 0.04% bovine serum albumin before being loaded onto the 10X Genomics Chromium Single Cell Controller. Cell viability was above 95% for each sample. Approximately 5000 cells were analyzed per sample. FASTQ file generation, alignment, filtering, barcode counting, and UMI counting were performed with the 10X Cell Ranger software.
scRNA-sequencing data analysis
Filtered read count matrices were analyzed using the Seurat platform in R. The data were normalized using SCTransform.53 Data integration and unsupervised clustering were executed with the FindIntegrationAnchors, IntegrateData, FindNeighbors, and FindClusters functions in Seurat. Data visualization was achieved using the RunPCA and RunUMAP functions in Seurat. Unbiased cluster labeling was performed with SingleR54 using the ImmGen reference (https://www.immgen.org/). Cluster identities were verified and refined by comparing top markers to published datasets36,55; markers used to identify each cluster are provided in Table S1. Differentially expressed genes were identified by MAST testing using the FindMarkers function in Seurat. Enriched gene sets were identified by fast gene set enrichment analysis (fgsea) using the Gene Ontology (GO) Biological Processes reference. Pathway scoring was performed using the AddModuleScore function in Seurat using published gene sets36; genes used to calculate pathway scores are provided in Table S2.
qRT-PCR
Irg1 expression was assessed by qRT-PCR. Neutrophils were resuspended in RPMI +10% hiFBS to a concentration of 5 × 10⁵ cells/mL, transferred to Eppendorf tubes in 1 mL aliquots, and infected with LAC at a MOI of 10. The same volume of vehicle (PBS) was added to uninfected controls. The cells were incubated at 37°C. At 4 and 20 h, 500 μL aliquots were centrifuged at 500 xg for 5 min at 4°C. The supernatant was saved for metabolomic analysis (described below) and the cell pellet was processed for RNA isolation.
RNA was isolated using the E.Z.N.A. Total RNA Kit. Cells were incubated in TRK lysis buffer for 10 min at room temperature before adding 70% ethanol. These samples were transferred to E.Z.N.An RNA isolation columns and RNA was isolated following manufacturer’s instructions. DNA was selectively degraded using the DNA-free DNA removal kit and cDNA was generated using a High Capacity cDNA Reverse transcription kit on a SimpliAmp thermocycler (Applied Biosystems). qRT-PCR was performed with PowerUp SYBR Green PCR Mastermix on a StepOnePlus Real-time PCR System (Applied Biosystems) using StepOne. Data were analyzed using the ΔΔCT method using actin as a control housekeeping gene.
Untargeted metabolomics
Itaconate was quantified in BAL and cell culture supernatants by high-resolution mass spectrometry. The metabolites were extracted in a 50% methanol:water (v/v) solution. Sample runs were performed on a Q Exactive HF Hybrid Quadrupole-Orbitrap Mass Spectrometer (Thermo-Fisher) coupled to a Vanquish UHPLC System (Thermo-Fisher). Chromatographic separation was achieved on a Syncronis HILIC UHPLC column (2.1 mm × 100 mm × 1.7um, Thermo-Fisher) using a binary solvent system at a flow rate of 600uL/min. Solvent A, 20mM ammonium formate pH 3.0 in mass spectrometry grade H20; Solvent B, mass spectrometry grade acetonitrile with 0.1% formic acid (%v/v). A sample injection volume of 2uL was used. The mass spectrometer was run in negative full scan mode at a resolution of 240,000 scanning from 50 to 750m/z. Metabolites were identified using the known retention times of standards, and metabolite signals were quantified using E-Maven.
Neutrophil metabolic flux
Metabolic flux was assessed using Agilent Seahorse technology. The XFe24 sensor cartridge was calibrated per the manufacturer’s instructions. Neutrophils were seeded in a Seahorse XF24 well plate, with each well containing 2.5 × 10⁵ cells in 500 μL of XF base medium supplemented with 2 mM glutamine and 0, 1, or 5 mM itaconate (pH-corrected). Each well was inoculated with LAC at a MOI of 10; the same amount of vehicle (PBS) was added to uninfected control wells. The infection was synchronized by centrifuging the plates at 500 xg for 2 min. After a 2-h incubation at 37°C, the OCR and ECAR were measured on a Seahorse XFe24 Analyzer (Agilent Technologies) using Seahorse Wave Desktop.
Neutrophil cell death
Cell death was assessed with an LDH Release Assay. Neutrophils were seeded in 24-well plates, with each well containing 5 × 10⁵ cells in 500 μL of RPMI supplemented with 10% hiFBS and 0, 1, or 5 mM itaconate (pH-corrected), then infected with LAC at a MOI of 10. The same amount of vehicle (PBS) was added to uninfected control wells. At 0, 2, 4, and 6 h after infection at 37°C, 50 μL samples of the cell supernatant were centrifuged at 500 xg for 5 min to remove any cells, then stored at −20°C. The next day, 10 μL of each sample was combined with 100 μL of the LDH Reaction Mix (prepared per kit instructions) in a clear-bottomed 96-well plate, incubated for 30 min at room temperature, and then absorbance at 450 nm was measured on a SpectraMax M2 plate reader. Cytotoxicity was calculated by subtracting the background absorbance of the cell media, then dividing by the absorbance of the high LDH control, which was prepared by freeze-thawing the same number of cells in lysis solution (per kit instructions).
Neutrophil superoxide production (cytochrome c reduction)
Early superoxide production by NADPH oxidase was monitored by cytochrome c reduction. Neutrophils were seeded in 96-well plates, with each well containing 1 × 10⁵ cells in 100 μL of HBSS supplemented with 100 μM ferrocytochrome c from bovine heart and 0, 1, or 5 mM itaconate (pH-corrected). Control wells were supplemented with 10 μM of the NADPH oxidase inhibitor diphenyleneiodonium chloride (DPI). After a 30-min incubation at 37°C, the cells were infected with LAC at a MOI of 10 (including the DPI-supplemented cells); the same amount of vehicle (PBS) was added to uninfected control wells and 1 μM phorbol myristate acetate (PMA) was added to positive control wells. The infection was synchronized by centrifuging the plates at 500 xg for 2 min. After 30 min at 37°C, supernatant absorbance at 550 nm was measured on a SpectraMax M2 plate reader.
Neutrophil bacterial killing
Neutrophils were seeded in 24-well plates, with each well containing 5 × 10⁵ cells in 500 μL of RPMI supplemented with 10% hiFBS and 0, 1, or 5 mM itaconate (pH-corrected), then infected with LAC at a MOI of 10. The same number of bacteria was added to control wells without neutrophils. After 4 h of infection at 37°C, a 100 μL sample from each well was mixed with 900 μL of water+0.1% NP-40. These samples were serially diluted in PBS and plated on LB-agar plates. After overnight incubation, colonies were counted and bacterial killing was calculated relative to the wells with no neutrophils.
Neutrophil phagocytosis
Flow cytometry was used to detect phagocytosis of YFP-expressing LAC. Neutrophils were seeded in 48-well plates, with each well containing 2.5 × 10⁵ cells in 250 μL of RPMI supplemented with 10% hiFBS and 0, 1, or 5 mM itaconate (pH-corrected), then infected with LAC-YFP or LAC-YFP opsonized with autologous serum at a MOI of 10. The same amount of vehicle (PBS) was added to uninfected control wells. To control for bacterial internalization, 10 μg/mL cytochalasin D was added to a second set of infected wells. The infection was synchronized by centrifuging the plates at 500 xg for 2 min. After 1-h at 37°C, non-internalized bacteria were killed by adding 10 U/mL lysostaphin to each well and incubating for another 30 min at 37°C. The cells were washed with PBS and immediately analyzed on the BD LSRII. Gating was performed against uninfected cells.
Lung tissue histopathology
Mice aged 8–10 weeks were infected intranasally with 2 × 10⁷ USA300 LAC in 50 μL phosphate-buffered saline (PBS); PBS alone was administered to mock-infected control animals. 24, 48, or 72 h later the mice were sacrificed, and a canula was inserted into the trachea and tied with suture. The thorax was opened and the lungs were fixed by gentle infusion of formalin-free tissue fixative through the canula from a syringe positioned 5 cm above the mouse. The whole lungs were excised and placed in formalin-free tissue fixative for 24 h before transfer to 70% ethanol. The tissue was paraffinized, and two 5 mm sections were taken 25 mm apart. The slices were then stained with hematoxylin and eosin and scored by a pathologist, who was blinded to the sample identities. Inflammation was scored on a scale of 0–3 (0 = near normal, 1 = mild focal, 2 = moderate focal, 3 = diffuse) in 4 categories: exudate and congestion, edema, alveolar collapse, and bronchiocentric inflammation.
QUANTIFICATION AND STATISTICAL ANALYSIS
Statistical analysis
We determined the numbers of independent experiments required to reach significance based on experimental design, preliminary data, and past experience. scRNA-seq analyses and graphs were done in R using Seurat; all other analyses and graphs were done in Prism. Data are shown as average ±SEM. The following statistical tests were used: Student t-test for comparison of two groups; Student t-test with FDR correction for comparison of two groups across multiple time points or conditions; One-Way ANOVA with a Tukey’s multiple comparisons for comparison of more than two groups. Outliers were removed using the ROUT method. Differences were considered significant when two-sided p value was under 0.05 (p < 0.05); p values and numbers of independent experiments and replicates are provided in each figure legend.
ADDITIONAL RESOURCES
This study does not have additional resources.
Supplementary Material
Highlights.
Itaconate limits bacterial clearance during S. aureus pneumonia
Neutrophils are the main source of itaconate during S. aureus infection
Itaconate impairs neutrophil survival by inhibiting glycolysis
Itaconate impedes neutrophil bacterial killing by inhibiting the oxidative burst
ACKNOWLEDGMENTS
We thank the Single Cell Core at the Columbia University Genome Center and the Molecular Pathology Core at Columbia University for their technical help with scRNA-sequencing and histology studies. K.L.T. is supported by the NIH (1F30AI161801). S.A.R. is supported by the NIH (R35GM146776) and the CFF (RIQUEL21I0). A.S.P. is supported by the NIH (1R35HL135800) and the CFF (003028G221). I.A.L. is supported by the International Microbiome Center and the Canada Foundation for Innovation (CFI-JELF-34986) and the Alberta Innovates Translational Health Chair in Metabolomics. This publication is also supported by the CCTI Flow Cytometry Core at CUIMC (NIH S10RR027050).
INCLUSION AND DIVERSITY
We support inclusive, diverse, and equitable conduct of research.
Footnotes
SUPPLEMENTAL INFORMATION
Supplemental information can be found online at https://doi.org/10.1016/j.celrep.2023.112064.
DECLARATION OF INTERESTS
The authors declare no competing interests.
REFERENCES
- 1.Anjani G, Vignesh P, Joshi V, Shandilya JK, Bhattarai D, Sharma J, and Rawat A (2020). Recent advances in chronic granulomatous disease. Genes Dis. 7, 84–92. 10.1016/j.gendis.2019.07.010. [DOI] [PMC free article] [PubMed] [Google Scholar]
- 2.Yu H-H, Yang Y-H, and Chiang B-L (2021). Chronic granulomatous disease: a comprehensive review. Clin. Rev. Allergy Immunol 61, 101–113. 10.1007/s12016-020-08800-x. [DOI] [PubMed] [Google Scholar]
- 3.Cheung GYC, Bae JS, and Otto M (2021). Pathogenicity and virulence of Staphylococcus aureus. Virulence 12, 547–569. 10.1080/21505594.2021.1878688. [DOI] [PMC free article] [PubMed] [Google Scholar]
- 4.Clauditz A, Resch A, Wieland KP, Peschel A, and Götz F (2006). Staphyloxanthin plays a role in the fitness of Staphylococcus aureus and its ability to cope with oxidative stress. Infect. Immun 74, 4950–4953. 10.1128/IAI.00204-06. [DOI] [PMC free article] [PubMed] [Google Scholar]
- 5.Pelz A, Wieland KP, Putzbach K, Hentschel P, Albert K, and Götz F (2005). Structure and biosynthesis of staphyloxanthin from Staphylococcus aureus. J. Biol. Chem 280, 32493–32498. 10.1074/jbc.M505070200. [DOI] [PubMed] [Google Scholar]
- 6.Clements MO, Watson SP, and Foster SJ (1999). Characterization of the major superoxide dismutase of Staphylococcus aureus and its role in starvation survival, stress resistance, and pathogenicity. J. Bacteriol 181, 3898–3903. 10.1128/JB.181.13.3898-3903.1999. [DOI] [PMC free article] [PubMed] [Google Scholar]
- 7.Mandell GL (1975). Catalase, superoxide dismutase, and virulence of Staphylococcus aureus. In vitro and in vivo studies with emphasis on staphylococcal–leukocyte interaction. J. Clin. Invest 55, 561–566. 10.1172/JCI107963. [DOI] [PMC free article] [PubMed] [Google Scholar]
- 8.Cosgrove K, Coutts G, Jonsson IM, Tarkowski A, Kokai-Kun JF, Mond JJ, and Foster SJ (2007). Catalase (KatA) and alkyl hydroperoxide reductase (AhpC) have compensatory roles in peroxide stress resistance and are required for survival, persistence, and nasal colonization in Staphylococcus aureus. J. Bacteriol 189, 1025–1035. 10.1128/JB.01524-06. [DOI] [PMC free article] [PubMed] [Google Scholar]
- 9.El-Benna J, Hurtado-Nedelec M, Marzaioli V, Marie J-C, Gougerot-Pocidalo M-A, and Dang PM-C (2016). Priming of the neutrophil respiratory burst: role in host defense and inflammation. Immunol. Rev 273, 180–193. 10.1111/imr.12447. [DOI] [PubMed] [Google Scholar]
- 10.Nguyen GT, Green ER, and Mecsas J (2017). Neutrophils to the RO-Scue: mechanisms of NADPH oxidase activation and bacterial resistance. Front. Cell. Infect. Microbiol 7, 373. 10.3389/fcimb.2017.00373. [DOI] [PMC free article] [PubMed] [Google Scholar]
- 11.Mizrahi A, Berdichevsky Y, Ugolev Y, Molshanski-Mor S, Nakash Y, Dahan I, Alloul N, Gorzalczany Y, Sarfstein R, Hirshberg M, and Pick E (2006). Assembly of the phagocyte NADPH oxidase complex: chimeric constructs derived from the cytosolic components as tools for exploring structure-function relationships. J. Leukoc. Biol 79, 881–895. 10.1189/jlb.1005553. [DOI] [PubMed] [Google Scholar]
- 12.Souabni H, Ezzine A, Bizouarn T, and Baciou L (2017). Functional assembly of soluble and membrane recombinant proteins of mammalian NADPH oxidase complex. Methods Mol. Biol 1635, 27–43. 10.1007/978-1-4939-7151-0_2. [DOI] [PubMed] [Google Scholar]
- 13.Amara N, Cooper MP, Voronkova MA, Webb BA, Lynch EM, Koll-man JM, Ma T, Yu K, Lai Z, Sangaraju D, et al. (2021). Selective activation of PFKL suppresses the phagocytic oxidative burst. Cell 184, 4480–4494.e15. 10.1016/j.cell.2021.07.004. [DOI] [PMC free article] [PubMed] [Google Scholar]
- 14.Borregaard N, and Herlin T (1982). Energy metabolism of human neutrophils during phagocytosis. J. Clin. Invest 70, 550–557. 10.1172/jci110647. [DOI] [PMC free article] [PubMed] [Google Scholar]
- 15.Sadiku P, Willson JA, Ryan EM, Sammut D, Coelho P, Watts ER, Grecian R, Young JM, Bewley M, Arienti S, et al. (2021). Neutrophils fuel effective immune responses through gluconeogenesis and glycogenesis. Cell Metab. 33, 411–423.e4. 10.1016/j.cmet.2020.11.016. [DOI] [PMC free article] [PubMed] [Google Scholar]
- 16.Mills E, and O’Neill LAJ (2014). Succinate: a metabolic signal in inflammation. Trends Cell Biol. 24, 313–320. 10.1016/j.tcb.2013.11.008. [DOI] [PubMed] [Google Scholar]
- 17.Tannahill GM, Curtis AM, Adamik J, Palsson-Mcdermott EM, McGettrick AF, Goel G, Frezza C, Bernard NJ, Kelly B, Foley NH, et al. (2013). Succinate is an inflammatory signal that induces IL-1β through HIF-1α. Nature 496, 238–242. 10.1038/nature11986. [DOI] [PMC free article] [PubMed] [Google Scholar]
- 18.O’Neill LAJ, and Artyomov MN (2019). Itaconate: the poster child of metabolic reprogramming in macrophage function. Nat. Rev. Immunol 19, 273–281. 10.1038/s41577-019-0128-5. [DOI] [PubMed] [Google Scholar]
- 19.Ryan DG, and O’Neill LAJ (2020). Krebs cycle reborn in macrophage immunometabolism. Annu. Rev. Immunol 38, 289–313. 10.1146/annurev-immunol-081619-104850. [DOI] [PubMed] [Google Scholar]
- 20.Bambouskova M, Gorvel L, Lampropoulou V, Sergushichev A, Loginicheva E, Johnson K, Korenfeld D, Mathyer ME, Kim H, Huang L-H, et al. (2018). Electrophilic properties of itaconate and derivatives regulate the IκBζ–ATF3 inflammatory axis. Nature 556, 501–504. 10.1038/s41586-018-0052-z. [DOI] [PMC free article] [PubMed] [Google Scholar]
- 21.Bambouskova M, Potuckova L, Paulenda T, Kerndl M, Mogilenko DA, Lizotte K, Swain A, Hayes S, Sheldon RD, Kim H, et al. (2021). Itaconate confers tolerance to late NLRP3 inflammasome activation. Cell Rep. 34, 108756. 10.1016/j.celrep.2021.108756. [DOI] [PMC free article] [PubMed] [Google Scholar]
- 22.Cordes T, Wallace M, Michelucci A, Divakaruni AS, Sapcariu SC, Sousa C, Koseki H, Cabrales P, Murphy AN, Hiller K, and Metallo CM (2016). Immunoresponsive gene 1 and itaconate inhibit succinate dehydrogenase to modulate intracellular succinate levels. J. Biol. Chem 291, 14274–14284. 10.1074/jbc.m115.685792. [DOI] [PMC free article] [PubMed] [Google Scholar]
- 23.Hooftman A, Angiari S, Hester S, Corcoran SE, Runtsch MC, Ling C, Ruzek MC, Slivka PF, McGettrick AF, Banahan K, et al. (2020). The immunomodulatory metabolite itaconate modifies NLRP3 and inhibits inflammasome activation. Cell Metab. 32, 468–478.e7. 10.1016/j.cmet.2020.07.016. [DOI] [PMC free article] [PubMed] [Google Scholar]
- 24.Lampropoulou V, Sergushichev A, Bambouskova M, Nair S, Vincent EE, Loginicheva E, Cervantes-Barragan L, Ma X, Huang SCC, Griss T, et al. (2016). Itaconate links inhibition of succinate dehydrogenase with macrophage metabolic remodeling and regulation of inflammation. Cell Metab. 24, 158–166. 10.1016/j.cmet.2016.06.004. [DOI] [PMC free article] [PubMed] [Google Scholar]
- 25.Liao S-T, Han C, Xu D-Q, Fu X-W, Wang J-S, and Kong L-Y (2019). 4-Octyl itaconate inhibits aerobic glycolysis by targeting GAPDH to exert anti-inflammatory effects. Nat. Commun 10, 5091. 10.1038/s41467-019-13078-5. [DOI] [PMC free article] [PubMed] [Google Scholar]
- 26.Mills EL, Ryan DG, Prag HA, Dikovskaya D, Menon D, Zaslona Z, Jedrychowski MP, Costa ASH, Higgins M, Hams E, et al. (2018). Itaconate is an anti-inflammatory metabolite that activates Nrf2 via alkylation of KEAP1. Nature 556, 113–117. 10.1038/nature25986. [DOI] [PMC free article] [PubMed] [Google Scholar]
- 27.Qin W, Qin K, Zhang Y, Jia W, Chen Y, Cheng B, Peng L, Chen N, Liu Y, Zhou W, et al. (2019). S-glycosylation-based cysteine profiling reveals regulation of glycolysis by itaconate. Nat. Chem. Biol 15, 983–991. 10.1038/s41589-019-0323-5. [DOI] [PubMed] [Google Scholar]
- 28.Swain A, Bambouskova M, Kim H, Andhey PS, Duncan D, Auclair K, Chubukov V, Simons DM, Roddy TP, Stewart KM, and Artyomov MN (2020). Comparative evaluation of itaconate and its derivatives reveals divergent inflammasome and type I interferon regulation in macrophages. Nat. Metab 2, 594–602. 10.1038/s42255-020-0210-0. [DOI] [PMC free article] [PubMed] [Google Scholar]
- 29.Runtsch MC, Angiari S, Hooftman A, Wadhwa R, Zhang Y, Zheng Y, Spina JS, Ruzek MC, Argiriadi MA, McGettrick AF, et al. (2022). Itaconate and itaconate derivatives target JAK1 to suppress alternative activation of macrophages. Cell Metab. 34, 487–501.e8. 10.1016/j.cmet.2022.02.002. [DOI] [PubMed] [Google Scholar]
- 30.Yi Z, Deng M, Scott MJ, Fu G, Loughran PA, Lei Z, Li S, Sun P, Yang C, Li W, et al. (2020). IRG1/Itaconate activates Nrf2 in hepatocytes to protect against liver ischemia-reperfusion injury. Hepatology 72, 1394–1411. 10.1002/hep.31147. [DOI] [PMC free article] [PubMed] [Google Scholar]
- 31.Riquelme SA, Liimatta K, Wong Fok Lung T, Fields B, Ahn D, Chen D, Lozano C, Sáenz Y, Uhlemann AC, Kahl BC, et al. (2020). Pseudomonas aeruginosa utilizes host-derived itaconate to redirect its metabolism to promote biofilm formation. Cell Metab. 31, 1091–1106.e6. 10.1016/j.cmet.2020.04.017. [DOI] [PMC free article] [PubMed] [Google Scholar]
- 32.Riquelme SA, Lozano C, Moustafa AM, Liimatta K, Tomlinson KL, Britto C, Khanal S, Gill SK, Narechania A, Azcona-Gutiérrez JM, et al. (2019). CFTR-PTEN-dependent mitochondrial metabolic dysfunction promotes Pseudomonas aeruginosa airway infection. Sci. Transl. Med 11, eaav4634. 10.1126/scitranslmed.aav4634. [DOI] [PMC free article] [PubMed] [Google Scholar]
- 33.Wong Fok Lung T, Charytonowicz D, Beaumont KG, Shah SS, Sridhar SH, Gorrie CL, Mu A, Hofstaedter CE, Varisco D, McConville TH, et al. (2022). Klebsiella pneumoniae induces host metabolic stress that promotes tolerance to pulmonary infection. Cell Metab. 34, 761–774.e9. 10.1016/j.cmet.2022.03.009. [DOI] [PMC free article] [PubMed] [Google Scholar]
- 34.Tomlinson KL, Lung TWF, Dach F, Annavajhala MK, Gabryszewski SJ, Groves RA, Drikic M, Francoeur NJ, Sridhar SH, Smith ML, et al. (2021). Staphylococcus aureus induces an itaconate-dominated immunometabolic response that drives biofilm formation. Nat. Commun 12, 1399. 10.1038/s41467-021-21718-y. [DOI] [PMC free article] [PubMed] [Google Scholar]
- 35.Luan HH, and Medzhitov R (2016). Food fight: role of itaconate and other metabolites in antimicrobial defense. Cell Metab. 24, 379–387. 10.1016/j.cmet.2016.08.013. [DOI] [PMC free article] [PubMed] [Google Scholar]
- 36.Xie X, Shi Q, Wu P, Zhang X, Kambara H, Su J, Yu H, Park S-Y, Guo R, Ren Q, et al. (2020). Single-cell transcriptome profiling reveals neutrophil heterogeneity in homeostasis and infection. Nat. Immunol 21, 1119–1133. 10.1038/s41590-020-0736-z. [DOI] [PMC free article] [PubMed] [Google Scholar]
- 37.Xu J, He B, Carver K, Vanheyningen D, Parkin B, Garmire LX, Olszewski MA, and Deng JC (2021). ScRNA-Seq study of neutrophils reveals vast heterogeneity and breadth of inflammatory responses in severe COVID-19 patients. Preprint at bioRxiv. 10.1101/2021.12.01.470817. [DOI] [Google Scholar]
- 38.Wigerblad G, Cao Q, Brooks S, Naz F, Gadkari M, Jiang K, Gupta S, O’Neil L, Dell’Orso S, Kaplan MJ, and Franco LM (2022). Single-cell analysis reveals the range of transcriptional states of circulating human neutrophils. Preprint at bioRxiv. 10.1101/2022.02.22.481522. [DOI] [PMC free article] [PubMed] [Google Scholar]
- 39.Schulz A, Jiang L, De Vor L, Ehrström M, Wermeling F, Eidsmo L, and Melican K (2019). Neutrophil recruitment to noninvasive MRSA at the stratum corneum of human skin mediates transient colonization. Cell Rep. 29, 1074–1081.e5. 10.1016/j.celrep.2019.09.055. [DOI] [PubMed] [Google Scholar]
- 40.Puerta-Arias JD, Pino-Tamayo PA, Arango JC, and González Á (2016). Depletion of neutrophils promotes the resolution of pulmonary inflammation and fibrosis in mice infected with paracoccidioides brasiliensis. PLoS One 11, e0163985. 10.1371/journal.pone.0163985. [DOI] [PMC free article] [PubMed] [Google Scholar]
- 41.Qin W, Zhang Y, Tang H, Liu D, Chen Y, Liu Y, and Wang C (2020). Chemoproteomic profiling of itaconation by bioorthogonal probes in inflammatory macrophages. J. Am. Chem. Soc 142, 10894–10898. 10.1021/jacs.9b11962. [DOI] [PubMed] [Google Scholar]
- 42.Abuaita BH, Sule GJ, Schultz TL, Gao F, Knight JS, and O’Riordan MX (2021). The IRE1alpha stress signaling Axis is a key regulator of neutrophil antimicrobial effector function. J. Immunol 207, 210–220. 10.4049/jimmunol.2001321. [DOI] [PMC free article] [PubMed] [Google Scholar]
- 43.Rigby KM, and DeLeo FR (2012). Neutrophils in innate host defense against Staphylococcus aureus infections. Semin. Immunopathol 34, 237–259. 10.1007/s00281-011-0295-3. [DOI] [PMC free article] [PubMed] [Google Scholar]
- 44.Spaan AN, Surewaard BGJ, Nijland R, and van Strijp JAG (2013). Neutrophils versus Staphylococcus aureus: a biological tug of war. Annu. Rev. Microbiol 67, 629–650. 10.1146/annurev-micro-092412-155746. [DOI] [PubMed] [Google Scholar]
- 45.de Jong NWM, van Kessel KPM, and van Strijp JAG (2019). Immune evasion by Staphylococcus aureus. Microbiol. Spectr 7. 10.1128/microbiolspec.GPP3-0061-2019. [DOI] [PMC free article] [PubMed] [Google Scholar]
- 46.Guerra FE, Borgogna TR, Patel DM, Sward EW, and Voyich JM (2017). Epic immune battles of history: neutrophils vs. Staphylococcus aureus. Front. Cell. Infect. Microbiol 7, 286. 10.3389/fcimb.2017.00286. [DOI] [PMC free article] [PubMed] [Google Scholar]
- 47.McGuinness WA, Kobayashi SD, and DeLeo FR (2016). Evasion of neutrophil killing by Staphylococcus aureus. Pathogens 5, 32. 10.3390/pathogens5010032. [DOI] [PMC free article] [PubMed] [Google Scholar]
- 48.Nair S, Huynh JP, Lampropoulou V, Loginicheva E, Esaulova E, Gounder AP, Boon ACM, Schwarzkopf EA, Bradstreet TR, Edelson BT, et al. (2018). Irg1 expression in myeloid cells prevents immuno-pathology during M. tuberculosis infection. J. Exp. Med 215, 1035–1045. 10.1084/jem.20180118. [DOI] [PMC free article] [PubMed] [Google Scholar]
- 49.Bomfim CCB, Fisher L, Amaral EP, Mittereder L, McCann K, Correa AAS, Namasivayam S, Swamydas M, Moayeri M, Weiss JM, et al. (2022). Mycobacterium tuberculosis induces Irg1 in murine macrophages by a pathway involving both TLR-2 and STING/IFNAR signaling and requiring bacterial phagocytosis. Front. Cell. Infect. Microbiol 12, 862582. 10.3389/fcimb.2022.862582. [DOI] [PMC free article] [PubMed] [Google Scholar]
- 50.Monk IR, Shaikh N, Begg SL, Gajdiss M, Sharkey LKR, Lee JYH, Pidot SJ, Seemann T, Kuiper M, Winnen B, et al. (2019). Zinc-binding to the cytoplasmic PAS domain regulates the essential WalK histidine kinase of Staphylococcus aureus. Nat. Commun 10, 3067. 10.1038/s41467-019-10932-4. [DOI] [PMC free article] [PubMed] [Google Scholar]
- 51.Ge C, Monk IR, Monard SC, Bedford JG, Braverman J, Stinear TP, and Wakim LM (2020). Neutrophils play an ongoing role in preventing bacterial pneumonia by blocking the dissemination of Staphylococcus aureus from the upper to the lower airways. Immunol. Cell Biol 98, 577–594. 10.1111/imcb.12343. [DOI] [PubMed] [Google Scholar]
- 52.Monk IR, and Stinear TP (2021). From cloning to mutant in 5 days: rapid allelic exchange in Staphylococcus aureus. Access Microbiol. 3, 000193. 10.1099/acmi.0.000193. [DOI] [PMC free article] [PubMed] [Google Scholar]
- 53.Hafemeister C, and Satija R (2019). Normalization and variance stabilization of single-cell RNA-seq data using regularized negative binomial regression. Genome Biol. 20, 296. 10.1186/s13059-019-1874-1. [DOI] [PMC free article] [PubMed] [Google Scholar]
- 54.Aran D, Looney AP, Liu L, Wu E, Fong V, Hsu A, Chak S, Naikawadi RP, Wolters PJ, Abate AR, et al. (2019). Reference-based analysis of lung single-cell sequencing reveals a transitional profibrotic macrophage. Nat. Immunol 20, 163–172. 10.1038/s41590-018-0276-y. [DOI] [PMC free article] [PubMed] [Google Scholar]
- 55.Angelidis I, Simon LM, Fernandez IE, Strunz M, Mayr CH, Greiffo FR, Tsitsiridis G, Ansari M, Graf E, Strom T-M, et al. (2019). An atlas of the aging lung mapped by single cell transcriptomics and deep tissue proteomics. Nat. Commun 10, 963. 10.1038/s41467-019-08831-9. [DOI] [PMC free article] [PubMed] [Google Scholar]
Associated Data
This section collects any data citations, data availability statements, or supplementary materials included in this article.
Supplementary Materials
Data Availability Statement
All data discussed in this study are presented in the published article and its supplementary files. Single-cell RNA-seq data have been deposited at NIH Gene Expression Omnibus (GEO: GSE215195) and are publicly available as of the date of publication. Accession numbers are listed in the key resources table. No original code was developed for this study. Any additional information required to reanalyze the data reported in this paper is available from the lead contact upon request.
KEY RESOURCES TABLE
| REAGENT or RESOURCE | SOURCE | IDENTIFIER |
|---|---|---|
| Antibodies | ||
| anti-Ly6G clone 1A8 | BioXCell | BE0075-1 |
| isotype control clone 2A3 | BioXCell | BE0089 |
| anti-CD45-AF700 | BioLegend | 103127 |
| anti-CD11b-AF594 | BioLegend | 101254 |
| anti-CD11c-Bv605 | BioLegend | 117334 |
| anti-SiglecF-APC-Cy7 | BD Biosciences | 565527 |
| anti-Epcam-FITC | BioLegend | 118207 |
| anti-F4/80-Pe-Cy7 | BioLegend | 123114 |
| anti-Ly6C-Bv421 | BioLegend | 128032 |
| anti-Ly6G-PerCp-Cy5.5 | BioLegend | 127616 |
| Bacterial and virus strains | ||
| USA300 LAC | Our laboratory | N/A |
| USA300 LAC-YFP | This study | N/A |
| Chemicals, peptides, and recombinant proteins | ||
| Luria Bertani Broth | Becton Dickinson | 244610 |
| Agar | Sigma | 400400010 |
| Chloramphenicol | Sigma | C-0378 |
| eBioscience RBC Lysis Buffer | Invitrogen | 00-4333-57 |
| autoMACS Rinsing Solution | MACS Miltenyi | 130-091-222 |
| Bovine Serum Albumin | MACS Miltenyi | 130-091-376 |
| RPMI 1640 with L-glutamine | Corning | 10-040-CV |
| Fetal Bovine Serum | Sigma | F4135 |
| Itaconate | Aldrich | 129204 |
| Sodium Hydroxide | Fisher Scientific | SS-2661 |
| LIVE/DEAD Stain | Invitrogen | L23105A |
| Paraformaldehyde | Electron Microscopy Sciences | 15714-S |
| Collagenase I | Gibco | 17100-017 |
| Dispase | Gibco | 17105-041 |
| Elastase | Worthington | LS006365 |
| DNAse | Invitrogen | 2224G |
| PowerUp SYBR Green PCR Mastermix | Applied Biosystems | A25742 |
| Methanol | Alpha Aesar | 22909 |
| XF Base Medium | Agilent | 102353-100 |
| Glutamine | LifeLine | LS-1031 |
| HBSS | Corning | 21-023-CV |
| Ferrocytochrome C from Bovine Heart | Millipore Sigma | C3131 |
| Diphenyleneiodonium Chloride | Millipore-Sigma | D2926 |
| Phorbol Myristate Acetate | Sigma-Aldrich | P8139 |
| NP-40 | Thermo Scientific | 28324 |
| Cytochalasin D | Sigma-Aldrich | C8273 |
| Lysostaphin | Sigma-Aldrich | L7386 |
| Formalin-Free tissue Fixative | Sigma | A5472 |
| Critical commercial assays | ||
| MACS Miltenyi Mouse Neutrophil Isolation kit | MACS Miltenyi | 130-097-658 |
| Mouse Cytokine Proinflammatory Focused 10-plex Discovery Assay | Eve Technologies | MDF10 |
| Mouse Cytokine/Chemokine 31-plex Discovery Assay | Eve Technologies | MD31 |
| E.Z.N.A. Total RNA Kit | Omega Bio-tek | R6834-02 |
| DNA-free DNA removal kit | Fisher Scientific | AM1906 |
| High Capacity cDNA Reverse transcription kit | Applied Biosystems | 43688-14 |
| LDH Release Assay | Abcam | ab65393 |
| Albumin (BCG) Assay Kit (Colorimetric) | Abcam | ab235628 |
| Deposited data | ||
| Raw and Analyzed scRNA-Seq Data | This study | GEO: GSE215195 |
| Experimental models: Organisms/strains | ||
| Irg1−/− C57BL/6NJ mice | Jackson Laboratories | 029340 |
| WT C57BL/6NJ mice | Jackson Laboratories | 005304 |
| Oligonucleotides | ||
| Mouse Irg1 F: CGTGAGAAAGCACCTTGTGA |
This study | N/A |
| Mouse Irg1 R: CTGTGGAAGGATGGGACAGT |
This study | N/A |
| Mouse actin F: AGCCATGTACGTAGCCATCC |
This study | N/A |
| Mouse actin R: CTCTCAGCTGTGGTGGTGAA |
This study | N/A |
| Software and algorithms | ||
| FlowJo v10 | FlowJo | https://www.flowjo.com/ |
| FACSDiva v9 | BD Biosciences | https://www.bdbiosciences.com/en-us/products/software/instrument-software/bd-facsdiva-software |
| Cell Ranger | 10X Genomics | https://support.10xgenomics.com/single-cell-gene-expression/software/pipelines/latest/what-is-cell-ranger |
| Seurat v4.0.4 | Satija Laboratory | https://satijalab.org/seurat/ |
| R v4.1.1 | R Project | https://www.r-project.org/ |
| StepOne v2.3 | ThermoFisher | https://www.thermofisher.com/us/en/home/technical-resources/software-downloads/StepOne-and-StepOnePlus-Real-Time-PCR-System.html |
| E-Maven v0.10.0 | Rabinowitz Laboratory | http://maven.princeton.edu/index.php |
| Seahorse Wave Desktop v2.6.0 | Agilent | https://www.agilent.com/en/product/cell-analysis/real-time-cell-metabolic-analysis/xf-software/seahorse-wave-desktop-software-740897 |
| Prism v9.2.0 | GraphPad | https://www.graphpad.com/scientific-software/prism/ |
| Other | ||
| LS Column | MACS Miltenyi | 130-042-401 |
| MidiMACS Separator magnet | MACS Miltenyi | 130-042-302 |
| 40 μm cell strainers | Falcon | 352340 |
| 70 μm cell strainers | CELLTREAT | 229483 |
| XFe24 sensor cartridge | Agilent | 102340-100 |
| XF24 well plate | Agilent | 102340-100 |