Abstract
Background/aim
Intercity travel is one of the most important parameters for combating a pandemic. The ongoing COVID-19 pandemic has resulted in different computational studies involving intercity connections. In this study, the effects of intercity connections during an epidemic such as COVID-19 are evaluated using a new network model.
Materials and methods
This model considers the actual geographic neighborhood and population density data. This new model is applied to actual Turkish data by means of provincial connections and populations. A Monte Carlo algorithm with a hybrid lattice model is applied to a lattice with 8802 data points.
Results
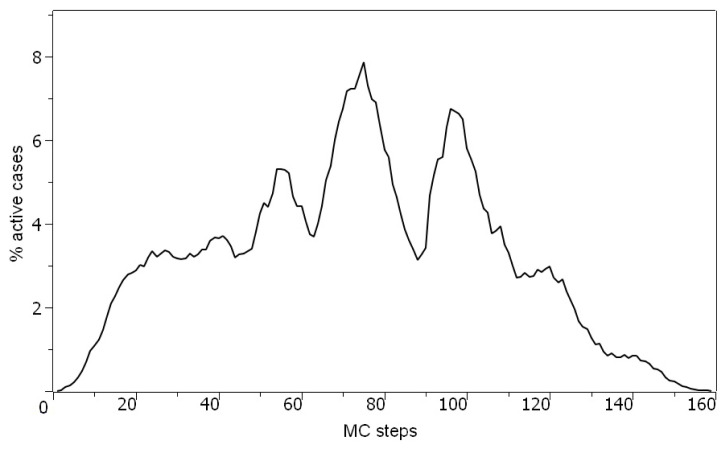
Around Monte Carlo step 70, the number of active cases in Türkiye reaches up to 8.0% of the total population, which is followed by a second wave at around Monte Carlo step 100. The number of active cases vanishes around Monte Carlo step 160. Starting with İstanbul, the epidemic quickly expands between steps 60 and 100. Simulation results fit the actual mortality data in Türkiye.
Conclusion
This model is quantitatively very efficient in modeling real-world COVID-19 epidemic data based on populations and geographical intercity connections, by means of estimating the number of deaths, disease spread, and epidemic termination.
Keywords: Monte Carlo simulation, epidemic, geographical model, susceptible-infected-quarantine-recovered model, COVID-19
1. Introduction
The coronavirus disease 2019 (COVID-19) pandemic is caused by the severe acute respiratory syndrome coronavirus 2 (SARS-CoV-2). The use of several vaccination measures, such as CoronaVac (Sinovac Biotech, China), Sputnik V (Gamaleya Research Institute of Epidemiology and Microbiology, Russia), Comirnaty (Pfizer-BioNTech, Germany), and Turkovac (Health Institutes of Türkiye and Erciyes University, Türkiye), has reduced the effects of the pandemic [1]. However, it is still considered to be ongoing and has caused societal impacts, including in urban areas. The complexity of the pandemic has been compounded by the interconnected nature of societal activities.
During the pandemic, indication to vaccine development [1], many countries adapted different methods to combat this disease. These include improved hygiene measures, vaccination, curfews, and full quarantines. Türkiye is among the countries which applied full quarantines followed by curfews on weekends. Among the precautions, intercity travel was restricted and subject to special permission as one of the measures to combat disease transmission given the spatial diffusion patterns through intercity mobility [2].
Many scientists and research groups conduct their studies using in silico methods (experimental simulations performed on computers) of genetic analysis [3,4]. Computation methods also include the epidemiological simulation. Two main approaches followed in the literature are fitting the clinical data with various mathematical models and the simulation of the epidemic with various mathematical models [5]. Previously, several studies on modeling infectious diseases have been reported [6–10]. Among the simulation methods, Monte Carlo (MC) simulation is an effective method [11]. Currently, various MC studies are present for COVID-19 simulation. These include analyzing different scenarios for selected countries [12], age-structured mobility data for simulation of the pandemic spread in selected cities [13], random-walk proximity-based infection spread [14], and observing the effect of weekend curfews [15].
Travel restrictions are among the first emergency measures [16] during epidemics. Intercity travel models on epidemic spreading can be modeled using the well-known small-world networks [17] and recent papers report such simulations [18]. Big data analytics have been used to compare mobility patterns during the pandemic in Finland [19] while other studies have focused on the impacts of the pandemic on public transport [20]. Moreover, the most recent report of the Intergovernmental Panel on Climate Change underlined the impacts of the pandemic on society, including the transport sector [21].
This paper discusses the effects of intercity travel during a pandemic, such as COVID-19, using a new model network on a selected country (Türkiye) by considering the actual geographic neighborhood and population density data. The spread of the disease was modeled using a hybrid of susceptible, infected, quarantine, and recovered (SIQR) [22–24] lattice model [25] and spin-1 Ising model [26,27], which was previously reported in our recent paper [15]. The present study addresses the gap in the literature for coupling actual geographic neighborhood and population density data with a hybrid lattice model.
2. Methods
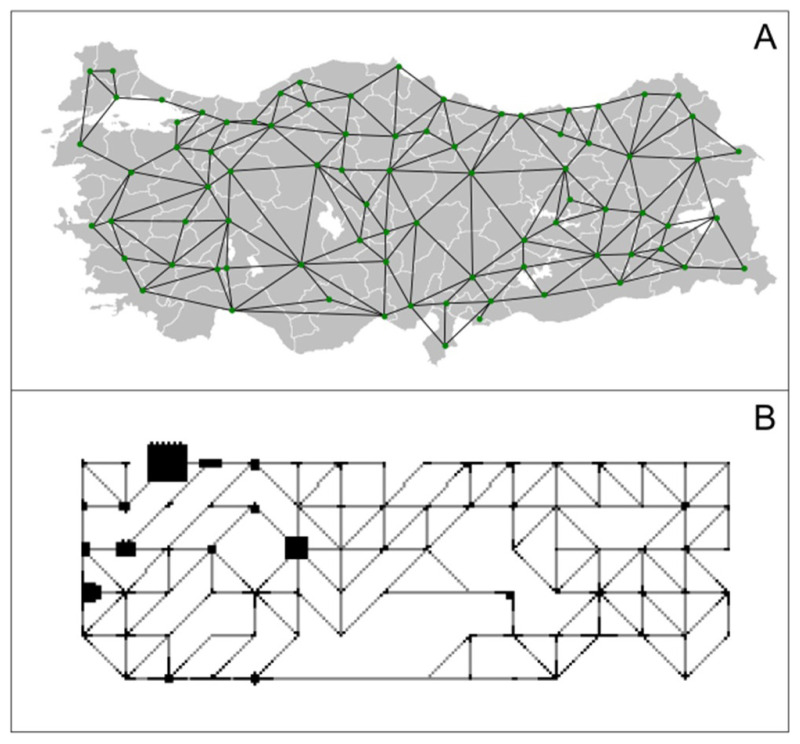
The MC model used in this study is written in the Python language by the authors. A lattice model with 8802 data points was generated using the map of Türkiye, taking into consideration the neighborhoods of provincial centers and population densities. Figure 1A shows the lattice model based on the provincial centers of Türkiye and Figure 1B indicates the population-weighted version of the one-to-one same lattice, where provinces with more population are represented with bigger lattice blocks. The lattice shown in Figure 1B is considered in further simulations.
Figure 1.
Lattice model based on the provincial neighborhoods overlaid on the map of Türkiye (A) and population weighted lattice of the same lattice (B).
Provinces with bigger population are shown in bigger lattice blocks, where the actual population data was obtained from the Turkish Statistical Institute.1 The network is generated on an Ising-like model where the persons are placed on lattice points. The number of people in each block (city) in the matrix has been assigned according to their ratio in the total Turkish population. On the border of each town, there are roads that provide intercity connections. These are designed as connections between square-shaped population blocks. The connections are unpopulated; however, they can transmit the disease to a person in the neighboring town. For each person in the network, five different states are possible: Healthy (susceptible), positive, sick (under quarantine), recovered, and deceased. Each person is represented in the lattice as integers, and the cases mentioned above are assigned as 1, 2, 3, 4, and 5 (deceased), respectively. In the algorithm, calculations and decisions are made based on the values of each data point. For example, if the value of the lattice point is 3, the movement of this particle is neglected since this case is considered to be quarantine. Unpopulated parts in the total lattice are assigned as forbidden lattice points.
For the MC simulation, persons in the lattices are randomly selected and assigned a random possible direction for the movement. Firstly, neighbors (i.e. side neighbors including intercity connections and corner neighbors on the square lattice) are checked for contamination with probability P. Secondly, the selected person moves in the selected direction with probability P. If the selected direction contains a person, this happens by person interchange.
One MC step in this simulation is defined as considering all particles in the lattice for infection and movement. The simulation considers the following scenario: At step 0, a random person gets positive (patient zero) in İstanbul (since it is the largest city with arguably the largest cosmopolitan connections) and starts spreading the disease. Once a person gets into contact with the virus, the person can remain in quarantine with a probability of Pquarantine = 0.33 or be recovered with a probability of Precovery = 0.33 at each MC Step. A sick person under quarantine cannot move and cannot spread the disease, removing the probability of movement and infection for this lattice points. Persons under quarantine recover with a probability of Ptreatment = 0.995 or is deceased with probability 1-Ptreatment, after 7 MC steps. This ratio is arranged according to total mortality rate of COVID-19 in Türkiye (approximately 0.005). For each person, a random number is generated in the script and if this random number is bigger than the probability P, the related event occurs. In this model, no lockdowns are considered.
3. Results
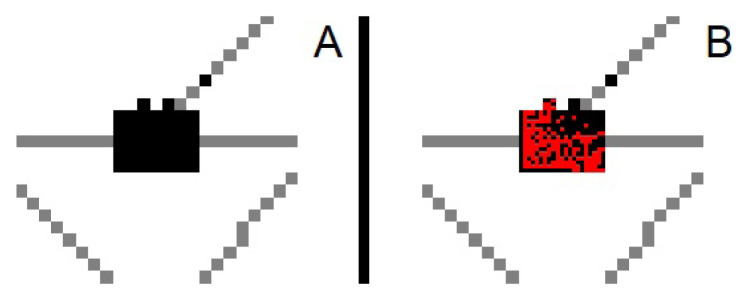
Figure 2 shows the virus spread in Bursa on days 0 and 50, respectively. Persons with the disease are marked with red.
Figure 2.
Spread of the disease in Bursa a) day 0, b) day 50.
The result of the epidemic is tested using the susceptible, infected, in quarantine, and recovered (SIQR) model, which was previously applied for COVID-19 [28].
Figure 3 shows the active positive cases in the simulation. Around MC step 70, the number of active cases in Türkiye reaches up to 8.0% of the total population, followed by a second wave around MC step 100, around 7.0%. After this second wave, the number of active cases decreases and reaches down to 0 around MC step 160.
Figure 3.
Number of active cases (as a percentage of population) in this model.
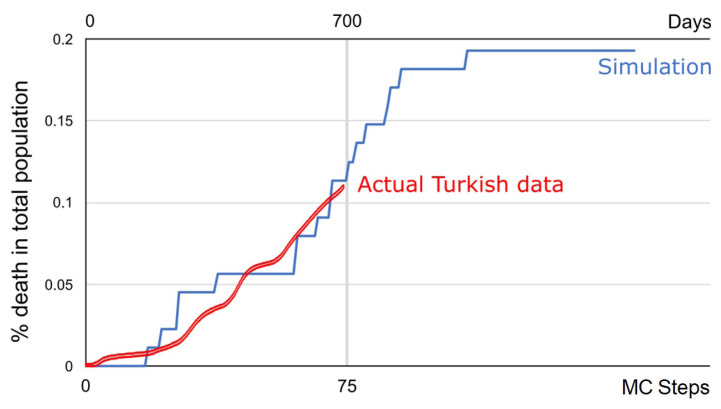
Among the different epidemic measures, the primary goal is to reduce the number of deaths. The number of deaths for Türkiye from the beginning of the pandemic is compared with the simulation data and is shown in Figure 4, by means of day-percentage of death to the total population. Real-world data was obtained from Worldometer.2
Figure 4.
Percentage of deaths due to COVID-19, simulation compared with real Turkish data.
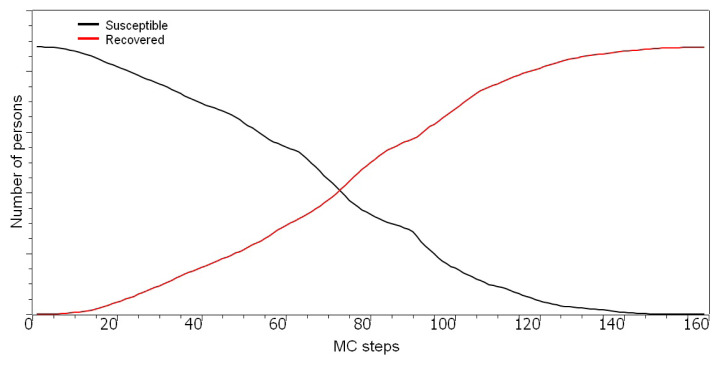
Results show that the simulation fits real-world data well and can be used as an efficient tool to predict the number of deaths. Another important outcome is that ten MC steps of the simulation are around one real-time day. This implies that the population density-based lattice of Turkish provinces is effective in modeling the real data. Numbers of healthy and susceptible individuals are also provided in Figure 5.
Figure 5.
Number of healthy (susceptible) and recovered individuals over MC steps.
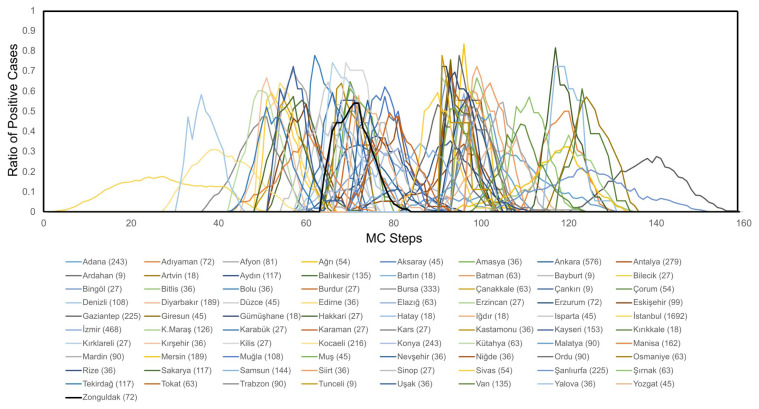
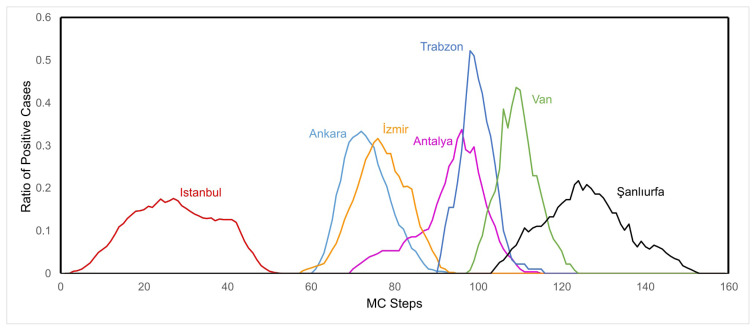
Another subject examined in this study is the spread of diseases in different provinces of Türkiye. In order to visualize the spread of the disease, the percentage of positive cases (quarantined and nonquarantined) in the province was evaluated for each block (province) and the results for 81 Turkish provinces are shown in Figure 6. Starting with İstanbul, the epidemic quickly expands into most provinces between MC steps 60 and 100. Seven selected provinces from seven geographical regions of Türkiye are also examined for highlighting the spread of epidemic in different regions (in Figure 7). It is shown that the spread vanishes at the Southeastern Anatolia Region around MC step 160.
Figure 6.
Spread of the epidemic in 81 Turkish provinces (names and number of persons in each province are shown below the plot).
Figure 7.
Spread of the epidemic in seven cities of seven geographical regions of Türkiye.
4. Discussion
In this model, the infectivity and the mortality of the virus are constant, which means there are no variants of the initial virus. In addition, vaccination is neglected, which assumes that the entire population has the same level of immunity to the virus. Under these circumstances, the epidemic in Türkiye extinguishes on 160 MC steps. Currently, the pandemic continues, but daily active cases are about to run out around the date the article is written.
COVID-19 epidemic simulations at the local and national level are among the important contributions to the fight against the pandemic. A recent study which simulates the COVID-19 outbreak in Bogotá, Colombia uses an extension of a compartmental susceptible-exposed-infected-recovered model with random perturbations and is found to be robust in projecting the numbers in this case [29]. Resurgence of COVID-19 in Chinese local communities were also studied using a similar method [30,31]. Another recent study revealed the results of a spatio-temporal simulation based on big data and gravity model in Guangzhou, China, where the simulation is able to identify different transmission patterns which are dependent on the urban spatial structure [31]. Although obtaining real data for these kinds of studies is a limitation in the beginning, all of these studies are found to be important for policymakers to make reliable and fast interventions during combating the pandemic.
Another significance of this study is that it presents an approach to the modeling of geographic connections and information such as population. In the case of Turkey, besides the fact that the epidemic occurred in large centers such as Ankara, İstanbul, and İzmir, its impact on smaller cities in terms of population has also been discussed. In a more detailed analysis, adding districts and even rural centers to the design will probably give a more accurate result, but this time there will be additional requirements to construct such a geographic model in a 2-dimensional matrix. As a future study, transportation connections, population density, and even working hours in a selected settlement (district) can be included in the simulation.
In conclusion, in this study, a novel approach to COVID-19 epidemic simulation was conducted and tested on epidemic data in Türkiye. This model uses the provincial neighborhood and population data. A hybrid MC algorithm ensured a very efficient modeling of the epidemic by means of growth time and number of deaths. Further studies can reveal this model in different countries, as well as the effects of different prevention measures, such as different types of vaccines, travel bans, and curfews. The coupling of spatiotemporal datasets with the hybrid lattice model is promising of numerous other advances in the field.
Acknowledgments
We thank F. Bedia Erim for a critical reading of our manuscript. A. Nihat Berker gratefully acknowledges support by Turkish Academy of Sciences (TÜBA).
Footnotes
Turkish Statistical Institute (2021). Address Based Population Registration System Results [online]. Website https://data.tuik.gov.tr/Bulten/Index?p=Adrese-Dayali-Nufus-Kayit-Sistemi-Sonuclari-2021-45500 [accessed 14 May 2022].
Worldometer (2022). Turkey COVID - Coronavirus Statistics [online]. Website https://www.worldometers.info/coronavirus/country/turkey [accessed 14 May 2022].
References
- 1. Mandal H. Achievements of the COVID-19 Turkey Platform in vaccine and drug development with an approach of “co-creation and succeeding together. ” Turkish Journal of Medical Sciences. 2021;51(SI-1):3139–3149. doi: 10.3906/sag-2112-178. [DOI] [PMC free article] [PubMed] [Google Scholar]
- 2. Gu L, Yang L, Wang L, Guo Y, Wei B, Li H. Understanding the spatial diffusion dynamics of the COVID-19 pandemic in the city system in China. Social Science and Medicine. 2022;302:114988. doi: 10.1016/j.socscimed.2022.114988. [DOI] [PMC free article] [PubMed] [Google Scholar]
- 3. Uğurel OM, Ata O, Turgut-Balık D. An updated analysis of variations in SARS-CoV-2 genome. Turkish Journal of Biology. 2020;44(SI-1):157–167. doi: 10.3906/biy-2005-111. [DOI] [PMC free article] [PubMed] [Google Scholar]
- 4. Eskier D, Akalp E, Dalan Ö, Karakülah G, Oktay Y. Current mutatome of sars-cov-2 in turkey reveals mutations of interest. Turkish Journal of Biology. 2021;45(1):104–113. doi: 10.3906/biy-2008-56. [DOI] [PMC free article] [PubMed] [Google Scholar]
- 5. Maltezos S, Georgakopoulou A. Novel approach for Monte Carlo simulation of the new COVID-19 spread dynamics. Infection, Genetics and Evolution. 2021;92:104896. doi: 10.1016/j.meegid.2021.104896. [DOI] [PMC free article] [PubMed] [Google Scholar]
- 6. Filipe JAN, Gibson GJ. Studying and approximating spatio-temporal models for epidemic spread and control. Philosophical Transactions of the Royal Society B: Biological Sciences. 1998;353(1378):2153–2162. doi: 10.1098/rstb.1998.0354. [DOI] [Google Scholar]
- 7. Filipe JAN, Gibson GJ. Comparing approximations to spatio-temporal models for epidemics with local spread. Bulletin of Mathematical Biology. 2001;63(4):603–624. doi: 10.1006/bulm.2001.0234. [DOI] [PubMed] [Google Scholar]
- 8. Draief M, Ganesh A. A random walk model for infection on graphs: Spread of epidemics & rumours with mobile agents. Discrete Event Dynamic Systems. 2011;21(1):41–61. doi: 10.1007/s10626-010-0092-5. [DOI] [PMC free article] [PubMed] [Google Scholar]
- 9. Bestehorn M, Riascos AP, Michelitsch TM, Collet BA. A Markovian random walk model of epidemic spreading. Continuum Mechanics and Thermodynamics. 2021:1–15. doi: 10.1007/s00161-021-00970-z. [DOI] [PMC free article] [PubMed] [Google Scholar]
- 10. Ahmetolan S, Bilge AH, Demirci A, Dobie AP. A Susceptible–Infectious (SI) model with two infective stages and an endemic equilibrium. Mathematics and Computers in Simulation. 2022;194:19–35. doi: 10.1016/J.MATCOM.2021.11.003. [DOI] [Google Scholar]
- 11. Xie G. A novel Monte Carlo simulation procedure for modelling COVID-19 spread over time. Scientific Reports. 2020;10(1):1–9. doi: 10.1038/s41598-020-70091-1. [DOI] [PMC free article] [PubMed] [Google Scholar]
- 12. Vyklyuk Y, Manylich M, Škoda M, Radovanović MM, Petrović MD. Modeling and analysis of different scenarios for the spread of COVID-19 by using the modified multi-agent systems – Evidence from the selected countries. Results in Physics. 2021;20:103662. doi: 10.1016/j.rinp.2020.103662. [DOI] [PMC free article] [PubMed] [Google Scholar]
- 13. De Sousa LE, Neto PHDO, Da Silva Filho DA. Kinetic Monte Carlo model for the COVID-19 epidemic: Impact of mobility restriction on a COVID-19 outbreak. Physical Review E. 2020;102(3):032133. doi: 10.1103/PhysRevE.102.032133. [DOI] [PubMed] [Google Scholar]
- 14. Triambak S, Mahapatra DP. A random walk Monte Carlo simulation study of COVID-19-like infection spread. Physica A: Statistical Mechanics and its Applications. 2021;574:126014. doi: 10.1016/j.physa.2021.126014. [DOI] [PMC free article] [PubMed] [Google Scholar]
- 15. Kaygusuz H, Berker AN. The effect of weekend curfews on epidemics: a Monte Carlo simulation. Turkish Journal of Biology. 2021;45(7):436–441. doi: 10.3906/biy-2105-69. [DOI] [PMC free article] [PubMed] [Google Scholar]
- 16. Tian H, Liu Y, Li Y, Wu C-H, Chen B, et al. An investigation of transmission control measures during the first 50 days of the COVID-19 epidemic in China. Science. 2020;368(6491):638–642. doi: 10.1126/SCIENCE.ABB6105/SUPPL_FILE/ABB6105-TIAN-SM.PDF. [DOI] [PMC free article] [PubMed] [Google Scholar]
- 17. Watts DJ, Strogatz SH. Collective dynamics of ‘small-world’ networks. Nature 1998 393: 6684. 1998;393(6684):440–442. doi: 10.1038/30918. [DOI] [PubMed] [Google Scholar]
- 18. An Y, Lin X, Li M, He F. Dynamic governance decisions on multi-modal inter-city travel during a large-scale epidemic spreading. Transport Policy. 2021;104:29–42. doi: 10.1016/J.TRANPOL.2021.01.008. [DOI] [PMC free article] [PubMed] [Google Scholar]
- 19. Kiashemshaki M, Huang Z, Saramäki J. Mobility Signatures: A Tool for Characterizing Cities Using Intercity Mobility Flows. Frontiers in Big Data. 2022;5:822889. doi: 10.3389/fdata.2022.822889. [DOI] [PMC free article] [PubMed] [Google Scholar]
- 20. Naveen BR, Gurtoo A. Public transport strategy and epidemic prevention framework in the Context of Covid-19. Transport Policy. 2022;116:165–174. doi: 10.1016/j.tranpol.2021.12.005. [DOI] [PMC free article] [PubMed] [Google Scholar]
- 21.Climate Change IPCC. In: Mitigation of Climate Change Contribution of Working Group III to the Sixth Assessment Report of the Intergovernmental Panel on Climate Change. Shukla PR, Skea J, Slade R, Al Khourdajie A, van Diemen R, McCollum D, Pathak M, Some S, Vyas P, Fradera R, Belkacemi M, Hasija A, Lisboa G, Luz S, Malley J, editors. Cambridge, UK and New York, NY, USA: Cambridge University Press; 2022. p. 2022. [DOI] [Google Scholar]
- 22. Kermack WO, Mckendrick AG. A contribution to the mathematical theory of epidemics. Proceedings of the Royal Society of London Series A, Containing Papers of a Mathematical and Physical Character. 1927;115(772):700–721. doi: 10.1098/rspa.1927.0118. [DOI] [Google Scholar]
- 23. Huppert A, Katriel G. Mathematical modelling and prediction in infectious disease epidemiology. Clinical Microbiology and Infection. 2013;19(11):999–1005. doi: 10.1111/1469-0691.12308. [DOI] [PubMed] [Google Scholar]
- 24. Shu P, Wang W, Tang M, Zhao P, Zhang YC. Recovery rate affects the effective epidemic threshold with synchronous updating. Chaos. 2016;26(6):063108. doi: 10.1063/1.4953661. [DOI] [PMC free article] [PubMed] [Google Scholar]
- 25. Liccardo A, Fierro A. A Lattice Model for Influenza Spreading. PLoS ONE. 2013;8(5):e63935. doi: 10.1371/journal.pone.0063935. [DOI] [PMC free article] [PubMed] [Google Scholar]
- 26. Berker AN, Wortis M. Blume-Emery-Griffiths-Potts model in two dimensions: Phase diagram and critical properties from a position-space renormalization group. Physical Review B. 1976;14(11):4946–4963. doi: 10.1103/PhysRevB.14.4946. [DOI] [Google Scholar]
- 27. Hoston W, Berker AN. Multicritical phase diagrams of the blume-emery-griffiths model with repulsive biquadratic coupling. Physical Review Letters. 1991;67(8):1027–1030. doi: 10.1103/PhysRevLett.67.1027. [DOI] [PubMed] [Google Scholar]
- 28. Odagaki T. Exact properties of SIQR model for COVID-19. Physica A. 2021;564:125564. doi: 10.1016/j.physa.2020.125564. [DOI] [PMC free article] [PubMed] [Google Scholar]
- 29. Niño-Torres D, Ríos-Gutiérrez A, Arunachalam V, Ohajunwa C, Seshaiyer P. Stochastic modeling, analysis, and simulation of the COVID-19 pandemic with explicit behavioral changes in Bogotá: A case study. Infectious Disease Modelling. 2022;7(1):199–211. doi: 10.1016/J.IDM.2021.12.008. [DOI] [PMC free article] [PubMed] [Google Scholar]
- 30. Peng M, Zhang J, Gong J, Ran X, Liu J, Zhang L. Epidemic modeling for the resurgence of COVID-19 in Chinese local communities. Journal of Safety Science and Resilience. 2022;3(3):229–234. doi: 10.1016/J.JNLSSR.2022.03.005. [DOI] [Google Scholar]
- 31. Zhou S, Zhou S, Zheng Z, Lu J, Song T. Risk assessment for precise intervention of COVID-19 epidemic based on available big data and spatio-temporal simulation method: Empirical evidence from different public places in Guangzhou, China. Applied Geography. 2022;143:102702. doi: 10.1016/J.APGEOG.2022.102702. [DOI] [PMC free article] [PubMed] [Google Scholar]


