

Abstract

Clays and clay rocks are considered good natural and engineered barriers for deep geological disposal of nuclear waste worldwide. Metal corrosion and organic waste degradation in underground repositories generate significant amounts of gas that should be able to migrate through the multibarrier system to avoid potential pressure buildup, which could be compromising the integrity of the barriers and host rocks. The gas is expected to accumulate in larger pores and eventually form an interconnected network. Under such conditions, the migration of gas molecules takes place both in pore water films and gas-filled macropores. Therefore, mass fluxes depend on the distribution of gas molecules between the water-rich and gas-rich phases and their mobility in both compartments. Classical molecular dynamics (MD) simulations were employed to investigate the mobilities of He, H2, CO2, Ar, and CH4 in a Na-montmorillonite mesopore as a function of the degree of saturation, as well as evaluate the hydrodynamic behavior of the pore fluid in partially saturated clays. The diffusivity of the gas molecules was determined by observing the asymptotic behavior of the mean square displacement in the gas-rich phase and at the gas–water interface. The partition coefficient and Gibbs free energy were analyzed to investigate the transfer of gas molecules between the gas-rich and water-rich phases by observing the molecular trajectories as they cross the vapor–liquid interface. The results revealed that the diffusion coefficient in the gas phase increased with increasing gas-filled pore width and converged asymptotically toward the diffusion coefficient in the bulk state. It could be shown that the diffusion coefficient of gas molecules dissolved in the water films remained constant as long as the interacting water surface was in the bulk-liquid-like phase. This behavior changes in very thin water films. It was observed that the partitioning coefficient of gas molecules at the solid–liquid interface is nearly the same as that in the bulk-liquid-like phase. Partitioning is observed to be strongly dependent on the temperature and gas molecular weights. In the second part of the study, nonequilibrium molecular dynamics (NEMD) simulations were performed to investigate the mobility of gases in pressure-driven decoupled gas-phase dynamics (DGPD) and coupled gas and water phase dynamics (CGWPD) in a partially saturated Na-montmorillonite slit mesopore. The dynamic viscosity of the gas phase was calculated from NEMD simulations and indicated that the viscosity of the gas phase was almost the same in both methods (DGPD and CGWPD). The average slip length for gas molecules at the gas–water interface was also calculated, revealing that the slip-free boundary condition assumed in continuum models is generally invalid for microfluidics and that a slip boundary condition exists at the microscale for specific surface interactions. Finally, a Bosanquet-type equation was developed to predict the diffusion coefficient and dynamic viscosity of gas as a function of the average pore width, gas mean-free path, geometric factor, and thickness of the adsorbed water film.
Introduction
In several countries, clay rocks are considered potential host rocks for the geological disposal of radioactive waste. Clay materials are also considered as backfill materials and as buffer materials due to their low permeability and adsorption capacity of their charged surfaces.1−6 Gases generated in the repository due to corrosion and biodegradation processes should be able to migrate through the multibarrier system so as not to compromise the integrity of the barrier.7−9 Therefore, understanding the mechanism of gas transport from such a system is necessary to ensure the safety of the repository.
Advective transport in low-permeability clay rock is negligible under natural hydraulic conditions in fully saturated rocks.3,10,11 Therefore, molecular diffusion is expected to be the predominant gas transport mechanism through the multibarrier system. The low-permeability clay materials are expected to undergo desaturation and resaturation phases caused by repository ventilation, thermally induced effects of the repository, or gas production.12,13 Unconnected pores thus facilitate the diffusion mechanism at different degrees of saturation.14,15
Several studies addressed the diffusion of water and tracers in clays in laboratory experiments.16−23 Very challenging gas transport experiments have also been conducted in the laboratory and in the field.24−31 Gas diffusion experiments were supported and proved by numerical and molecular multiscale simulations to gain a deeper understanding of the diffusion mechanism under variable conditions.32−41 Most of these studies were investigated under the two limiting conditions: (a) fully saturated and (b) fully dry clay conditions. In a typical repository, gas transport would take place under saturated and partially saturated conditions. It is therefore necessary to understand the mechanism of gas migration in clays under partially saturated conditions. Furthermore, the viscosity of gas in a macropore is expected to depend on the degree of saturation and the properties of gas molecules. Gas diffusivity under saturated conditions was addressed in our earlier study.42 Here, the earlier simulation approach is extended to partially saturated conditions.
Due to the hydrophilic nature of smectite clays in particular, a water film is adsorbed on the outer surface of the clay particles during the desaturation of the mesopores. The thickness of the water film depends on the water potential, which is related to the relative humidity of the vapor phase.15 Studies have shown that this water film, also called electrical double layer (EDL), is the main transport pathway for ions.14,43
In an unsaturated clay medium, the diffusion of gas in a pore can undergo two main diffusion regimes: (a) diffusion in the gas-rich phase and (b) diffusion in the liquid-rich phase. Diffusion of He, CH4, Ar, CO2, and N2 was measured in saturated clays using field experiments and laboratory studies.24−26,30,31 It was shown that the diffusion of gases in saturated systems depends on the size of the gas molecules and the geometric factor.24,31 Gadikota et al.39 performed molecular dynamics (MD) simulations of the diffusion and distribution of noble gases in the interlayer of saturated Na-montmorillonite. The results confirmed the experimental observations that diffusion in clays is slower than in bulk water and that the diffusion and partition coefficients of gases depend on the type and size of the diffusing gas molecule. The partitioning of gases is crucial for understanding the retardation and retention of gases during transport and its influence on the rate and extent of gas movement.44
In general, the rate of diffusion is significantly higher in the gas phase compared to the liquid phase. This can be observed from the self-diffusion coefficient of helium (He) at standard conditions, which is 7.1 × 10⁻⁵ m2/s, whereas the diffusion coefficient in water is 7.2 × 10⁻⁹ m2/s.45,46 Moreover, when it comes to diffusion in clays, partially saturated clays are expected to exhibit higher diffusion rates than fully saturated ones. A study by Mohammed et al.47 demonstrated that the diffusion coefficients of CO2 and CH4 confined in partially saturated calcite pores were respectively 1 and 2 orders of magnitude higher compared to the diffusion rates in saturated calcite pores. A number of studies have been carried out to investigate gas diffusion at partially saturated conditions, ranging from very loose soil material to highly compacted clay material.48−53 Recently, Wesenauer et al.49 experimentally investigated the gas-phase diffusion and permeability of O2, CO2, and N2 at different pretreatment temperatures (298.15–1173.15 K) in a dry porous clay sample, in a diffusion chamber. They derived the diffusive transport properties using a pore-scale transport model. Based on the observation of a strong increase in gas diffusivity of CO2 compared to O2, they suggested that solid–gas interfacial diffusion should be considered to fully understand the diffusion mechanism. The pore-scale transport model was extended to account for interfacial diffusion.
Macroscopic diffusion phenomena are usually described by Fick’s diffusion law.54 The first Fick’s law relates the diffusion flux to the concentration gradient, and the second law predicts the influence of diffusion on the time variation of the concentration. The first and second Fick’s laws in one dimension can be written mathematically as follows
| 1 |
| 2 |
where J is the diffusion flux in mol/m2/s, D is the diffusion coefficient in m2/s, x is the position in length (m), C is the concentration in amount of substance per unit volume (mol/m3) and t is the time in seconds (s).
Fick’s law is a widely used fundamental law for the diffusion of gases where the concentration, pressure, and temperature gradients lead to a net mass flux. Fick’s equations are used in most macroscopic numerical simulations and diffusion models.55−61 However, Fick’s law has some limitations that make it inapplicable in certain systems.62 In addition, Fick’s law is inadequate when dealing with stagnant gases or very slowly diffusing gases, for example, Ar and N2.62 According to Thorstenson et al.,62 an accurate understanding of gas transport in fine-grained porous media must include the possible contribution of Knudsen diffusion, molecular and non-equimolar components of diffusive flux, and viscous (pressure-driven) flux.
Over the years, molecular dynamics simulations have been used to study the transport of fluids in clays.14,39,63−68 It is a powerful tool to understand the diffusive mechanism of gas molecules in nanopores as well as the interactions between the fluid of interest and its environment and how these affect the diffusive behavior. These insights are not easily obtained through experimental studies and macroscopic numerical modeling. Apostolopoulou et al.63 used molecular dynamics simulations to investigate the transport properties of methane in dry, nanoconfined slit pores as a function of pore width. The methane fluid structure and diffusion coefficient within 5-nm-wide pores were quantified in different pore regions and the results were scaled up using a kinetic Monte Carlo model to predict diffusion in mesopores.63 Similarly, Sui et al.67 used Grand Canonical Monte Carlo and molecular dynamics methods to study the adsorption and diffusion of shale gas in a dry and wet Na-montmorillonite nanopore at different temperatures and pore sizes. It was found that short-range dispersive interactions affect CH4 sorption on clay walls and CH4 diffusion increases with increasing pore size.67 In addition, it was found that preloading the pore space with water reduces the sorption of CH4 in clay, as CH4 is hydrophobic and therefore does not mix with water molecules.67 Wang et al.68 used molecular dynamics simulations to investigate the diffusion behavior of supercritical methane in shale nanopores as a function of the pore size, pore pressure, and moisture content.68 One of their findings was that, moisture slows down methane diffusion, but this behavior is more pronounced in organic materials than in inorganic materials, which is due to the clustering and adsorption membrane effect of water in organic and inorganic pores, respectively.68 The diffusion coefficient of each gas within a mixture can be significantly influenced by varying compositions of the gases.69 Through the use of molecular dynamics simulation, Kadoura et al.69 investigated the structural and transport characteristics of CO2, CH4, and their mixture at a temperature of 298.15 K. The study revealed that the self-diffusion coefficients of CH4 experience a notable decrease when exposed to high loadings of CO2, primarily due to steric hindrance effects.
Although much progress has been achieved in understanding the diffusion behavior of gas in a clay medium, there are still a number of unresolved issues. The first, concerns the diffusion mechanism of different gas molecules, the influence of system composition, and interactions with the confinement. So far, most studies have focused on the diffusion of CH4. The second challenge is that, most studies have focused on either dry clays or fully saturated clays. Studies on partially saturated clays have mostly been conducted at the macroscopic scale and thus,the diffusion of gases at the molecular scale in partial saturation has not been fully understood. The third challenge is that, unlike anions where adsorbed water films become the transport pathway for diffusion in partially saturated systems,14 gas transport occurs simultaneously in three domains: (1) diffusion in the gas phase, (2) diffusion in the adsorbed water phase, and (3) diffusion in the transition zone at the gas–water interface.
To address these questions, molecular dynamics is applied here to study the diffusion of molecular gas (He, H2, CO2, Ar, CH4) through partially saturated smectite clay. The influencing factors, e.g., gas type, temperature, and degree of saturation, are analyzed. The partition coefficient, which indicates the retention and retardation capacity of the gas transport, is also analyzed. The simulation is performed under natural conditions at a pressure of 12 MPa, which is typical of the confining pressure expected in the geological repository. Finally, nonequilibrium molecular dynamics (NEMD) is used to study the gas dynamics and hydrodynamics of gas and water molecules confined in partially saturated smectite. In particular, the dynamic viscosity and behavior of the gas–water interface as a function of the degree of saturation are studied. The aim is to gain a comprehensive mechanistic understanding of the diffusion of gases in partially saturated smectite clays, as well as to demonstrate the ability of MD to complement experiments and macroscopic numerical modeling. The obtained results propose a mathematical model required for further investigation in an upscaling approach for the diffusion of gases in clay rocks through multiscale numerical modeling.
Methods
System Setup
Molecular dynamics (MD) simulations were carried out to study the diffusion of different gas molecules in a clay slit pore as a function of temperature and degree of saturation (water to gas ratio in the system). Further analysis was applied to estimate fluid viscosity and gas–liquid partition coefficients. The simulation setup is very similar to the one used by Churakov.14 Briefly, the setup consists of a stack of two layers of Na-montmorillonite (tetrahedra–octahedra–tetrahedra sheets) arranged parallel to each other in the XY plane with a nanopore of 0.6 nm between them. An external mesopore of about 6 nm was introduced in which the gas-filled pore width as well as the composition of the gas phase could be varied. A snapshot of the simulation cell is shown in Figure 1. The solid phase composition is 2 × 4 Na0.5[Al3.5Mg0.5]Si8O20(OH)4. Isomorphous substitutions of Mg ions for Al ions in the octahedral sheet were randomly distributed to avoid Al–Al pairs in adjacent octahedra. These substitutions create a permanent structural charge on the clay layer, which is compensated by Na ions. A total of 24 isomorphous substitutions were included. To ensure an even distribution of charges in the system, 12 Na ions were placed in the center of the interlayer pore, while 6 Na ions were placed near either side of the mesopore.
Figure 1.

Snapshot from the MD simulation of a 6 nm Na-montmorillonite slit pore for two different degrees of saturation (gas-filled pore width of 1.8 and 5.3 nm; left and right, respectively). Oxygen atoms are red. Hydrogen atoms forming H2O molecules and OH groups are white. Silica atoms are pink. Aluminum atoms are gray. Magnesium atoms are green. Sodium atoms are blue. Gas molecules, represented by argon in this particular case are yellow. The graphs next to the snapshots show the density distribution of water and gases in the slit pore. The black curve is the density distribution of the gas molecules (magnified by a factor of 10 for the sake of visualization) and the blue is that of the water. The cyan area on the density plot shows the solid–liquid interface, the pink area shows the domains occupied by the bulk-liquid-like phase, the green area shows the central domain occupied by the gas phase, and the blue area indicates the gas–water interface regions.
Simulation Details
Equilibrium Molecular Dynamics
Molecular dynamics simulations were performed using the open-source package LAMMPS.70 The interatomic interaction potentials for clay atoms, water, and gas molecules are the same as those used in our previous work, which also explains the model uncertainties.42
The setup and equilibration of the system take full account of the gas molecules partitioning between gas-rich and water-rich phases (solubility) by implementing an iterative equilibration process under imposed PVT constraints. For the sake of data comparison, all of the simulations are conducted in the same d-spacing of 6 nm distance between the TOT layers. The gas-rich phase is confined between the two water-rich films wetting the TOT layers. To achieve the desired density (pressure) and enable gas molecules to dissolve (partition) from the gas phase into the water phase, we use an iterative NPT equilibration process. Initially, the water saturated system was equilibrated in the NPT ensemble at a temperature of 300 K and a pressure of 12 MPa. The final size of the simulation cell after equilibration was 31.17 × 35.88 × 83.72 Å3. Then, a fraction of water molecules in the middle of the slit pore was removed from the center of the slit pore and replaced with gas molecules according to a density estimate for the target P–T conditions (Figure 1). Subsequently, the system was iteratively equilibrated in the NPT ensemble under an external pressure of 12 MPa. This ensemble allows the system to relax and account for the interactions between the gas and the surrounding components. Additionally, it ensures the equilibrium partitioning of gas and water molecules between the water- and gas-rich phases. Since the behavior of a gas under high pressure may deviate from the ideal gas relation, the NPT ensemble is essential for achieving a more realistic representation. To ensure that the system maintain a structure equivalent to the saturated system (with an average pressure of 12 MPa and dimensions of 31.17 × 35.88 × 83.72 Å3), the system size and average pressure after equilibration were examined. If these parameters did not match the desired values, the number of gas molecules was adjusted accordingly, and the NPT simulation was repeated. This iterative process was carried out until the target mesopore size of ∼6 nm, and the equilibrium molar density of the gas phase was consistently maintained. The simulations were performed at two temperatures (300 and 330 K) for eight saturation states and five gas species.
For each system, a 10 ns production run with a time step of 1 fs was performed in the NVT ensemble at temperatures of 300 and 330 K after equilibration. The temperature of 330 is close to in situ conditions in an underground repository. The Nosé–Hoover thermostat was applied to keep the temperature constant.71,72 A fully flexible CLAYFF force field was applied to the atoms of the clay particles, while the water molecules were kept rigid using the SHAKE algorithm.73 Short-range interactions were calculated using the Lennard–Jones potentials with a cutoff of 12 Å. Long-range electrostatic interactions were calculated using the particle–particle particle–mesh method (PPPM) with a cutoff value of 12 Å. The final 8 ns trajectories were split into two blocks to obtain two independent replicates for further uncertainty analysis.
Diffusion Coefficient
Due to the coexistence of the two-phase fluid and its strong interaction with the surface of clay minerals, structurally distinct areas were identified in the simulated mesopore (Figure 1). These include (1) the mineral fluid interface with strong density fluctuations, (2) a bulk-liquid-like water film, (3) a transition zone between water-rich and gas-rich regions, and (4) a low-density gas-rich phase. To accurately calculate the diffusion coefficient in the mesopore for gas molecules, the mesopore was divided into three regions: liquid phase, gas-rich phase, and water–gas interface. In this study, we focused only on diffusion in the gas phase and the water–gas interface. Diffusion in the liquid phase was investigated in our previous study on the mobility of gas molecules in saturated smectites.42 To obtain the diffusion coefficient in different regions, we adopted the MD-calculated survival probability and the mean square displacement method of Liu et al.74 In this study, only the x and y components of the diffusion tensor, describing the two-dimensional diffusion parallel to the gas–water interface were analyzed. Assuming a layer parallel to the basal surface of the clay particle with intervals in the z-dimension defined as {a,b}, the diffusion coefficient of particles located in the region of the interval {a,b} in one dimension is given as follows
| 3 |
and
| 4 |
and
| 5 |
where ⟨Δx(τ)2 ⟩{a,b} is the mean square displacement of the atoms in the region {a,b}, P(τ) is the survival probability, T is the total number of time steps, averaged over, N(t) denotes the number of particles in the region at time t, and N(t, t + τ) is the set of all particles remaining in the region {a,b} during the time interval between t and t + τ.
Partition Coefficient and Gibbs Free Energy of Molecule Transfer
The equilibrium partitioning of water and gas molecules between coexisting water-rich and gas-rich phases could be determined by molecular dynamics simulations. At equilibrium, the partition coefficient K of the gas molecules in the liquid phase is calculated from the ratio of the number densities of gas molecules in the liquid phase (ρgas in water phase) and gas phase (ρgas in gas phase), normalized to the number density of water molecules, (ρwater in water phase) and (ρwater in gas phase), in each phase, respectively
 |
6 |
From the partition coefficient K, the Gibbs free energy difference associated with the transfer of a gas molecule from the gas phase to the liquid phase75,76 can be calculated directly as
| 7 |
where R and T are the molar gas constant (8.3145 J/(mol K)) and the absolute temperature, respectively.
Nonequilibrium Molecular Dynamics
To evaluate the effects of viscous stresses in the system and their correlation with diffusion, partial saturation, and gas type, nonequilibrium molecular dynamics was used to study the hydrodynamic properties of the confined fluid. In equilibrium molecular dynamics, the macroscopic impulse of the simulation cell and its angular moment are set and maintained at zero. In nonequilibrium molecular dynamics, a constant external force is applied to the particles in a specific direction. This corresponds to the introduction of a uniform pressure gradient along the given direction in the system, resulting in a flow of particles. In this study, two simulation approaches were used to analyze the dynamics of gas: (a) a constant force acting only on the gas molecules in the gas phase (decoupled gas-phase dynamics (DGPD)) and (b) a constant force acting on all fluid particles (coupled gas and water phase dynamics (CGWPD)). To drive the flow, a constant external force of 5.0 × 10⁻³ kcal/mol in the x-direction, parallel to the surface, was applied to each fluid atom. This force is low enough to maintain the linear response conditions between applied stress and fluid velocity. A temperature of 300 K was set with the Nosé–Hoover thermostat and this thermostat was coupled only to the degrees of freedom of the fluid in the y-direction, which is along the surface and perpendicular to the fluid flow. The clay particles were kept rigid throughout the simulation. The velocities of the fluid were recorded every 1 ps for 6 ns in bins along the z-direction (pore width) with a bin width of 0.1 Å, after a 2 ns equilibration.
At a steady state, the velocity distribution of a pressure-driven flow (Fx) in a pore channel can be described by the Poiseuille flow. The Poiseuille flow leads to a parabolic velocity profile that can be described by the Stokes equation for the velocity component in the x-direction as a function of the distance from the middle of the slit pore (h)
| 8 |
The dynamic viscosity of the fluid, assuming constant viscosity and density in the pore, can be computed from the velocity profile as:
| 9 |
where vx(h) is velocity along the slit pore width (h), Fx is the applied external force, ρ is the number density, μ is the dynamic viscosity, and Lh is the total slit pore length.
Results and Discussion
Self-Diffusion of Gas Molecules
The self-diffusion coefficients of gas molecules were first studied by simulating a system of 1000 gas molecules at temperatures of 300 and 330 K and a pressure of 12 MPa for each type of gas. The system was equilibrated in the NVE ensemble for 200 ps. A further equilibration of 1 ns was performed in the NPT ensemble. This was followed by a production run of 5 ns in the NVT ensemble to calculate the self-diffusion coefficients. Table 1 shows the values of the self-diffusion coefficients of gas molecules from the MD predictions.
Table 1. Predicted Self-Diffusion Coefficients of Gas Molecules D (10–6 m2/s) at 12 MPa.
| T (K) | H2 | He | CH4 | Ar | CO2 |
|---|---|---|---|---|---|
| 300 | 1.470 | 1.257 | 0.164 | 0.134 | 0.040 |
| 330 | 1.511 | 1.486 | 0.217 | 0.161 | 0.069 |
To verify and validate the model parameters and the values of the self-diffusion coefficients, the results of the MD simulations were compared with experimental data77−80 and also evaluated using an empirical procedure.81−83 Both data sets agree very well with the empirical relationships. Calculations from the kinetic theory of gases have been used in the past to estimate the diffusion coefficient, viscosity, and thermal conductivity of dilute gases using their intermolecular forces.84 This approach was extended by Slattery et al.81 by developing a relation from dimensional analysis considerations and experimental diffusivities using Enskog’s kinetic theory for dense gases. Their formulation can predict the self-diffusion coefficients of dense nonpolar gases. Based on the work of Slattery and Bird,81 Stiel et al.82 developed a comprehensive relation for calculating the self-diffusion coefficients of polar, nonpolar, and binary gas mixtures for dense gases.
In this study, the density of gas molecules at equilibrium was used to predict the self-diffusion coefficients using the empirical formulation of Stiel et al.82 (eqs 10 and 11) and Slattery et al.81 (eq 12). Equations 10 and 11 apply to Ar, H2, CO2, and CH4 gas, while eq 12 applies to He gas
| 10 |
and
| 11 |
and
| 12 |
where ρ is the gas density, D is the diffusion coefficient, ξ = Tc1/6/M1/2Pc, p is the system pressure, Tc is the critical temperature of gas, Pc is the critical pressure of gas, M is the molecular weight, and TR is the reduced temperature (T/Tc).
Figure 2 shows a plot of the self-diffusion coefficients of gas molecules as a function of gas density from MD predictions. The graph also shows the values calculated from the empirical procedure and experiments. From Figure 2, it can be seen that the self-diffusion coefficient of gas molecules is inversely proportional to the gas density. The fitting line in Figure 2 represents a fitting of the diffusion coefficients at low densities using the Chapman–Enskog theory described by Chapman and Cowling.85
Figure 2.

Predicted self-diffusion coefficients for gas molecules as a function of equilibrium gas density at 12 MPa from MD simulations. The graph includes experimental values77−80 as well as predictions based on empirical relations. The fitting line shows diffusion coefficients predicted using the Chapman–Enskog theory, described by Chapman and Cowling.85
Gas Partitioning
The distribution of the gas molecules in the water-rich phase was determined from the density profiles (Figures S2–S11) of the gas in the water-rich phase. The partition coefficient (K) and the free energy difference (ΔG) associated with the transfer of the gas molecules into the water-rich phase are obtained from eqs 6 and 7, respectively. Figure 3 illustrates the density distribution of water on the external surface of the clay as a function of gas-filled pore width. At a smaller gas-filled pore width, the density profile shows three highly structured layers of water at distances of 0.3, 0.6, and 0.9 nm from the surface of the clay. This behavior is typical of what can be expected under fully saturated conditions.14,42 Further away from the surface >1.0 nm, the density distribution is constant and the water shows a bulk-like behavior.
Figure 3.

Density distribution of water on the external surface of the clay (half of the pore width). (Inset) The cyan-colored area on the density plot shows the solid interface characterized by strong structuring of fluid. This domain is used for the analysis of gas partitioning to the solid–liquid interface. The pink-colored area shows the domain occupied by the bulk-liquid-like phase.
Taking into account the structuring of the liquid near the clay surface, the partition coefficients and Gibbs free energy of gas transfer were determined for two regions: (a) the partitioning of gas molecules to the solid–liquid interface and (b) the partitioning to the bulk-like water-rich region. These regions are indicated in Figure 3 by the colors cyan and pink, respectively (inset). The values of gas molecules at the solid–liquid interface (KI, ΔGI) and in the bulk-like water region (KB, ΔGB) are given in Table 2. For a wide range of saturation, the K and ΔG values are essentially constant within the statistical uncertainties of the simulation. Therefore, the results in Table 2 represent averaged values over several simulations with different gas-filled pore widths. It is important to note that, in the context of partitioning in the bulk-like water region, our averaging calculations were limited to a range of gas-filled pore widths between 1.8 and 3.3 nm. This restriction was implemented as the region in question is no longer present beyond a gas-filled pore width of 3.3 nm. Similarly, for partitioning at the solid–liquid interface, our results were limited to a range of gas-filled pore widths between 1.8 and 4.3 nm. This was done in accordance with our trajectory analysis, which indicated that for gas-filled pore widths exceeding 4.3 nm (in the case of thin water films), the water molecules tend to cluster around the Na ions, resulting in discontinuous coverage of the clay surface by the water film. As a consequence, gas-filled domains make direct contact with the clay surface.
Table 2. Partitioning Coefficients K (10–7) and Gibbs Free Energy of Transfer G (kJ/mol) of Gas Molecules at the Solid–Liquid Interface and at the Bulk-Like Water Region.
| T (K) | H2 | He | CH4 | Ar | CO2 | |
|---|---|---|---|---|---|---|
| 300 | KB | 0.97 ± 0.46 | 2.45 ± 1.30 | 1.51 ± 0.82 | 7.90 ± 1.49 | 138.97 ± 26.29 |
| KI | 1.22 ± 0.58 | 2.56 ± 1.02 | 1.34 ± 0.66 | 7.26 ± 2.80 | 142.14 ± 21.72 | |
| GB | 40.64 ± 1.46 | 38.29 ± 1.23 | 39.52 ± 1.24 | 35.09 ± 0.48 | 27.94 ± 0.50 | |
| GI | 40.07 ± 1.45 | 38.06 ± 1.00 | 39.68 ± 0.99 | 35.53 ± 1.29 | 27.87 ± 0.41 | |
| 330 | KB | 10.94 ± 3.95 | 20.06 ± 4.44 | 10.05 ± 4.32 | 53.02 ± 7.21 | 389.24 ± 58.56 |
| KI | 9.15 ± 3.80 | 20.12 ± 3.46 | 9.83 ± 5.24 | 49.03 ± 7.46 | 392.30 ± 78.15 | |
| GB | 37.84 ± 1.00 | 36.07 ± 0.64 | 38.16 ± 1.21 | 33.35 ± 0.36 | 27.89 ± 0.41 | |
| GI | 38.35 ± 0.97 | 36.03 ± 0.50 | 38.44 ± 1.73 | 33.57 ± 0.39 | 27.89 ± 0.55 |
The results indicate that KB and KI increase as the temperature is increased. Moreover, the particle density of the gas molecules was found to impact gas partitioning. CO2 and Ar, which have molecular masses of 44 and 39.95 g/mol, respectively, exhibit significantly higher partitioning coefficients than He, H2, and CH4. Interestingly, despite He having a smaller molecular mass than CH4, its small molecular size allows for easier penetration into the interstitial spaces between water molecules, resulting in greater partitioning. Prior research has demonstrated a direct relationship between partition coefficient and molecular weight,86,87 as well as polarizability.88−91
Effect of Saturation on the Diffusion of Gases
The self-diffusion coefficient of gas molecules in the gas phase at temperatures of 300 and 330 K as a function of the gas-filled pore width, normalized to the diffusion coefficient in the bulk (D0), is shown in Figure 4. It should be noted that gas-filled pore widths below 1.8 nm were excluded from this study because a larger quantity of gas molecules was required to keep the pore space open for gas-phase diffusion. This behavior is likely due to dispersive interactions between opposing water platelets that result in a net attractive force between closely spaced platelets. As the gas-phase pore size increases, this effect diminishes.
Figure 4.

Relative diffusion coefficient of gas molecules in the bulk gas phase in Na-MMT at 12 MPa as a function of gas-filled pore width: (a) 300 K and (b) 330 K.
The results show that the diffusion coefficient increases with the pore size and asymptotically converges toward the value of the bulk state. It was originally assumed that a constant value (D0) over a wide range of pore widths would be obtained by using the survival probability, which calculates the diffusion coefficient associated exclusively with the gas phase in the bulk, and thus eliminating the effects of confinement. However, the opposite was found. The results showed that He gas specifically was strongly affected by confinement compared to other gases; possibly due to the Knudsen effect. To this effect, the mean-free path of the gas molecules was calculated based on the collisions of gases analysed from the molecular dynamics simulations trajectories. A comparison with the calculations of the mean-free path performed with kinetic theory is made, which agrees well. Table 3 shows the values for the mean-free path from molecular dynamics calculations and kinetic theory for temperatures of 300 and 330 K.
Table 3. Mean-Free Path of Gas Molecules (nm) from MD Simulations (λMD) with σcol = σgas and Kinetic Theory (λKT)a.
| 300 K |
330 K |
|||
|---|---|---|---|---|
| gas | λKT | λMD | λKT | λMD |
| H2 | 8.45 | 10.47 | 9.13 | 12.02 |
| He | 10.40 | 10.91 | 11.65 | 11.89 |
| Ar | 6.23 | 6.01 | 6.87 | 6.31 |
| CH4 | 4.98 | 4.76 | 6.09 | 5.93 |
| CO2 | 3.01 | 3.04 | 4.59 | 5.20 |
σcol is the collision diameter and σgas is the diameter of the gas molecule that is the Lennard–Jones collision diameter (σ).
In general, it can be observed that the maximum gas-filled pore size is still smaller than the mean-free path for most gas molecules. Consequently, the diffusion coefficient is reduced due to collisions with the water surface, which results in gas molecules having a shorter mean-free path under confinement. Strong influence is exerted on He gas because it has the largest mean-free path compared to the other gases.
The Knudsen number was calculated from the mean-free path and the gas-filled pore sizes. A diagram showing the relationship between the diffusion coefficient and the Knudsen number is shown in Figure 5. A mathematical equation developed from the graph after the Bosanquet approximation92,93 is given as
 |
13 |
and
| 14 |
where D0 represents the bulk diffusion coefficient in the gas phase at 12 MPa, λ denotes the mean-free path of the gas at 12 MPa, h is the width of the pore, Kn is the Knudsen number, and tw is the thickness of the adsorbed water film, which varies with the degree of saturation. The parameter αd is the Bosanquet correction parameter obtained through fitting and has a value of 0.2.
Figure 5.
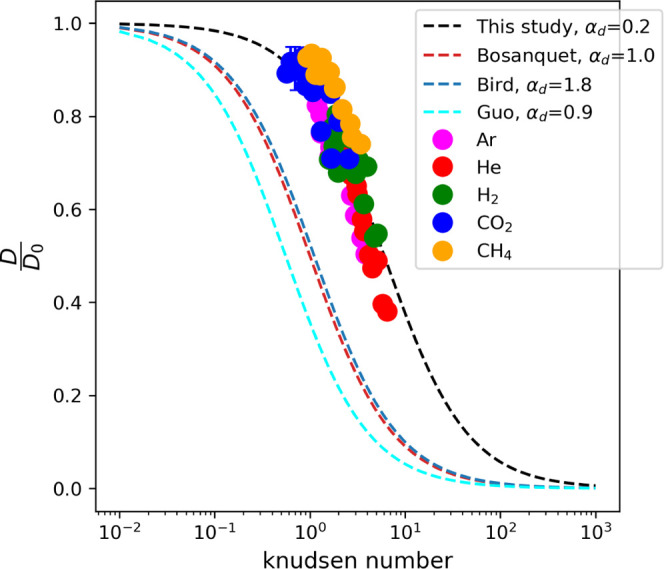
Relative diffusion coefficient of gas molecules normalized to the diffusion coefficient in a pure bulk system as a function of the Knudsen number and fitted with eq 13. The curve shift observed in this study is attributed to the specific physicochemical conditions considered, which differ from the simplified conditions assumed in the original Bosanquet approximation.
Based on the work of Yin et al.,94 the identification of three gas diffusion regimes can be made in a porous media, determined by the local Knudsen number. The regimes are characterized by Kn values of ≤0.1, 0.1 < Kn < 10, and Kn ≥ 10. In the case of molecular diffusion (Kn ≤ 0.1), intermolecular collisions are dominant. When Knudsen diffusion occurs (Kn ≥ 10), the dominant collisions are between molecules and a solid wall. In the case of transition diffusion (0.1 < Kn < 10), significant intermolecular collisions and collisions between molecules and the solid wall occur. The Knudsen number ranges from 0.6 to 6 in our results, indicating that diffusion is in the transition regime and not purely molecular.
Several studies have shown that the original Bosanquet formula can approximate gas diffusion well in the transition regime.92,95−97 Guo et al.95 used the Boltzmann transport equation to study gas diffusion and found a Bosanquet correction parameter, αd of 0.9, where the Knudsen number was determined using the method of the largest sphere. The Knudsen diffusivity derived from the kinetic theory of gases yielded an αd of 1.8, which underestimated the value obtained by Guo et al.95 In this study, we obtained an αd of 0.2, which appears to overestimate the other predictions. It is worth noting that the original Bosanquet approximation was developed from empirical studies and relies on several idealized conditions. The current system exhibits nonideal gas behavior due to the high pressure. In addition, the gas-wall collisions may not be perfectly elastic since the wall consists of water molecules. Hence, surface phenomena such as adsorption and water vapor mobility at the gas–water interface may not be captured by the original Bosanquet approximation. Chen et al.98 investigated the validity of the Bosanquet approximation using equilibrium molecular dynamics simulations and concluded that further modifications to the Bosanquet approximation are necessary to account for the intermolecular forces of fluid molecules and the smoothness of the pore walls.
Experimental data regarding gas diffusion coefficients in partially saturated smectite micropores as a function of gas-filled pore width are currently unavailable. However, a previous investigation of gas diffusion in saturated smectite incorporated a geometric factor and utilized an empirically derived function from a molecular dynamics study.42 This approach produced predictions that closely matched experimental gas diffusion data in Boom clay. Therefore, we propose to adopt a similar methodology in our current study and modify eq 13 accordingly
 |
15 |
where G is the geometric factor and hav is the average pore width. The geometric factor refers to an empirical parameter accounting for the reduction of the diffusive transport of species in porous media in comparison with the bulk phase due to the geometric complexity of pore space.36 The geometric factor takes into account the tortuosity of diffusion paths, pore constrictivity, and the overall complexity of the clay pore structure. In general, the tortuosity and constrictivity cannot be measured independently and are thus often lumped in a single parameter referred to as a geometric factor. This equation allows to predict the gas-phase diffusivity for general conditions based on the geometric properties of porous media, mean pore size, and the partial water pressure via the corresponding parameters, G, hav, and tw. A further effect of temperature can be considered following the approach described in our previous study.42
Gas–Water Interface Diffusion
Accurately determining the diffusion coefficient at the gas–water interface is challenging due to the imprecise definition of the region encompassing the interface. To address this issue, we have defined the interface region as the area bounded by the adsorbed gas layer at the water interface, indicated by a cyan margin in Figure 1. Figure S1 displays the diffusion coefficient at the gas–water interface. The results indicate that diffusion at the gas–water interface is ∼10% lower than in the bulk. Notably, we observe from Figure S1 that the diffusion coefficient remains constant when the interaction water surface is in the bulk water phase. However, this behavior changes and increases as a function of adsorbed water film thickness for water film thicknesses below 1.0 nm. This is probably due to the structuring of water molecules close to the clay surface.
Flow Dynamics
The study of fluid behavior necessitates a fundamental understanding of dynamic viscosity. As such, nonequilibrium molecular dynamics simulations were conducted in order to address this objective. A constant force acting on each fluid atom in the direction parallel to the clay surface initiated a fluid flow. Subsequently, steady-state velocity profiles were analyzed to determine the dynamic viscosity of gas in partially saturated Na-MMT. The Navier–Stokes equation (eq 8) predicted a parabolic (Poiseuille) velocity profile assuming constant viscosity and density. Using eq 9, the dynamic viscosity was then obtained. These findings provide valuable insights into the dynamic properties of fluids in confined spaces.
Method Validation
To validate the simulation setup, nonequilibrium molecular dynamics simulations were conducted for water flow in fully saturated Na-MMT. The resulting velocity and density profiles are shown in Figure 6. The density profile of water at the center of the pore remains constant at 1 g/cm3, indicative of the bulk water behavior. Close to the surface, notable fluctuations in water density are observed within a 1 nm region, with a maximum density of ∼2 g/cm3. The calculated dynamic viscosity for water in a 6 nm nanopore is 0.634 cP, This value that is in agreement with prior studies on the dynamic viscosity of bulk water,99 flow simulations in a 6 nm Na-MMT nanopore,99 and experiments with bulk water,100 which reported values of 0.66, 0.68, and 0.891 cP, respectively. In contrast to the findings of Boţan et al.,99 deviations from the parabolic flow profile near the surface were not significant in this study. This may be due to the use of a constant force, which is ∼1 magnitude of order higher than that utilized in their study.99 A higher force leads to greater water mobility, thereby diminishing the impact of water–solid surface interactions. The sliding velocity at the surface was roughly 75 m/s, indicating higher mobility than the study by Boţan et al.,99 which reported a velocity of about 4 m/s.99
Figure 6.

Steady-state velocity profile of water flow in Na-MMT. The force is acting parallel to the surface on each fluid atom in the x-direction. This diagram also shows the mass density profile of water. The black markers represent the velocity values from the MD simulation, the red line is the parabolic fit of the Poiseuille flow extrapolated here to the velocity at zero, and the blue line represents the mass density profile of water.
The boundary condition responsible for the parabolic profile at the center of the pore is a crucial parameter that has been extensively studied.101 The slip boundary condition has conventionally been assumed for continuum-scale fluids. In their review on microfluidics, Squires et al.101 demonstrated that the no-slip boundary condition is not valid for gas within distances smaller than the mean-free path from the wall. They also showed that noncontinuum effects play a role in the boundary conditions of fluids confined to a molecular scale. Experimental techniques used to study microfluidic behavior generally indicate that wetting (hydrophilic) surfaces follow the no-slip boundary condition, whereas nonwetting (hydrophobic) surfaces follow a slip boundary condition.101 To reveal the appropriate boundary conditions best applicable to the system and estimate the slip at the solid–liquid and liquid–gas interface, the slip length was calculated for each interface. The slip length is defined as the distance within the surface/wall at which the (extrapolated) fluid velocity would be stationary; this can be expressed as
| 16 |
where Ls is the
slip length, vx is the
slip velocity at the solid-liquid or liquid–gas boundary, zsurf is the location of the slip surface, and  is the derivative of the slip velocity
at the slip surface.
is the derivative of the slip velocity
at the slip surface.
The simulation resulted in a slip length value of 5.00 ± 0.45 Å for flow of water in Na-MMT. Although there are no experimental determinations of the slip length, this value is in agreement with the value of 6 Å obtained by Marry et al.,102 when studying electroosmosis in Na-MMT.
Gas Dynamics in Slit Pore
As an initial approach, the bulk viscosity of gas species was determined through bulk equilibrium molecular dynamics simulations, utilizing the Green–Kubo method at a temperature of 300 K and pressure of 12 MPa. The obtained results, presented in Table 4, indicate good agreement with the experimental values obtained at a temperature of 300 K and pressure of 0.1 MPa. It is thereby demonstrated that the dependence of viscosity on pressure is moderate. Nevertheless, the molecular weight presents a strong influence on the viscosity values.
Table 4. Dynamic Viscosity (Centipoise) and Slip Length (Å) Values for Gas Dynamics.
| gas | μ0 | μexpa | μdry | Div (%) | LDGPD | LCGWPD | Ldry |
|---|---|---|---|---|---|---|---|
| H2 | 0.009 | 0.009 | 0.007 | –24.4 | 3.94 ± 1.02 | 4.29 ± 0.52 | 41.78 |
| He | 0.018 | 0.020 | 0.013 | –29.2 | 3.16 ± 0.34 | 4.24 ± 0.67 | 54.14 |
| Ar | 0.028 | 0.023 | 0.021 | –1.3 | 1.24 ± 0.32 | 1.81 ± 0.35 | 2.98 |
| CH4 | 0.010 | 0.011 | 0.004 | –5.0 | 0.65 ± 0.19 | 0.94 ± 0.45 | 8.58 |
| CO2 | 0.033 | 0.015 | 0.014 | 83.3 | 0.74 ± 0.13 | 2.06 ± 0.47 | 0.65 |
μexp is experimental dynamic viscosity values.103−107 μ0 denotes the viscosity of gas from the bulk gas system using the Green–Kubo method. μdry is the viscosity of gas in a dry pyrophyllite. LDGPD denotes the slip length for gas in the DGPD. LCGWPD denotes the slip length for gas in a CGWPD. Ldry denotes the slip length for gas in the dry pyrophyllite. The symbol Div represents the percent difference between the relative viscosities in the maximum partially saturated gas-filled pore width (μ/μ0) and in the dry pore width (μdry /μ0) .
As previously noted, two distinct methodologies have been developed for investigating the dynamics of gas species, as depicted in Figure 7: decoupled gas-phase dynamics (DGPD) and coupled gas and water phase dynamics (CGWPD). In the DGPD system (Figure 7a), the adsorbed water film experiences no external forces but rather undergoes weak traction at the gas–water interface due to the coupling of shear stresses resulting from the flow of gas species.
Figure 7.

Velocity and density profiles of CO2 gas in steady state at a pore width of 3.3 nm. The red line fits the velocity profile of water, the black line fits the velocity profile of CO2 gas, the blue is the density profile of water and the orange is the density profile of CO2 gas. (a) DGPD and (b) CGWPD.
The dynamic viscosity of the gas species is shown in Figure 8 as a function of the Knudsen number for DGPD and CGWPD. The findings demonstrate that the viscosity behavior remains unchanged in both DGPD and CGWPD, indicating that dynamic viscosity is an inherent property of the gas. However, a strong dependence of viscosity on the Knudsen number is observed. This means that the pore size and mean-free path of a gas under confinement are crucial in determining the viscous behavior of the gas. Again, a Bosanquet-type approximation that satisfactorily describes the Knudsen number dependence of the viscosity is given (with an introduction of the geometric factor for macroscopic predictions)
 |
17 |
where μ0 represents the bulk dynamic viscosity of the gas, λ denotes the mean-free path of the gas, hav is the average width of the pore, tw is the thickness of the adsorbed water film, which varies with the degree of saturation, and αd is the Bosanquet correction parameter obtained through fitting and has a value of 0.5. Here, G is a geometric factor, which is a function of the permeability.
Figure 8.

Dynamic viscosity of gas molecules in Na-MMT as a function of the Knudsen number: (a) DGPD and (b) CGWPD.
Based on the Knudsen number, four flow regimes are recognized by a widely used empirical classification of gas flow in rarefied conditions.108 The Navier–Stokes equation is the best tool to describe flow when Kn < 10–3 because, the continuum assumption is valid and is supported by the no-slip boundary condition at the walls. With slip-velocity and temperature-jump boundary conditions, the continuum equations’ applicability can be expanded for the regime of 10–3 < Kn < 10–1 (also known as the slip-flow regime).109,110 The transition regime 10–1 < Kn < 101 is the most challenging to handle. Intermolecular collisions for Kn > 101 become negligible, and the kinetic theory is typically used to describe the so-called free-molecular flow regime.111
This study investigates the transition regime of the viscous flow of gas species. The rarefaction (correction) parameter αv for this study is found to be 0.5, which differs from the values reported in previous studies, such as 1.5 and 2.0.111 This deviation is attributed to the same underlying factor as that discussed for diffusion. To explore the impact of the pore wall type on viscosity, gas flow simulations were conducted in a dry pyrophyllite. The viscosity values and the corresponding percentage deviation of the relative viscosities in the maximum partially saturated gas-filled pore width (μ/μ0) and in are presented in Table 4. The observed deviation values (Div) of the gas species indicate a pronounced influence of the interacting surface on the dynamic viscosity of the confined gas molecules. Specifically, He, H2, CH4, and Ar exhibit a higher affinity toward the liquid wall compared to the solid wall, resulting in reduced relative viscosities upon contact with water molecules. He and H2 with lower molecular weights show a much stronger affinity. Conversely, CO2 exhibits the opposite trend, with a very strong affinity for the clay solid wall.
Table 4 presents the slip length values (LDGPD, LCGWPD, and Ldry) for gas flow in DGPD, CGWPD, and dry pyrophyllite. The results demonstrate that both DGPD and CGWPD exhibit a marginal slip condition at the liquid surface, with CGDW exhibiting slightly higher slip length values than DGPD. This observation may be attributed to the presence of water molecules moving tangentially to the gas flow at the gas–water interface, resulting in dynamic stresses exerted on the gas surface due to relative motion, which leads to additional traction. The gas flow characteristics of dry pyrophyllite exhibit a more pronounced slip condition compared to those in contact with water, which is an intriguing finding. The slip length is notably larger for helium (He) and hydrogen (H2), and this trend correlates well with the divergence (Div) values. He and H2 have less affinity for the solid surface, leading to their greater mobility at the interface, resulting in higher slip velocity and subsequently increased slip length. Conversely, CO2 exhibits a strong affinity for the solid surface, resulting in a considerably lower slip length.
Viscosity of Water in Two-Phase Flow
The present study investigates the dynamic viscosity of the water film under partially saturated conditions for CGWPD. Figure 9 displays the dynamic viscosity as a function of the number of adsorbed water layers, which indicates the thickness of the adsorbed water film. The findings reveal that the dynamic viscosity of water increases with decreasing thickness of the adsorbed water film. This is consistent with the hypothesis that water molecules near the clay surface have lower mobility, which leads to a higher dynamic viscosity due to the interaction with the clay surface. At 3.5–1.8 water layers, the dynamic viscosity increases to about 2.0 cP, which is approximately twice the value observed in bulk water. This increase in viscosity is attributed to the fact that, in thin water films, water is more influenced by the clay surface, and mobility is lowered. These findings provide insights into the impact of adsorbed water thickness on water phase mobility near the clay surface and their effect on the dynamic viscosity of water in a CGWPD.
Figure 9.

Dynamic viscosity of water films confined in the Na-MMT clay slit pore as a function of the number of adsorbed water layers.
Conclusions
In this study, a comprehensive understanding of the mobility of gaseous molecules in partially saturated smectite clay (Na-montmorillonite) is provided using molecular dynamics simulations. The porosity of the fluid is subdivided into four distinct domains, including the solid–liquid interface, bulk-like liquid phase, liquid-gas interface, and bulk-like gas phase, based on density profiles. The diffusion coefficients of five types of gaseous molecules (Ar, He, H2, CO2, and CH4) are separately studied for diffusion in the gas phase and at the gas–water interface. It is found that diffusion in the gas phase increases with the gas-filled pore width, asymptotically converging to the diffusion of gas in the bulk state. Furthermore, the diffusion coefficient at the gas–water interface is observed to remain constant as long as it is confined by well-defined bulk-like liquid and gas domains. The system’s diffusive behavior is in a transition regime that comprises a mixture of molecular diffusion and Knudsen diffusion, thus rendering Fick’s law unsuitable for describing the process. To overcome this challenge, a Bosanquet-type approximation is used to describe the effective diffusion coefficient as a function of the adsorbed water film thickness, gas mean-free path, geometric factor, and average pore width, yielding highly satisfactory results.
Furthermore, an investigation into the partitioning of gases in the water-rich phase was conducted. Based on density profiles for gas molecules in two water-rich regions of interest in the system: (a) solid–liquid interface and (b) bulk-liquid-like phase, the partition coefficient and Gibbs free energy of gas transfer were determined. At the solid–liquid interface, adsorbed water layers are formed due to the interaction between water molecules and the clay surface. Our findings demonstrate that the partition coefficient is highly dependent on the temperature and molecular weight of the gaseous molecules.
The intrinsic nature of viscosity is confirmed by nonequilibrium molecular dynamics simulations at different degrees of saturation, where the dynamic viscosity of gases in decoupled gas-phase dynamics (DGPD) and combined gas and water phase dynamics (CGWPD) is found to be identical. Our modeling further reveals that the no-slip boundary condition often used in continuum models is unsuitable for strongly confined fluids and that the finite slip boundary condition should be applied instead. Moreover, the dynamic viscosity of water in CGWPD is observed to increase with decreasing thickness of the absorbed water film. Furthermore, our simulations demonstrate that the dynamic viscosity of gases is highly influenced by the interacting wall surface. These parameters are crucial input parameters for the subsequent step in this study, which involves the development of an upscale pore-scale model.
Acknowledgments
The research reported in this paper was supported by the EURAD GAS FUTURE and DONUT Work Packages, Laboratory for Waste Management at the Paul Scherrer Institute, NAGRA, and the University of Bern Geological Institute. Molecular dynamics simulations were carried out using resources from the Paul Scherrer Institute (MERLIN 6), the University of Bern (UBELIX), and the Swiss National Super Computing Centre (Piz Daint). The authors acknowledge cofunding from Horizon 2020 EURAD Project Grant ID 847593.
Supporting Information Available
The Supporting Information is available free of charge at https://pubs.acs.org/doi/10.1021/acs.jpcc.3c02264.
Plot of the gas diffusion coefficient as a function of gas-filled pore width at the fluid–gas interface; density distribution diagrams for gases and water; and velocity profile of gas flow in the gas-filled pore (PDF)
The authors declare no competing financial interest.
Supplementary Material
References
- Marschall P.; Horseman S.; Gimmi T. Characterisation of gas transport properties of the Opalinus Clay, a potential host rock formation for radioactive waste disposal. Oil Gas Sci. Technol. 2005, 60, 121–139. 10.2516/ogst:2005008. [DOI] [Google Scholar]
- Marty B.; Dewonck S.; France-Lanord C. Geochemical evidence for efficient aquifer isolation over geological timeframes. Nature 2003, 425, 55–58. 10.1038/nature01966. [DOI] [PubMed] [Google Scholar]
- Gimmi T.; Waber H.; Gautschi A.; Rübel A. Stable water isotopes in pore water of Jurassic argillaceous rocks as tracers for solute transport over large spatial and temporal scales. Water Resour. Res. 2007, 43, W01517 10.1029/2005WR004774. [DOI] [Google Scholar]
- Rowe R. K. Long-term performance of contaminant barrier systems. Geotechnique 2005, 55, 631–678. 10.1680/geot.2005.55.9.631. [DOI] [Google Scholar]
- Lo I. M. C.; Mak R. K.; Lee S. C. Modified clays for waste containment and pollutant attenuation. J. Environ. Eng. 1997, 123, 25–32. 10.1061/(ASCE)0733-9372(1997)123:1(25). [DOI] [Google Scholar]
- Kaufhold S.; Dohrmann R. Distinguishing between more and less suitable bentonites for storage of high-level radioactive waste. Clay Miner. 2016, 51, 289–302. 10.1180/claymin.2016.051.2.14. [DOI] [Google Scholar]
- Rodwell W.; Harris A.; Horseman S.; Lalieux P.; Müller W.; Ortiz Amaya L.; Pruess K.. Gas Migration and Two-phase Flow through Engineered and Geological Barriers for a Deep Repository for Radioactive Waste; European Commission, 1999.
- Poller A.; Mayer G.; Darcis M.; Smith P.. Modelling of Gas Generation in Deep Geological Repositories after Closure; IAEA, 2016.
- Diomidis N.; Cloet V.; Leupin O.; Marschall P.; Poller A.; Stein M.. Production, Consumption and Transport of Gases in Deep Geological Repositories According to the Swiss Disposal Concept, NAGRA Technical Report NTB-16-03; NAGRA, 2016.
- Patriarche D.; Ledoux E.; Michelot J.-L.; Simon-Coinçon R.; Savoye S. Diffusion as the main process for mass transport in very low water content argillites: 2. Fluid flow and mass transport modeling. Water Resour. Res. 2004, 40, W04410 10.1029/2003WR002700. [DOI] [Google Scholar]
- Bensenouci F.; Michelot J.; Matray J.; Savoye S.; Massault M.; Vinsot A. Coupled study of water-stable isotopes and anions in porewater for characterizing aqueous transport through the Mesozoic sedimentary series in the eastern Paris Basin. Mar. Pet. Geol. 2014, 53, 88–101. 10.1016/j.marpetgeo.2013.12.012. [DOI] [Google Scholar]
- Gimmi T.; Schneebeli M.; Flühler H.; Wydler H.; Baer T. Field-scale water transport in unsaturated crystalline rock. Water Resour. Res. 1997, 33, 589–598. 10.1029/96WR03974. [DOI] [Google Scholar]
- Armand G.; Djizanne H.; Zghondi J.; de La Vaissière R.; Talandier J.; Conil N. Inputs from in situ experiments to the understanding of the unsaturated behaviour of Callovo-Oxfordian claystone. E3S Web Conf. 2016, 9, 03004 10.1051/e3sconf/20160903004. [DOI] [Google Scholar]
- Churakov S. V. Mobility of Na and Cs on montmorillonite surface under partially saturated conditions. Environ. Sci. Technol. 2013, 47, 9816–9823. 10.1021/es401530n. [DOI] [PubMed] [Google Scholar]
- Gimmi T.; Churakov S. V. Water retention and diffusion in unsaturated clays: Connecting atomistic and pore scale simulations. Appl. Clay Sci. 2019, 175, 169–183. 10.1016/j.clay.2019.03.035. [DOI] [Google Scholar]
- Kozaki T.; Sato H.; Sato S.; Ohashi H. Diffusion mechanism of cesium ions in compacted montmorillonite. Eng. Geol. 1999, 54, 223–230. 10.1016/S0013-7952(99)00077-0. [DOI] [Google Scholar]
- Nakashima Y. Diffusivity measurement of heavy ions in Wyoming montmorillonite gels by X-ray computed tomography. J. Contam. Hydrol. 2003, 61, 147–156. 10.1016/S0169-7722(02)00138-9. [DOI] [PubMed] [Google Scholar]
- Glaus M. A.; Frick S.; Rossé R.; Van Loon L. R. Comparative study of tracer diffusion of HTO, 22Na+ and 36Cl- in compacted kaolinite, illite and montmorillonite. Geochim. Cosmochim. Acta 2010, 74, 1999–2010. 10.1016/j.gca.2010.01.010. [DOI] [Google Scholar]
- Appelo C.; Van Loon L.; Wersin P. Multicomponent diffusion of a suite of tracers (HTO, Cl, Br, I, Na, Sr, Cs) in a single sample of Opalinus Clay. Geochim. Cosmochim. Acta 2010, 74, 1201–1219. 10.1016/j.gca.2009.11.013. [DOI] [Google Scholar]
- Loomer D. B.; Scott L.; Al T. A.; Mayer K. U.; Bea S. Diffusion-reaction studies in low permeability shale using X-ray radiography with cesium. Appl. Geochem. 2013, 39, 49–58. 10.1016/j.apgeochem.2013.09.019. [DOI] [Google Scholar]
- Lippmann-Pipke J.; Gerasch R.; Schikora J.; Kulenkampff J. Benchmarking PET for geoscientific applications: 3D quantitative diffusion coefficient determination in clay rock. Comput. Geosci. 2017, 101, 21–27. 10.1016/j.cageo.2017.01.002. [DOI] [Google Scholar]
- Wersin P.; Van Loon L.; Soler J.; Yllera A.; Eikenberg J.; Gimmi T.; Hernán P.; Boisson J.-Y. Long-term diffusion experiment at Mont Terri: first results from field and laboratory data. Appl. Clay Sci. 2004, 26, 123–135. 10.1016/j.clay.2003.09.007. [DOI] [Google Scholar]
- Bourg I. C.; Bourg A. C.; Sposito G. Modeling diffusion and adsorption in compacted bentonite: a critical review. J. Contam. Hydrol. 2003, 61, 293–302. 10.1016/S0169-7722(02)00128-6. [DOI] [PubMed] [Google Scholar]
- Jacops E.; Volckaert G.; Maes N.; Weetjens E.; Govaerts J. Determination of gas diffusion coefficients in saturated porous media: He and CH4 diffusion in Boom Clay. Appl. Clay Sci. 2013, 83–84, 217–223. 10.1016/j.clay.2013.08.047. [DOI] [Google Scholar]
- Bigler T.; Beat I.; Lehmann B. E.; Niklaus Waber H.; Vinsot A.; Latoui K.; Tolstikhin I.; Gautschi A. In Helium Production and Transport in the Low-Permeability Callovo-Oxfordian at the Bure site, France, 2nd Intern. Conf. Clays in Natural and Engineered Barriers for Radioactive Waste Confinement, 2005.
- Vinsot A.; Appelo C. A. J.; Lundy M.; Wechner S.; Cailteau-Fischbach C.; Donato P.; Pironon J.; Lettry Y.; Lerouge C.; Cannière P. D.. Mont Terri Rock Laboratory, 20 Years; Springer, 2018; pp 377–392. [Google Scholar]
- Bensenouci F.; Michelot J.; Matray J.; Savoye S.; Lavielle B.; Thomas B.; Dick P. A profile of helium-4 concentration in pore-water for assessing the transport phenomena through an argillaceous formation (Tournemire, France). Phys. Chem. Earth, Parts A/B/C 2011, 36, 1521–1530. 10.1016/j.pce.2011.10.016. [DOI] [Google Scholar]
- Rübel A. P.; Sonntag C.; Lippmann J.; Pearson F.; Gautschi A. Solute transport in formations of very low permeability: Profiles of stable isotope and dissolved noble gas contents of pore water in the Opalinus Clay, Mont Terri, Switzerland. Geochim. Cosmochim. Acta 2002, 66, 1311–1321. 10.1016/S0016-7037(01)00859-6. [DOI] [Google Scholar]
- Krooss B.; Leythaeuser D. Experimental measurements of the diffusion parameters of light hydrocarbons in water-saturated sedimentary rocks—II. Results and geochemical significance. Org. Geochem. 1988, 12, 91–108. 10.1016/0146-6380(88)90247-1. [DOI] [Google Scholar]
- Rebour V.; Billiotte J.; Deveughele M.; Jambon A.; Le Guen C. Molecular diffusion in water-saturated rocks: A new experimental method. J. Contam. Hydrol. 1997, 28, 71–93. 10.1016/S0169-7722(96)00051-4. [DOI] [Google Scholar]
- Jacops E.; Maes N.; Bruggeman C.; Grade A. Measuring diffusion coefficients of dissolved He and Ar in three potential clay host formations: Boom Clay, Callovo-Oxfordian Clay and Opalinus Clay. Geol. Soc. London, Spec. Publ. 2017, 443, 349–360. 10.1144/SP443.1. [DOI] [Google Scholar]
- Sutton R.; Sposito G. Molecular simulation of interlayer structure and dynamics in 12.4 Å Cs-smectite hydrates. J. Colloid Interface Sci. 2001, 237, 174–184. 10.1006/jcis.2000.7416. [DOI] [PubMed] [Google Scholar]
- Marry V.; Turq P. Microscopic simulations of interlayer structure and dynamics in bihydrated heteroionic montmorillonites. J. Phys. Chem. B 2003, 107, 1832–1839. 10.1021/jp022084z. [DOI] [Google Scholar]
- Kosakowski G.; Churakov S. V.; Thoenen T. Diffusion of Na and Cs in montmorillonite. Clays Clay Miner. 2008, 56, 190–206. 10.1346/CCMN.2008.0560205. [DOI] [Google Scholar]
- Churakov S. V.; Dahn R. Zinc adsorption on clays inferred from atomistic simulations and EXAFS spectroscopy. Environ. Sci. Technol. 2012, 46, 5713–5719. 10.1021/es204423k. [DOI] [PubMed] [Google Scholar]
- Churakov S. V.; Gimmi T. Up-scaling of molecular diffusion coefficients in clays: A two-step approach. J. Phys. Chem. C 2011, 115, 6703–6714. 10.1021/jp112325n. [DOI] [Google Scholar]
- Torgersen T.; Kennedy B.; van Soest M. Diffusive separation of noble gases and noble gas abundance patterns in sedimentary rocks. Earth Planet. Sci. Lett. 2004, 226, 477–489. 10.1016/j.epsl.2004.07.030. [DOI] [Google Scholar]
- He S.; Jiang Y.; Conrad J. C.; Qin G. Molecular simulation of natural gas transport and storage in shale rocks with heterogeneous nano-pore structures. J. Pet. Sci. Eng. 2015, 133, 401–409. 10.1016/j.petrol.2015.06.029. [DOI] [Google Scholar]
- Gadikota G.; Dazas B.; Rother G.; Cheshire M. C.; Bourg I. C. Hydrophobic solvation of gases (CO2, CH4, H2, noble gases) in clay interlayer nanopores. J. Phys. Chem. C 2017, 121, 26539–26550. 10.1021/acs.jpcc.7b09768. [DOI] [Google Scholar]
- Jiang W.; Lin M. Molecular dynamics investigation of conversion methods for excess adsorption amount of shale gas. J. Nat. Gas Sci. Eng. 2018, 49, 241–249. 10.1016/j.jngse.2017.11.006. [DOI] [Google Scholar]
- Zhu H.-L.; Wang S.-F.; Yin G.-J.; Chen Q.; Xu F.-L.; Peng W.; Tan Y.-H.; Zhang K. Study of the numerical simulation of tight sandstone gas molecular diffusion based on digital core technology. Pet. Sci. 2018, 15, 68–76. 10.1007/s12182-017-0210-1. [DOI] [Google Scholar]
- Owusu J. P.; Karalis K.; Prasianakis N. I.; Churakov S. V. Mobility of Dissolved Gases in Smectites under Saturated Conditions: Effects of Pore Size, Gas Types, Temperature, and Surface Interaction. J. Phys. Chem. C 2022, 126, 17441–17455. 10.1021/acs.jpcc.2c05678. [DOI] [Google Scholar]
- Le Crom S.; Tournassat C.; Robinet J.-C.; Marry V. Influence of Water Saturation Level on Electrical Double Layer Properties in a Clay Mineral Mesopore: A Molecular Dynamics Study. J. Phys. Chem. C 2022, 126, 647–654. 10.1021/acs.jpcc.1c08637. [DOI] [Google Scholar]
- Brusseau M. L.; Popovicova J.; Silva J. A. Characterizing gas- water interfacial and bulk-water partitioning for gas-phase transport of organic contaminants in unsaturated porous media. Environ. Sci. Technol. 1997, 31, 1645–1649. 10.1021/es960475j. [DOI] [Google Scholar]
- Ellis C. S.; Holsen J. Diffusion coefficients for He-N2 and N2-CO2 at elevated temperatures. Ind. Eng. Chem. Fundam. 1969, 8, 787–791. 10.1021/i160032a030. [DOI] [Google Scholar]
- Jähne B.; Heinz G.; Dietrich W. Measurement of the diffusion coefficients of sparingly soluble gases in water. J. Geophys. Res.: Oceans 1987, 92, 10767–10776. 10.1029/JC092iC10p10767. [DOI] [Google Scholar]
- Mohammed S.; Gadikota G. The effect of hydration on the structure and transport properties of confined carbon dioxide and methane in calcite nanopores. Front. Energy Res. 2018, 6, 86 10.3389/fenrg.2018.00086. [DOI] [Google Scholar]
- Schaefer C.; Arands R.; Van der Sloot H.; Kosson D. Modeling of the gaseous diffusion coefficient through unsaturated soil systems. J. Contam. Hydrol. 1997, 29, 1–21. 10.1016/S0169-7722(96)00097-6. [DOI] [Google Scholar]
- Wesenauer F.; Jordan C.; Azam M.; Harasek M.; Winter F. Considerations on Temperature Dependent Effective Diffusion and Permeability of Natural Clays. Materials 2021, 14, 4942 10.3390/ma14174942. [DOI] [PMC free article] [PubMed] [Google Scholar]
- Bardelli F.; Mondelli C.; Didier M.; Vitillo J. G.; Cavicchia D. R.; Robinet J.-C.; Leone L.; Charlet L. Hydrogen uptake and diffusion in Callovo-Oxfordian clay rock for nuclear waste disposal technology. Appl. Geochem. 2014, 49, 168–177. 10.1016/j.apgeochem.2014.06.019. [DOI] [Google Scholar]
- Chen L. L.-y.; Katz D. L.; Tek M. R. Binary gas diffusion of methane-nitrogen through porous solids. AIChE J. 1977, 23, 336–341. 10.1002/aic.690230317. [DOI] [Google Scholar]
- Kristensen A. H.; Thorbjørn A.; Jensen M. P.; Pedersen M.; Moldrup P. Gas-phase diffusivity and tortuosity of structured soils. J. Contam. Hydrol. 2010, 115, 26–33. 10.1016/j.jconhyd.2010.03.003. [DOI] [PubMed] [Google Scholar]
- Michels L.; Méheust Y.; Altoe M. A.; Dos Santos É. C.; Hemmen H.; Droppa R. Jr.; Fossum J. O.; da Silva G. J. Water vapor diffusive transport in a smectite clay: Cationic control of normal versus anomalous diffusion. Phys. Rev. E 2019, 99, 013102 10.1103/PhysRevE.99.013102. [DOI] [PubMed] [Google Scholar]
- Fick A. Poggendorff’s flannel. Physik 1855, 94, 297. [Google Scholar]
- Webb S. W.; Pruess K. The use of Fick’s law for modeling trace gas diffusion in porous media. Transp. Porous Media 2003, 51, 327–341. 10.1023/A:1022379016613. [DOI] [Google Scholar]
- Donev A.; Fai T. G.; Vanden-Eijnden E. A reversible mesoscopic model of diffusion in liquids: from giant fluctuations to Fick’s law. J. Stat. Mech.: Theory Exp. 2014, 2014, P04004 10.1088/1742-5468/2014/04/P04004. [DOI] [Google Scholar]
- Wei X.; Wang G.; Massarotto P.; Golding S.; Rudolph V. Numerical simulation of multicomponent gas diffusion and flow in coals for CO2 enhanced coalbed methane recovery. Chem. Eng. Sci. 2007, 62, 4193–4203. 10.1016/j.ces.2007.04.032. [DOI] [Google Scholar]
- Van Milligen B. P.; Bons P.; Carreras B. A.; Sanchez R. On the applicability of Fick’s law to diffusion in inhomogeneous systems. Eur. J. Phys. 2005, 26, 913. 10.1088/0143-0807/26/5/023. [DOI] [Google Scholar]
- Hoteit H.; Firoozabadi A. Numerical modeling of diffusion in fractured media for gas-injection and-recycling schemes. SPE J. 2009, 14, 323–337. 10.2118/103292-PA. [DOI] [Google Scholar]
- Fedoseev A. V.; Demin N.; Salnikov M.; Sukhinin G. Numerical modelling of heat and moisture transfer in a clay-like porous material. J. Phys.: Conf. Ser. 2018, 1105, 012048 10.1088/1742-6596/1105/1/012048. [DOI] [Google Scholar]
- Altmann S.; Tournassat C.; Goutelard F.; Parneix J.-C.; Gimmi T.; Maes N. Diffusion-driven transport in clayrock formations. Appl. Geochem. 2012, 27, 463–478. 10.1016/j.apgeochem.2011.09.015. [DOI] [Google Scholar]
- Thorstenson D. C.; Pollock D. W. Gas transport in unsaturated porous media: The adequacy of Fick’s law. Rev. Geophys. 1989, 27, 61–78. 10.1029/RG027i001p00061. [DOI] [Google Scholar]
- Apostolopoulou M.; Santos M. S.; Hamza M.; Bui T.; Economou I. G.; Stamatakis M.; Striolo A. Quantifying pore width effects on diffusivity via a novel 3D stochastic approach with input from atomistic molecular dynamics simulations. J. Chem. Theory Comput. 2019, 15, 6907–6922. 10.1021/acs.jctc.9b00776. [DOI] [PubMed] [Google Scholar]
- Wang S.; Javadpour F.; Feng Q. Molecular dynamics simulations of oil transport through inorganic nanopores in shale. Fuel 2016, 171, 74–86. 10.1016/j.fuel.2015.12.071. [DOI] [Google Scholar]
- Frentrup H.; Avendaño C.; Horsch M.; Salih A.; Müller E. A. Transport diffusivities of fluids in nanopores by non-equilibrium molecular dynamics simulation. Mol. Simul. 2012, 38, 540–553. 10.1080/08927022.2011.636813. [DOI] [Google Scholar]
- Zhao Y.; Luo M.; Liu L.; Wu J.; Chen M.; Zhang L. Molecular dynamics simulations of shale gas transport in rough nanopores. J. Pet. Sci. Eng. 2022, 217, 110884 10.1016/j.petrol.2022.110884. [DOI] [Google Scholar]
- Sui H.; Yao J.; Zhang L. Molecular simulation of shale gas adsorption and diffusion in clay nanopores. Computation 2015, 3, 687–700. 10.3390/computation3040687. [DOI] [Google Scholar]
- Wang S.; Feng Q.; Zha M.; Javadpour F.; Hu Q. Supercritical methane diffusion in shale nanopores: effects of pressure, mineral types, and moisture content. Energy Fuels 2018, 32, 169–180. 10.1021/acs.energyfuels.7b02892. [DOI] [Google Scholar]
- Kadoura A.; Narayanan Nair A. K.; Sun S. Molecular dynamics simulations of carbon dioxide, methane, and their mixture in montmorillonite clay hydrates. J. Phys. Chem. C 2016, 120, 12517–12529. 10.1021/acs.jpcc.6b02748. [DOI] [Google Scholar]
- Plimpton S. Fast parallel algorithms for short-range molecular dynamics. J. Comput. Phys. 1995, 117, 1–19. 10.1006/jcph.1995.1039. [DOI] [Google Scholar]
- Nosé S. A unified formulation of the constant temperature molecular dynamics methods. J. Chem. Phys. 1984, 81, 511–519. 10.1063/1.447334. [DOI] [Google Scholar]
- Nosé S. A molecular dynamics method for simulations in the canonical ensemble. Mol. Phys. 1984, 52, 255–268. 10.1080/00268978400101201. [DOI] [Google Scholar]
- Ryckaert J.-P.; Ciccotti G.; Berendsen H. J. Numerical integration of the cartesian equations of motion of a system with constraints: molecular dynamics of n-alkanes. J. Comput. Phys. 1977, 23, 327–341. 10.1016/0021-9991(77)90098-5. [DOI] [Google Scholar]
- Liu P.; Harder E.; Berne B. On the calculation of diffusion coefficients in confined fluids and interfaces with an application to the liquid- vapor interface of water. J. Phys. Chem. B 2004, 108, 6595–6602. 10.1021/jp0375057. [DOI] [Google Scholar]
- Martin M. G.; Siepmann J. I. Predicting multicomponent phase equilibria and free energies of transfer for alkanes by molecular simulation. J. Am. Chem. Soc. 1997, 119, 8921–8924. 10.1021/ja964218q. [DOI] [Google Scholar]
- Wick C. D.; Siepmann J. I.; Schure M. R. Temperature dependence of transfer properties: Importance of heat capacity effects. J. Phys. Chem. B 2003, 107, 10623–10627. 10.1021/jp0223556. [DOI] [Google Scholar]
- Woessner D. E.; Snowden B. Jr.; George R.; Melrose J. Dense gas diffusion coefficients for the methane-propane system. Ind. Eng. Chem. Fundam. 1969, 8, 779–786. 10.1021/i160032a029. [DOI] [Google Scholar]
- Robb W. L.; Drickamer H. Diffusion in CO2 up to 150-Atmospheres Pressure. J. Chem. Phys. 1951, 19, 1504–1508. 10.1063/1.1748110. [DOI] [Google Scholar]
- Groß T.; Buchhauser J.; Lüdemann H.-D. Self-diffusion in fluid carbon dioxide at high pressures. J. Chem. Phys. 1998, 109, 4518–4522. 10.1063/1.477055. [DOI] [Google Scholar]
- Chen L.; Groß T.; Krienke H.; Lüdemann H.-D. T, p-Dependence of the self-diffusion and spin-lattice relaxation in fluid hydrogen and deuterium. Phys. Chem. Chem. Phys. 2001, 3, 2025–2030. 10.1039/b101215k. [DOI] [Google Scholar]
- Slattery J. C.; Bird R. B. Calculation of the diffusion coefficient of dilute gases and of the self-diffusion coefficient of dense gases. AIChE J. 1958, 4, 137–142. 10.1002/aic.690040205. [DOI] [Google Scholar]
- Stiel L. I.; Thodos G. The self-diffusivity of dilute and dense gases. Can. J. Chem. Eng. 1965, 43, 186–190. 10.1002/cjce.5450430407. [DOI] [Google Scholar]
- Lamb W. J.; Hoffman G.; Jonas J. Self-diffusion in compressed supercritical water. J. Chem. Phys. 1981, 74, 6875–6880. 10.1063/1.441097. [DOI] [Google Scholar]
- Hirschfelder J. O.; Curtiss C. F.; Bird R. B.. Molecular Theory of Gases and Liquids; John Wiley & Sons, Inc., 1964. [Google Scholar]
- Chapman S.; Cowling T. G.. The Mathematical Theory of Non-uniform Gases: An Account of the Kinetic Theory of Viscosity, Thermal Conduction and Diffusion in Gases; Cambridge University Press: Cambridge, U.K., 1990; pp 25–45. [Google Scholar]
- Shimmo M.; Saarnio K.; Aalto P.; Hartonen K.; Hyötyläinen T.; Kulmala M.; Riekkola M.-L. Particle size distribution and gas-particle partition of polycyclic aromatic hydrocarbons in Helsinki urban area. J. Atmos. Chem. 2004, 47, 223. 10.1023/B:JOCH.0000021088.37771.f7. [DOI] [Google Scholar]
- Smedes F.; Geertsma R. W.; van der Zande T.; Booij K. Polymer-water partition coefficients of hydrophobic compounds for passive sampling: Application of cosolvent models for validation. Environ. Sci. Technol. 2009, 43, 7047–7054. 10.1021/es9009376. [DOI] [PubMed] [Google Scholar]
- Staikova M.; Wania F.; Donaldson D. Molecular polarizability as a single-parameter predictor of vapour pressures and octanol-air partitioning coefficients of non-polar compounds: a priori approach and results. Atmos. Environ. 2004, 38, 213–225. 10.1016/j.atmosenv.2003.09.055. [DOI] [Google Scholar]
- Chenzhong C.; Zhiliang L. Molecular polarizability. 1. Relationship to water solubility of alkanes and alcohols. J. Chem. Inf. Comput. Sci. 1998, 38, 1–7. 10.1021/ci9601729. [DOI] [Google Scholar]
- Raevsky O. A.; Perlovich G. L.; Kazachenko V. P.; Strakhova N. N.; Schaper K.-J. Octanol/water partition coefficients of sulfonamides: experimental determination and calculation using physicochemical descriptors. J. Chem. Eng. Data 2009, 54, 3121–3124. 10.1021/je900189v. [DOI] [Google Scholar]
- Lewis D. F. V. The calculation of molar polarizabilities by the CNDO/2 method: Correlation with the hydrophobic parameter, log P. J. Comput. Chem. 1989, 10, 145–151. 10.1002/jcc.540100202. [DOI] [Google Scholar]
- Pollard W. G.; Present R. D. On gaseous self-diffusion in long capillary tubes. Phys. Rev. 1948, 73, 762. 10.1103/PhysRev.73.762. [DOI] [Google Scholar]
- Krishna R.; van Baten J. M. Investigating the validity of the Bosanquet formula for estimation of diffusivities in mesopores. Chem. Eng. Sci. 2012, 69, 684–688. 10.1016/j.ces.2011.11.026. [DOI] [Google Scholar]
- Yin Y.; Qu Z.; Zhang J. Multiple diffusion mechanisms of shale gas in nanoporous organic matter predicted by the local diffusivity lattice Boltzmann model. Int. J. Heat Mass Transfer 2019, 143, 118571 10.1016/j.ijheatmasstransfer.2019.118571. [DOI] [Google Scholar]
- Guo Y.; He X.; Huang W.; Wang M. Microstructure effects on effective gas diffusion coefficient of nanoporous materials. Transp. Porous Media 2019, 126, 431–453. 10.1007/s11242-018-1165-4. [DOI] [Google Scholar]
- Tomadakis M. M.; Sotirchos S. V. Ordinary and transition regime diffusion in random fiber structures. AIChE J. 1993, 39, 397–412. 10.1002/aic.690390304. [DOI] [Google Scholar]
- Ruthven D. M.; Kärger J.; Theodorou D. N.. Diffusion in Nanoporous Materials; John Wiley & Sons, 2012; pp 85–108. [Google Scholar]
- Chen Q.; Zhou J. Investigating the validity of the Bosanquet equation for predicting the self-diffusivities of fluids inside nanotubes using equilibrium molecular dynamics simulations. AIP Adv. 2023, 13, 025338 10.1063/5.0137310. [DOI] [Google Scholar]
- Boţan A.; Rotenberg B.; Marry V.; Turq P.; Noetinger B. Hydrodynamics in clay nanopores. J. Phys. Chem. C 2011, 115, 16109–16115. 10.1021/jp204772c. [DOI] [Google Scholar]
- Haynes W. M.CRC Handbook of Chemistry and Physics; CRC Press, 2004; Vol. 97, pp 6–262. [Google Scholar]
- Squires T. M.; Quake S. R. Microfluidics: Fluid physics at the nanoliter scale. Rev. Mod. Phys. 2005, 77, 977. 10.1103/RevModPhys.77.977. [DOI] [Google Scholar]
- Marry V.; Dufrêche J.-F.; Jardat M.; Turq P. Equilibrium and electrokinetic phenomena in charged porous media from microscopic and mesoscopic models: electro-osmosis in montmorillonite. Mol. Phys. 2003, 101, 3111–3119. 10.1080/00268970310001626432. [DOI] [Google Scholar]
- Vogel E. Reference viscosity of argon at low density in the temperature range from 290 K to 680 K. Int. J. Thermophys. 2010, 31, 447–461. 10.1007/s10765-010-0760-6. [DOI] [Google Scholar]
- May E. F.; Berg R. F.; Moldover M. R. Reference viscosities of H2, CH4, Ar, and Xe at low densities. Int. J. Thermophys. 2007, 28, 1085–1110. 10.1007/s10765-007-0198-7. [DOI] [Google Scholar]
- Cencek W.; Przybytek M.; Komasa J.; Mehl J. B.; Jeziorski B.; Szalewicz K. Effects of adiabatic, relativistic, and quantum electrodynamics interactions on the pair potential and thermophysical properties of helium. J. Chem. Phys. 2012, 136, 224303 10.1063/1.4712218. [DOI] [PubMed] [Google Scholar]
- Laesecke A.; Muzny C. D. Reference correlation for the viscosity of carbon dioxide. J. Phys. Chem. Ref. Data 2017, 46, 013107 10.1063/1.4977429. [DOI] [PMC free article] [PubMed] [Google Scholar]
- Laesecke A.; Muzny C. D. Ab Initio Calculated Results Require New Formulations for Properties in the Limit of Zero Density: The Viscosity of Methane (CH_4 CH 4). Int. J. Thermophys. 2017, 38, 182 10.1007/s10765-017-2305-8. [DOI] [Google Scholar]
- Barber R. W.; Emerson D. R. Challenges in modeling gas-phase flow in microchannels: from slip to transition. Heat Transfer Eng. 2006, 27, 3–12. 10.1080/01457630500522271. [DOI] [Google Scholar]
- Agrawal A.; Prabhu S. Deduction of slip coefficient in slip and transition regimes from existing cylindrical Couette flow data. Exp. Therm. Fluid Sci. 2008, 32, 991–996. 10.1016/j.expthermflusci.2007.11.010. [DOI] [Google Scholar]
- Dongari N.; Sambasivam R.; Durst F. Extended Navier-Stokes equations and treatments of micro-channel gas flows. J. Fluid Sci. Technol. 2009, 4, 454–467. 10.1299/jfst.4.454. [DOI] [Google Scholar]
- Michalis V. K.; Kalarakis A. N.; Skouras E. D.; Burganos V. N. Rarefaction effects on gas viscosity in the Knudsen transition regime. Microfluid. Nanofluid. 2010, 9, 847–853. 10.1007/s10404-010-0606-3. [DOI] [Google Scholar]
Associated Data
This section collects any data citations, data availability statements, or supplementary materials included in this article.