Abstract
A flexible nanocomposite film based on polyvinyl alcohol (PVA), silver nanoparticles, and calcium titanate (CaTiO3) was synthesized using gamma radiation induced-reduction. Temperature-dependent structural, optical, DC electrical conductivity, electric modulus, and dielectric properties of PVA/Ag/CaTiO3 nanocomposite film were investigated. The XRD pattern proved the successful preparation of the nanocomposite film. Also, as the temperature increases, the average crystallite sizes of CaTiO3 and Ag nanoparticles decrease from 19.8 to 9.7 nm and 25 to 14.8 nm, respectively. Further, the optical band gap increased from 5.75 to 5.84 eV with increasing temperature. The thermal stability is improved, and the semiconductor behavior for PVA/Ag/CaTiO3 nanocomposite film is confirmed by thermal activation energy ΔE with values in the 0.11–0.8 eV range. Furthermore, the maximum barrier Wm value was found of 0.29 eV. PVA/Ag/CaTiO3 nanocomposite film exhibits a semicircular arc originating from the material’s grain boundary contributions for all temperatures. The optical, DC electrical conductivity, and dielectric properties of the PVA/Ag/CaTiO3 nanocomposite film can be suitable for flexible electronic devices such as electronic chips, optoelectronics, and energy storage applications.
Subject terms: Optics and photonics, Physics, Materials science, Materials for devices, Materials for optics
Introduction
It is well known that mixing polymers and nanomaterials generates unusual molecular interactions essential in improving the overall system properties1. Polymer nanocomposites have attracted great interest due to their unique properties, allowing them to be used in specific applications such as energy storage and optoelectronic devices. Usually, polymers are utilized as a host material for nanoparticles NPs. Adding NPs into the polymer matrix improves the properties of the polymer, as they significantly improve the characteristics of the polymer nanocomposites when compared to the pristine polymer, owing to their high surface-to-volume ratio2.
Polyvinyl alcohol (PVA) has emerged as one of the most efficient and widely used polymeric materials; it has been utilized in numerous technological applications such as encapsulation of photovoltaic devices, sensors, electronic coatings for noise reduction, drug delivery systems, and reinforcement fibers in cement, etc. The wide range of applications of PVA is because of its remarkable properties such as low cost, good film-forming ability, high tensile strength, flexibility, excellent chemical resistance, and water solubility3,4. Due to its ease of processing and chemical stability, PVA is widely used to fabricate various polymer composites5–8.
Recently, perovskite materials with a general formula ABO3 have attracted significant research interest. Owing to their diverse physical properties, such as structural flexibility, tunable band gap, low-cost production, electron mobility, and high thermal stability9, perovskite materials have been widely used in several applications such as photovoltaic devices, batteries, photodetectors, sensing devices, light emitting diodes, fuel cells, and photocatalysis4. Many previous studies have highlighted the properties and applications of several perovskite materials such as SrZrO3, SrRuO3, CaGeO3, PbTiO3, SrTiO3, BaTiO3, GdFeO3 and CaTiO310,11. Among these perovskites, Calcium titanate (CaTiO3), has gained much interest due to its remarkable properties of optoelectronic, ferroelectricity, and photocatalytic activity12. Calcium titanate CaTiO3 is an n-type semiconductor13 with a perovskite structure; it possesses excellent characteristics, such as earth-abundance and non-toxicity of its constituent elements, cost-effective, high dielectric constant, ease of synthesis, and high chemical stability14. Several methods have been reported to prepare CaTiO3, such as solid-state reaction15, co-precipitation16, mechano-chemical milling, sol–gel17, and hydrothermal process18.
CaTiO3 has three phases: orthorhombic, tetragonal, or cubic structure. The cubic structure is stable at a temperature higher than 1374 °C, the tetragonal structure is stable at temperatures 1250–1350 °C, and the orthorhombic structure is stable at a temperature lower than 1213 °C. Owing to these excellent properties, CaTiO3 has been considered a promising candidate to be combined with PVA to form a polymer nanocomposite with a wide range of applications3,4. Several studies have reported that loading nanosized metal to CaTiO3 improves its optical, electrical, and photocatalytic properties and stabilizes the composite. The addition of silver nanoparticles (Ag NPs) to CaTiO3 has shown improved performance for the overall composite19.
The radiation procedure for nanoparticle production is remarkably simple; it typically involves irradiating aqueous solutions holding appropriate precursors with gamma rays or accelerated electrons at room temperature. In many cases, there is not much difference in the quality of nanoparticles generated via gamma or accelerated electron irradiation. Depending on the intended use, the nanoscale solid phase or colloidal nanoparticles generated in a radiation environment may be subjected to further processing steps. Certain enhanced forms of the radiation technique also permit the rapid creation of massive quantities of powder materials at the micro or nano size, making them suitable for large-scale industrial scales20. With advantages like using non- or low-toxic precursors, non-toxic solvents, low reaction waste product growth, low dangerous waste generation, and few chemical reagents, radiation-induced processes, especially those that exploit the interaction of ionizing radiation with solvents, might offer a unique opportunity of competing with conventional processes for achieving essential objectives in a synthesis process21.
Generally, the Ag NPs are short-lived in an aqueous solution because they agglomerate quickly. Many research studies have gamma radiation to reduce the silver ions22. Among the several synthesizing techniques of Ag NPs, the reduction of Ag ions by gamma radiation has shown some advantages, such as the full reduction of metal precursors, high stability, and being environmentally safe23,24. In our previous work, we reported the gamma radiation induced-synthesis of Ag/NiMn2O4 for energy storage25, chitosan/Ag/Mn-Mg ferrite composite for plant growth26, and Ag/MoS2/ZnCo2O4 for wastewater treatment applications27. In this work, we reported, for the first time, the synthesis of a novel PVA/Ag/CaTiO3 nanocomposite by gamma irradiation. Afterward, we investigated the effect of temperature on structural, optical, thermal, DC electrical conductivity and dielectric properties of the polymer nanocomposite.
Materials and methods
The polyvinyl alcohol (PVA) with Mw = 125,000 gm/mole, calcium carbonate (CaCO3), titanium dioxide (TiO2) were procured from Sigma-Aldrich, isopropanol, and silver nitrate (AgNO3) were purchased from Merck.
Preparation of calcium titanate nanopowder
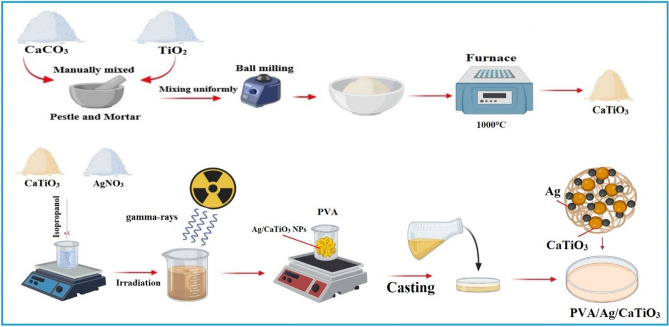
Calcium titanate powder was prepared from calcium carbonate (CaCO3) and titanium dioxide (TiO2) by solid-state reactions method. The raw materials were weighed by the stoichiometric 1:1 (Ca: Ti) molar ratio. Then, the powder was ground by pestle and mortar for 30 min and in a ball milling for 8 h. After the homogenization, mixtures were sintered in an air-resistive furnace at temperatures of 1000 °C for 2 h with a heating rate of 10 °C/h. Finally, the powder was manually crushed with a pestle and mortar to obtain a uniform CaTiO3 powder.
Fabrication of PVA/Ag/calcium titanate nanocomposite
0.5 g of AgNO3 was added to 2 g of CaTiO3 and 10 ml of isopropanol and stirred for 60 min using magnetic stirring. Then, the examined samples' solutions were irradiated with 50 kGy (dose rate of 0.8 kGy/h) at ambient conditions28. The radiation process was achieved using Co-60 gamma-cell sources29–31. As presented in previous work26,32,33, water radiolysis induced by gamma rays in an aqueous Ag+ solution results in the generation of a significant number of highly effective reducing (hydrated electrons (e−aq), hydrogen atoms (H⋅), and oxidizing radicals as HO⋅. Ag NPs are formed when silver ions are converted to silver atoms, which serve as individual nucleation centers, and subsequent coalescence forms Ag NPs. Isopropyl alcohol (isopropanol) may be used to scavenge the ⋅OH produced by radiation.
A solution of 6 wt% PVA was made by dissolving 6 g of PVA in 100 ml of deionized water at 70 °C. while stirring the mixture constantly until a homogenous solution had been achieved. After that, a specified concentration of Ag/CaTiO3 was mixed with PVA solution for 2 h during stirring. The thick solution was cast onto a transparent glass plate using a film applicator and left to dry. After one week of drying in air at room temperature, the PVA/Ag/CaTiO3 nanocomposite was scraped off of the glass plate, see Fig. 1. After that, the PVA/Ag/CaTiO3 nanocomposite films were exposed to different temperatures (313, 323, 333, 343, 353, 363, and 373 K) for 30 min.
Figure 1.
Schematic representation of the PVA/Ag/CaTiO3 nanocomposite film synthesis.
Characterization of PVA/Ag/CaTiO3 nanocomposite
The crystal structure and phase analysis of pure CaTiO3, Ag/CaTiO3 NPs, and PVA/Ag/CaTiO3 nanocomposite were characterized via XRD Shimadzu 6000 with 40 kV and 30 mA and scanning rate of 8°/min as operating conditions. Fourier transforms infrared (FT-IR) spectroscopy has been employed to identify the functional groups in CaTiO3 powder and PVA/Ag/CaTiO3 nanocomposite films (NICOLET iS10 model instrument). Moreover, high-resolution transmission electron microscopy (HR-TEM, (JEOL-JEM-100 CX)) was used to provide sufficient information on the particle size and the selected area electron diffraction (SAED) pattern of Ag/CaTiO3 NPs. A scanning electron microscope (SEM, (JEOL JSM-5600 LV, Japan)), at variable vacuum without any coating at 12 kV accelerating voltage with a back-scatter detector, was also employed to develop surface images of PVA/Ag/CaTiO3 nanocomposite to provide a clear insight into the morphology of the PVA/Ag/CaTiO3 nanocomposite film surface. The energy-dispersive X-ray analysis spectra were also used to acquire the elemental composition and mapping pictures (EDX, JEOL JSM-5600 LV, Japan.). Also, TGA-50 Shimadzu, with a heating rate of 10°/min in an N2 environment in the temperature range 293–873 K, was used to address the thermal stability of the PVA/Ag/CaTiO3 nanocomposite. Using a UV–vis-NIR spectrophotometer (Jasco, V-570), we conducted the optical characteristics from 230 to 1100 nm. As electrodes for electrical testing, silver paste is pasted to both parallel edges of samples with dimensions of (1 cm × 1 cm) and a thickness of 0.7 mm. For AC tests in the frequency range of 100 Hz–5 MHz, a programmable automated RLC bridge, model Hioki 3532 Hitester, has been employed. A k-type thermocouple has been used to monitor the sample's temperature.
Results and discussion
Structural analyses
Figure 2 shows XRD Diffraction patterns for pure CaTiO3 (CTO) nanoparticles and Ag/CaTiO3 nanocomposite. The diffraction pattern of pristine CaTiO3 shows peaks that correspond to (101), (111), (121), (112), (022), (221), (202), (141), (311), (123), (242), (161), and (440) diffraction planes of CaTiO3 [ICDD file: 00-042-0423]. These observed peaks correspond to orthorhombic symmetry with a perovskite-like structure14,34. Minor secondary phases were observed in the XRD pattern, which belongs to TiO2, Ca(OH)2, and CaO phases35,36. The average crystallite size of CaTiO3 was estimated using WinFit 1.2.1 (1997) software37, which was approximately 24.5 nm.
Figure 2.
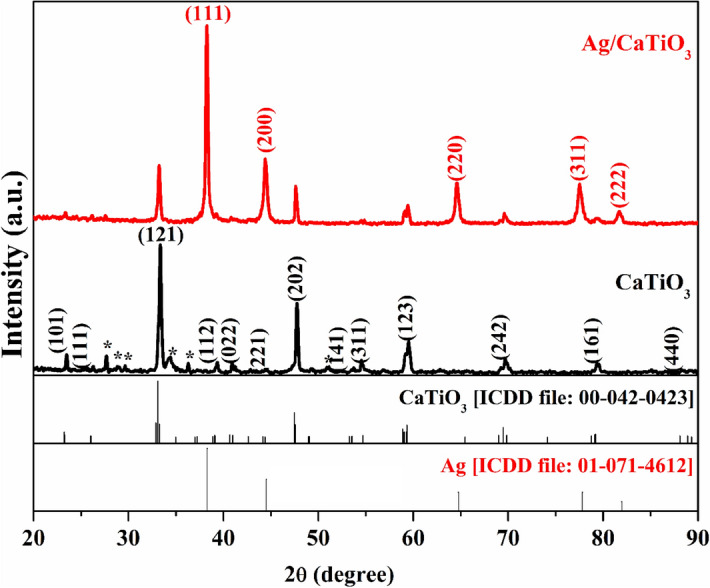
XRD diffraction patterns of CaTiO3 and Ag/CaTiO3 NPs.
The diffraction pattern of Ag/CaTiO3 shows the characteristic diffraction peaks of Ag nanoparticles NPs, which correspond to (111), (200), (220), (311), (222) planes of the cubic structure of Ag [ICDD file: 01-071-4612], indicating that the Ag NPs were successfully loaded on the surface of CaTiO338. The highly intense peaks of Ag NPs are due to the high amount of free silver in the composite39. A slight shift in the diffraction peaks of CaTiO3 toward lower angles was observed; this could be attributed to the internal stress arising from the loading of Ag NPs to the lattice40. The broadening of the CaTiO3 NPs peaks is decreased after Ag NPs loading, which increases the average size of CaTiO3 NPs to 26.9 nm. The sharp diffraction peaks in both patterns of CaTiO3 NPs and Ag/CaTiO3 NPs indicate the high crystalline nature of these samples41.
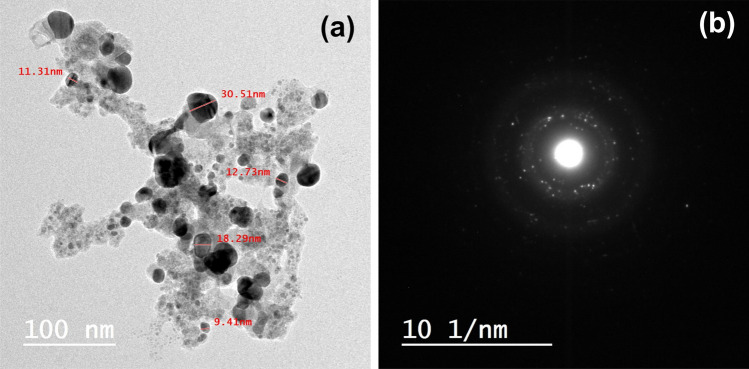
Figure 3a shows a transmission electron microscope (TEM) image of Ag/CaTiO3 NPs. This figure demonstrates that Ag/CaTiO3 NPs are spherical NPs with a particle size between 11 and 30 nm. These results are consistent with the XRD calculations. The selected area electron diffraction (SAED) pattern of Ag/CaTiO3 NPs, Fig. 3b, reveals bright spots at regular positions, which is evidence that the Ag/CaTiO3 NPs have a crystalline structure.
Figure 3.
(a) TEM image and (b) SAED pattern of Ag/CaTiO3 NPs.
Figure 4 shows XRD diffraction patterns of PVA/Ag/CaTiO3 nanocomposite at different temperatures (313, 323, 333, 343, 353, 363, and 373 K). The typical diffraction peak of PVA, which corresponds to the (101) plane, appeared along with the diffraction peaks of Ag/CaTiO3 NPs. It is observed that the intensities of the diffraction peaks of Ag/CaTiO3 NPs are severely decreased after the dispersion of the nanoparticles into the polymer matrix due to the higher content of PVA amorphous polymer, which reduces the crystallinity42. The average crystallite size for the most intense peak of CaTiO3 NPs decreases from 19.8 nm at 313 K to 9.7 nm at 373 K. Furthermore, the diffraction peaks of Ag/CaTiO3 NPs are shifted toward smaller angles after dispersing in the PVA matrix, indicating the intercalated structure owing to the formation of PVA/Ag/CaTiO3 nanocomposite43,44. As the temperature increases from 313 to 373 K, the FWHM of the diffraction peaks increases, and then the average crystallite size decreases from 25 to 14.8 nm for the intense peak of Ag NPs. However, at 353 K, the intensity of the diffraction peaks is increased, and the peaks become narrower; the FWHM decreased to 1.33, 0.36, and 0.31° for the most intense peaks of PVA, CaTiO3, and Ag, respectively, indicating improved crystallinity. This may be attributed to the glass transition temperature of PVA, at which the physical properties of a polymer nanocomposite change45–47.
Figure 4.
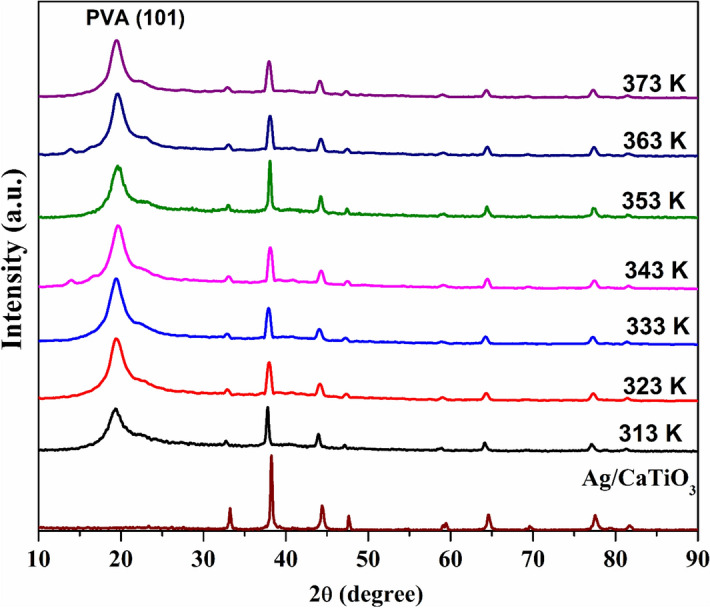
XRD patterns of PVA/Ag/CaTiO3 nanocomposite at different temperatures.
Figure 5 shows FTIR spectra of pure CaTiO3 and Ag/CaTiO3 NPs. The spectra show two strong bands at 3400 cm–1 and 3200 cm−1 that corresponded to vibration stretching in the O–H group that is suitable for the existence of hydroxyl group O–H, and the peak at 1721 cm−1 is attributed to the stretching vibrations of carbonyl (C=O) groups48. The bands at 1615 and 1375 cm−1 arise due to the stretching vibrations of C=C and bending vibrations of the carboxyl (C–OH) group. It’s noticed that the two characteristic peaks at 534 and 434 cm−1 in the spectrum of CaTiO3 NPs are related to the stretching and bending vibrations of Ti–O bonds49.
Figure 5.
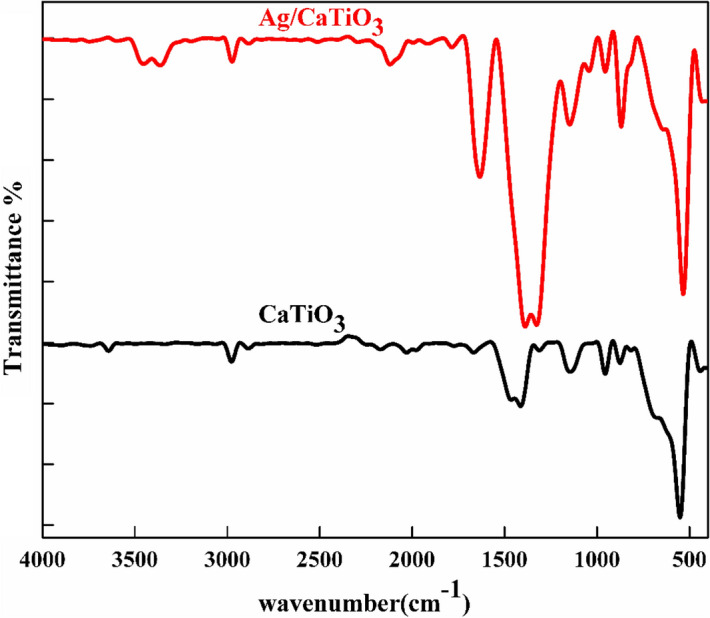
FTIR spectra of pure CaTiO3 and Ag/CaTiO3 NPs.
It can be observed that pure CaTiO3 and Ag/CaTiO3 NPs exhibited essential differences in the intensity of some peaks. Due to the effect of gamma irradiation, the intensities of peaks at 3440 and 1650 cm−1 of Ag/CaTiO3 NPs significantly increased when compared to that of pure CaTiO3 NPs, and there is a shift in some peaks to lower wavenumber in the spectrum of Ag/CaTiO3 NPs which corresponding to bonding interaction of Ag and CaTiO3 NPs which confirms the successful formation of Ag/CaTiO3 NPs50.
Figure 6 shows the FTIR spectra of PVA/Ag/CaTiO3 nanocomposite at different temperatures (313, 323, 333, 343, 353, 363, and 373 K). The typical bands of PVA appeared along the spectra of Ag/CaTiO3. Where the broadening bands of PVA are due to O–H stretching vibration along the backbone of the polymer at 3278 cm−1, the peak at 2922 cm−1 is due to the stretching vibration of the C–H alkyl group, and the peak at 1702 cm−1 corresponds to the stretching of the PVA acetate group’s C=O bond. These bands decreased with increasing temperature and were related to the evaporation of water. The band at 1422 cm−1 is due to CH2 symmetric bending; C–H wagging vibrations could describe the peak at 1308 cm−1. The skeletal vibration of PVA corresponds to the peak at 820 cm−148. It is noticed that the two characteristic peaks at 984 cm−1 and 1679 in the spectrum of PVA correspond to the CH2 asymmetric stretching51. The peaks at 443 and 532 cm−1 in the spectrum correspond to stretching vibrations of Ti–O bonds and Ca–Ti–O bonds of calcium titanate52. On the other hand, With the mixing of Ag/CaTiO3 NPs in the host matrix of PVA, notice the disappearance of the band at 1679 cm−1 and the intensity of the bands at 1702 and 820 cm−1 decreased due to the arrangement of chemical conjugation of Ag/CaTiO3 NPs with PVA molecules. The band at 1308 cm−1 disappeared, showing the decoupling between O–H and C–H vibrations related to the bonding interaction with O–H and Ag NPs.
Figure 6.
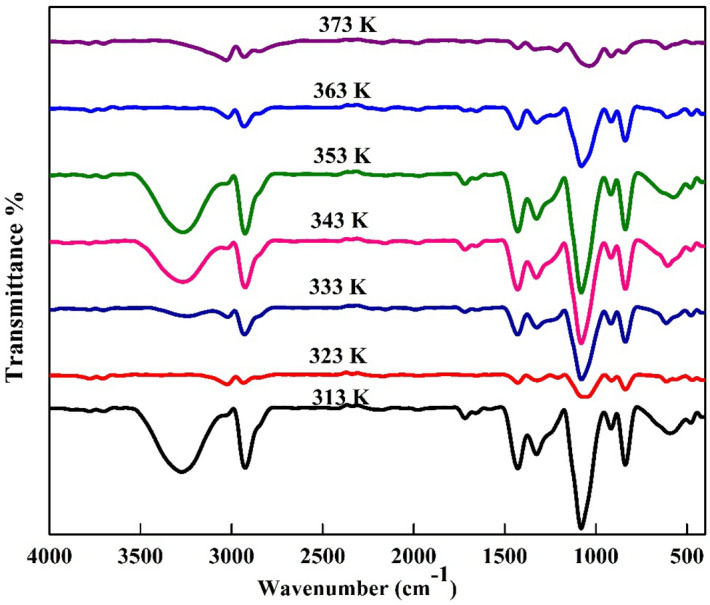
FTIR spectra of PVA/Ag/CaTiO3 nanocomposite with different temperatures (313, 323, 333, 343, 353, 363, and 373 K).
This demonstrates that the nanoparticles interact with the PVA by the Van der Waal force, confirming the formation of PVA/Ag/CaTiO3 nanocomposite53.
It is observed that with increasing the temperature, there is a noticeable change in the intensity of the bands at 3278 cm−1 and 2922 cm−1 for the sample at 353 K. This may be due to the glass transition temperature of pure PVA, which is approximately at 354.5 K45.
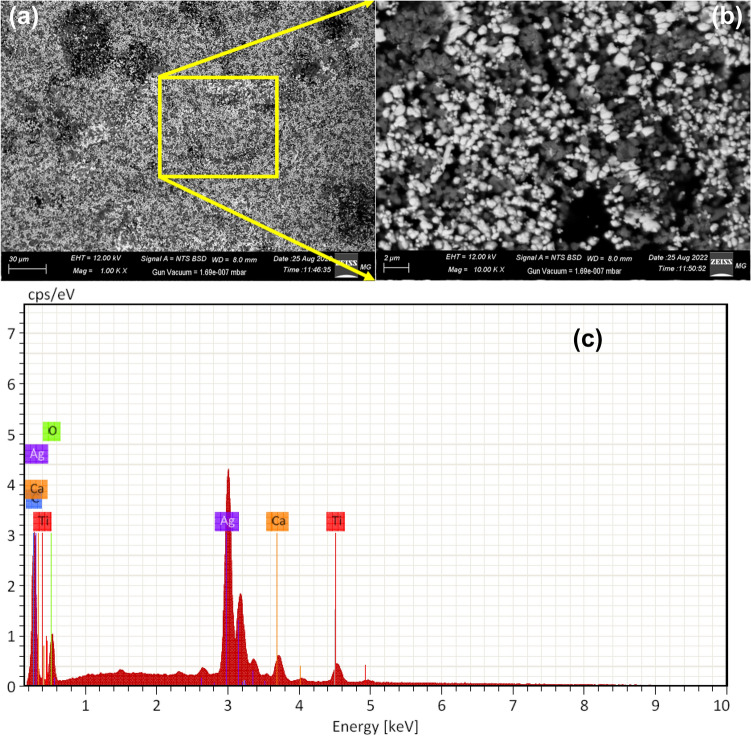
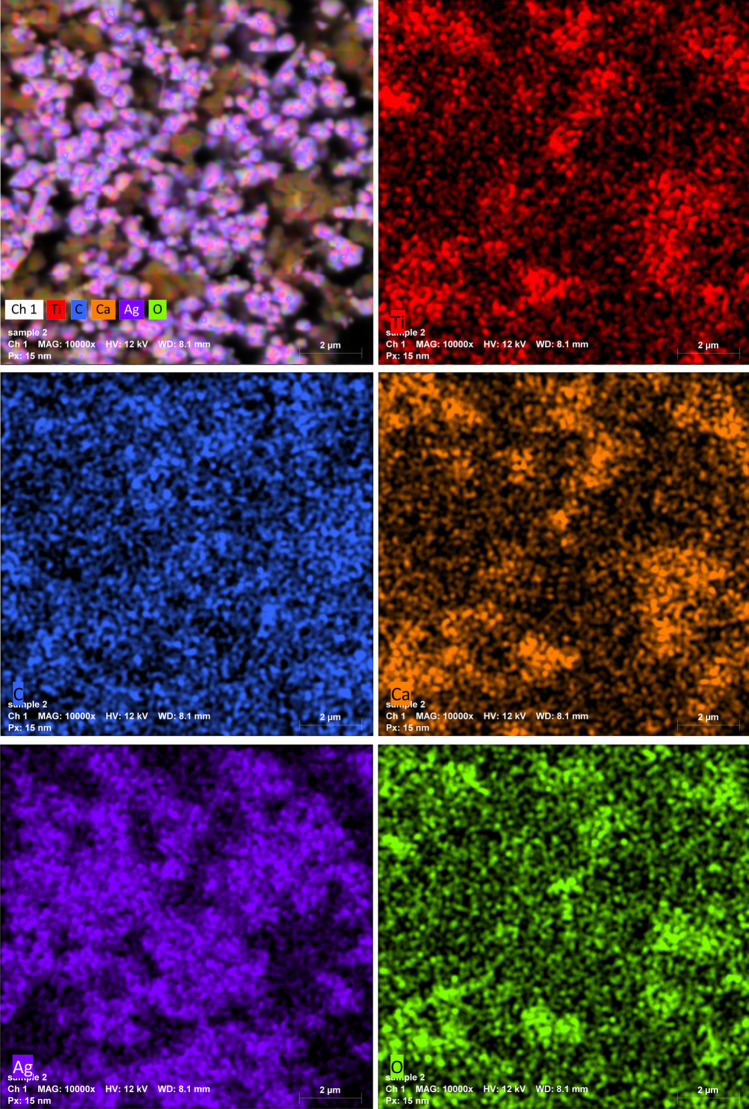
The morphology of the PVA/Ag/CaTiO3 nanocomposite film was assessed using SEM images. The fabricated PVA/Ag/CaTiO3 nanocomposite film consistently distributed Ag/CaTiO3 NPs in the PVA polymer matrices, as seen in the SEM images (Fig. 7a,b). EDX spectra have been employed to validate the elemental composition of the PVA/Ag/CaTiO3 nanocomposite film, as seen in Fig. 7c. The purity of the PVA/Ag/CaTiO3 nanocomposite film is proven by Fig. 7c, which shows only the elemental peaks for C, Ti, Ag, Ca, and O and no other elements peaks. The mapping images (Fig. 8) showed that Ag/CaTiO3 NPs were evenly distributed throughout the PVA matrix.
Figure 7.
(a,b) SEM images and (c) EDX spectra of PVA/Ag/CaTiO3 nanocomposite film.
Figure 8.
Mapping images of PVA/Ag/CaTiO3 nanocomposite film.
Optical properties
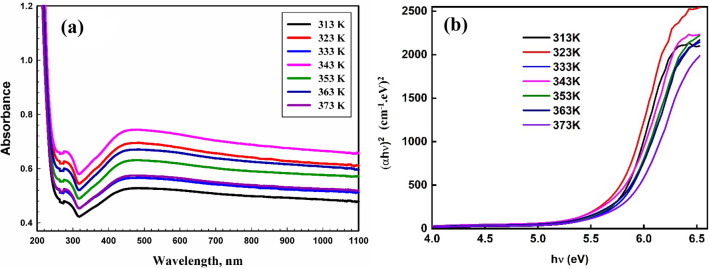
The UV–visible absorbance spectra of the PVA/Ag/CaTiO3 nanocomposite films are shown in Fig. 9a. The absorption band at 288 nm corresponds to the n-π* transition54,55, while the apparent absorption hump at 440 nm is attributable to the surface Plasmon resonance (SPR) of Ag NP, as has been reported in our earlier work56. Moreover, when the temperature rises, the absorption of the polymeric films has influenced significantly. As temperatures rise, a blue shift is seen in the position of the surface Plasmon peak. Hence, the optical bandgap of materials may be expected from absorption studies, which is crucial from the perspective of technological applications. As a result, since the optical characteristics of the PVA/Ag/CaTiO3 nanocomposite may be directly associated with structural and electrical properties, they are critical for applications.
Figure 9.
(a) UV–visible absorbance spectra and (b) (αhν)2 against (hν) of the PVA/Ag/CaTiO3 nanocomposite films.
The absorption coefficient α(λ) is related to the optical band gap Eg via the following relation57,58:
where B signifies band tailing, hν represents photon energy, and the power m specifies the transition.
The energy gap of PVA/Ag/CaTiO3 nanocomposite films in direct transition at various temperatures was evaluated by plotting (αhν)2 against (hν), as can be seen in Fig. 9b. The direct band gap energy Eg of PVA/Ag/CaTiO3 nanocomposite at 313 K is found to be 5.75 eV. As the temperature increases, the direct band gap energy of PVA/Ag/CaTiO3 nanocomposite films increases. By increasing the temperature, the optical band gap was increased to 5.84 eV at 373 K. This increase might be due to temperature changes influencing the electronic structure of the PVA chain. In other words, an increase in Eg values induces lattice defect and enhances the degree of electronic disorder in PVA/Ag/CaTiO3 nanocomposite film, resulting in a loss in the crystallinity of Ag NPs. The exceptional decrease in Eg value at 323 K (5.72 eV) may be due to a change in crystallinity, as shown by XRD measurement59.
Thermogravimetric analysis (TGA)
Thermal stability is essential for using PVA/Ag/CaTiO3 nanocomposite film in high temperatures in optoelectronic devices. The thermal stability of PVA/Ag/CaTiO3 nanocomposite film was tested from 313 to 873 K at a constant rate of 10 K min−1 under a nitrogen atmosphere.
As seen in Fig. 10, the PVA/Ag/CaTiO3 nanocomposite film's thermo-gravimetric analysis (TGA) curve exhibits three significant weight loss areas. The first area, which occurred at a temperature ranging from 343 to 451 K, has been associated with the evaporation of water that had been slightly adsorbed, and the weight loss of the film was around 4.409%. The second area occurs between 540 and 630 K and is caused by the decomposition of the PVA polymeric matrix. At this point, the film has lost around 49.39% of its weight. The reason for the weight loss that occurred during the third stage, which was correlated with 33.38% of the film at its highest temperature of 652–682 K, was that PVA chains split into several tiny fragments. At this point, the overall percentage of losing weight is around 99.1%60. The thermal stability of the PVA/Ag/CaTiO3 nanocomposite is improved by mixing Ag/CaTiO3 into the PVA matrix51,61.
Figure 10.
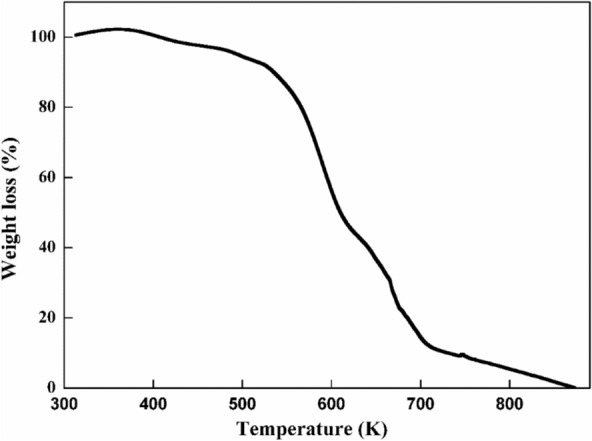
TGA curve of PVA/Ag/CaTiO3 nanocomposite film.
Direct electrical conductivity
The direct electrical conductivity, denoted by the σdc, is independent of the frequency and results from the free charges in the sample. The direct electrical conductivity σdc can be expressed from the relation between the resistance R of the film and its length l and the area A, as follows62:
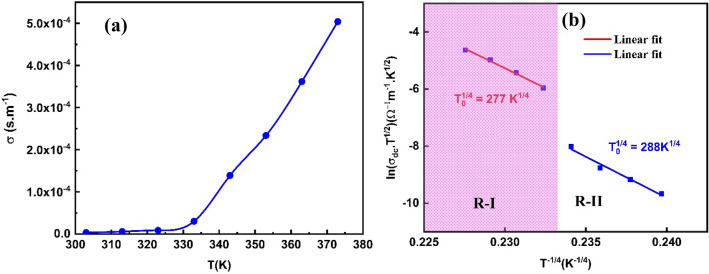
The dc conductivity of PVA/Ag/CaTiO3 nanocomposite film gradually increases with the increase in temperature, as shown in Fig. 11a. When the temperature rises, electrons from the valence band can jump to the conduction band, allowing free mobility between the two bands and improving the material's conductivity. The increased dc conductivity with the temperature reveals that the PVA/Ag/CaTiO3 nanocomposite film exhibits semiconductor characteristics63.
Figure 11.
(a) Relation of σdc Vs. T (b) relation of ln (σdc.T1/2) Vs. (T−1/4) for PVA/Ag/CaTiO3 nanocomposite film.
This work describes the conduction mechanism of σdc for PVA/Ag/CaTiO3 nanocomposite film in terms of a variable range hopping mechanism (VRH). The following connections provide the foundation for this explanation64:
where T0 is the Mott temperature.
The VRH model's validity was tested for PVA/Ag/CaTiO3 nanocomposite film by plotting ln (σdcT1/2) vs. T−1/4 as shown in Fig. 11b. The slope of the VRH curve was used in the calculation to get the value of T0. As a result of our findings, we have concluded that the transport model (VRH) may be the primary low-temperature transport mechanism. The obtained value of T0 is 5.88 × 10⁹ K and 6.87 × 10⁹ K for PVA/Ag/CaTiO3 nanocomposite film in the temperature regions R-I and R-II, respectively.
Dielectric measurements
One of the essential features of composite films is dielectric permittivity, which represents the material's propensity to polarize. It physically represents the more remarkable polarization generated in a material by an external field of specific strength. The complex permittivity describes and gives the dielectric characteristics65:
where ε0, εr, and εi are the free space, real and imaginary parts of permittivity of complex dielectric constant.
It is generally known that εr indicates the amount of electric energy stored in the material due to the applied alternating electric field. In addition, εr depicts the strength of the dipole arrangement concerning the direction of the electric field66. Figure 12 depicts the dependency of the dielectric constant (εr) on the temperature for PVA/Ag/CaTiO3 nanocomposite film at different frequencies (1.0 kHz to 1.0 MHz). This figure demonstrates that the εr for PVA/Ag/CaTiO3 nanocomposite film rises with temperature and is decreased with frequencies. We interpret this behavior in the following manner: as the temperature of PVA/Ag/CaTiO3 nanocomposite film rises, the possibility of producing more charge carriers with high mobility (holes and ions) likewise rises67. Compared to the low temperature, the electric dipoles may efficiently align spontaneously. One possible explanation for the lower values of εr seen at high frequencies is that the charges at the interfaces are unable to realign their direction in response to the intense alternating electric field. In addition, while performing at low frequencies, the interface charges have been given the necessary time to realign themselves and participate in the εr63.
Figure 12.
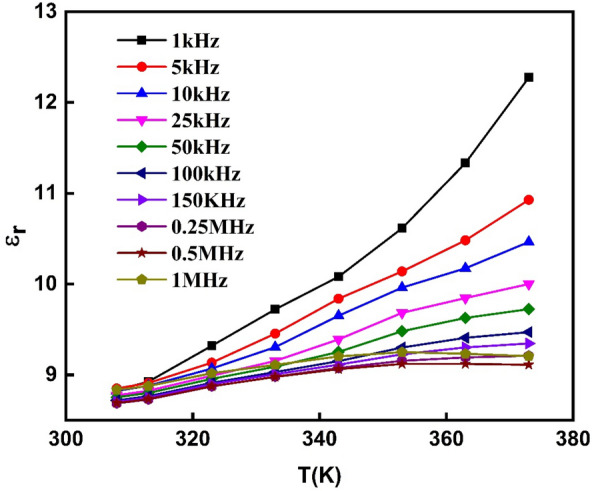
Real part of the dielectric constant (εr) as a function of temperature for a range of frequencies for PVA/Ag/CaTiO3 nanocomposite film.
Similarly, data on the dissipated energy in the PVA/Ag/CaTiO3 nanocomposite film can be derived by graphing the imaginary component of the dielectric constant εi against temperature at various frequencies (1 kHz to 1.0 MHz), as illustrated in Fig. 13. It demonstrates that εi is independent of temperature but is inversely proportional to frequency, decreasing as the frequency increases. In summary, at these temperatures (313–373 K), the PVA/Ag/CaTiO3 nanocomposite film interface charges have appropriate mobility and contribute significantly to the dissipated energy. Regarding frequency dependency, the interface charges may rearrange themselves at low frequencies but cannot at high frequencies63,67.
Figure 13.
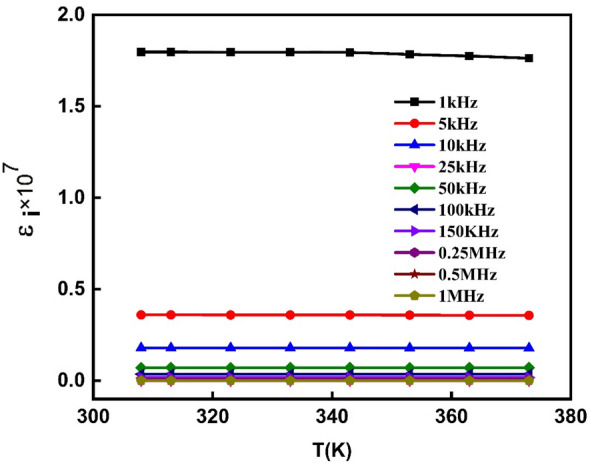
Imaginary dielectric constant (εi) as a function of temperature for a range of frequencies for PVA/Ag/CaTiO3 nanocomposite film.
AC-conductivity and conduction mechanism
The AC conductivity σac provided through various mechanisms comprises inherent charge carriers, lattice energy, defects, and impurities. The AC conductivity σac measurements are performed to completely comprehend the conduction behavior of the parameters that may influence this mechanism of the samples. It is then considered to assess it for suitable applications66–68.
Furthermore, if the σac of semiconductors refuses to obey the Arrhenius universal equation, it may be expressed as follows69,70:
where Eac is the activation energy.
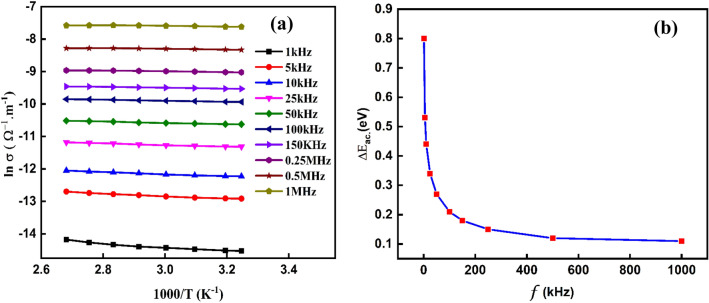
The relationship between ln σac and 1000/T for PVA/Ag/CaTiO3 nanocomposite film is shown in Fig. 14a67. For a given temperature, the conductivity is constant and independent of frequency in the low-frequency zone. Furthermore, Ag/CaTiO3 perovskite materials contain well-conductive grains surrounded by less conductive grain borders, and their activity is greater at lower frequencies. This effect leads to poor conductivity because of a modest electron jump in this location. When the frequency rises, the conductivity increases significantly. This is due to more charge carriers and more processes in the material for jumping charge carriers between consecutive sites. The phenomena then show dispersive behavior, yielding AC conduction conductivity σac71,72. The enhancement in conductivity with increasing temperature reveals that the conduction mechanism in the PVA/Ag/CaTiO3 nanocomposite film has been thermally activated. For PVA/Ag/CaTiO3 nanocomposite film, the activation energy reduces as the temperature increases. The activation energy Eac of PVA/Ag/CaTiO3 nanocomposite film has been computed from the slope of linear parts for specified frequencies and is observed to be in the range 0.11–0.8 eV (see Fig. 14b).
Figure 14.
(a)The relationship between ln and 1000/T and (b) the activation energy Eac Vs. the frequency for the PVA/Ag/CaTiO3 nanocomposite film.
In addition, the value of the alternating current conductivity σac of the PVA/Ag/CaTiO3 nanocomposite film could potentially be described as a function of the angular frequency ω73,74:
where B would be a constant related to a given temperature and S is the frequency exponent that denotes the degree of interaction between mobile ions and lattices in the PVA/Ag/CaTiO3 nanocomposite film75.
The relationship between log and log ω for PVA/Ag/CaTiO3 nanocomposite film is seen in Fig. 15. The conductivity of PVA/Ag/CaTiO3 nanocomposite film rises sharply with frequency. Furthermore, for most semiconductors, this change will occur at a certain frequency known as the hopping frequency, which improves with increasing temperature. Our PVA/Ag/CaTiO3 nanocomposite film's high conductivity values suggest they could be utilized in electronic applications such as optoelectronics, electronic chips, and gas sensors.
Figure 15.
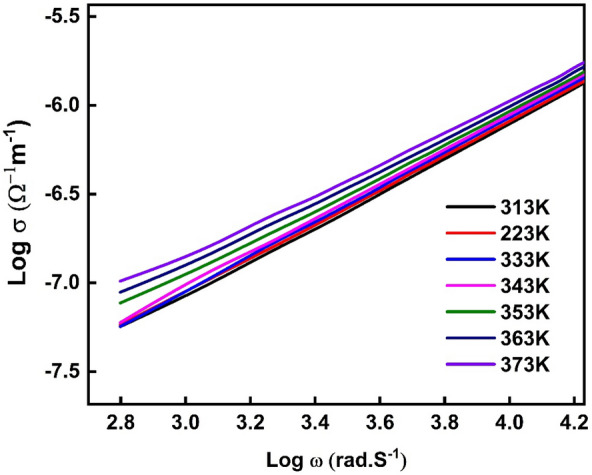
The relationship between log and log ω for PVA/Ag/CaTiO3 nanocomposite film.
The slopes of the straight lines in Fig. 16 at high frequencies are utilized to derive the exponent S. Figure 16 depicts the dependency of the frequency exponent, S, of PVA/Ag/CaTiO3 nanocomposite film on temperature. The parameter S is essential in defining the conduction mechanism in PVA/Ag/CaTiO3 nanocomposite film. According to Funke et al.64, if S is less than 1, the charge carriers suffer a transport displacement with a sudden hopping, and if S is more than 1, the species gets a located jump. In our study, PVA/Ag/CaTiO3 nanocomposite film has S less than 1, resulting in a transport displacement with a sudden hopping for the charge carriers. As the temperature of a PVA/Ag/CaTiO3 nanocomposite film rises, the exponent S decreases dramatically67. There is a suggestion that this behavior might be explained by the correlated barrier hopping (CBH) model. In the CBH model, the electrons react to the forces produced by an applied electrical field through jumping the potential barrier on their path from one hopping site to another. This takes place as a direct result of the electrons' potential to hop across the barrier76. According to the CBH model, the frequency exponent, S, can be expressed as77:
where kB denotes Boltzmann’s constant and Wm is the height of the maximum barrier (the amount of energy required to get an electron out of its ground state towards its excited state). The height of the maximum barrier Wm value was found of 0.29 eV.
Figure 16.
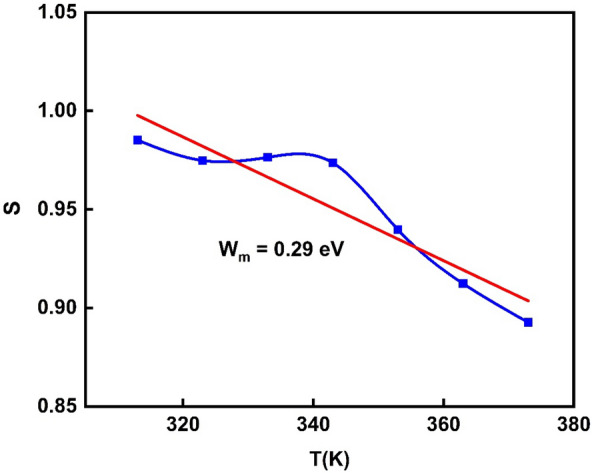
The dependency of frequency exponent, S, for PVA/Ag/CaTiO3 nanocomposite film on temperature.
The dielectric modulus
Studying electric modulus formalism is a practical approach to exploring the electrical transport mechanism and learning more about the relaxation process.
The complex modulus for PVA/Ag/CaTiO3 nanocomposite film can be represented using an equation78.
in which Mr and Mi denoted the complex modulus's real and imaginary components.
Figure 17 depicts the cole–cole plots (Mi Vs. Mr) for PVA/Ag/CaTiO3 nanocomposite film at various temperatures. For all temperatures, PVA/Ag/CaTiO3 nanocomposite film exhibits a semicircular arc originating from the material's grain boundary contributions, first on the low-frequency side and then on the higher-frequency side. Furthermore, each semicircular arc nearly overlaps the next with slight fluctuation for all temperatures, demonstrating an electrical relaxation development in the PVA/Ag/CaTiO3 nanocomposite film78,79.
Figure 17.
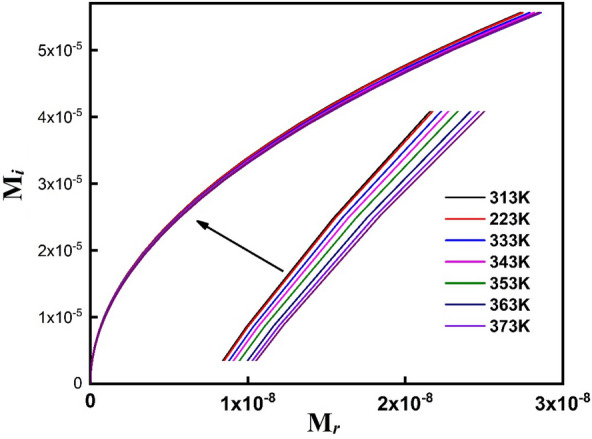
Cole–cole plots (Mi Vs Mr) of PVA/Ag/CaTiO3 nanocomposite film.
Mohamed Bakr Mohamed and M.H. Abdel-Kader80 have reported that the crystallite size of ZnS increased from 4 to 10 nm as the annealing temperature rose from 300 to 500 °C. The extinction coefficient of PVA/ZnS nanocomposite improves by adding ZnS NPs at 300 °C and then reducing as the annealing temperature rises. The index of refraction increases for PVA/ZnS annealed at 300 °C and then declined as more annealed nano additives are added. Also, the direct energy gap values increase from 3.3 to 4.9 eV at 500 °C, and the indirect band gap increases from 2.3 to 4.7 eV for PVA/ZnS annealed at 500 °C.
Also, According to Sathish et al.81, the optical transmittance of PVA/Al2O3 thin film was approximately 80% for the as-grown film, while it boosted with annealing temperature and the band gap energy (3.74–3.78 eV) reduced with annealing temperature. The dielectric constant values ranged between 8 and 16. The obtained values for the dielectric constant are greater than those of pure PVA. The values for dielectric loss have been determined to be between 0.1 and 0.6.
Conclusion
Herein, gamma radiation-induced synthesis of Ag/CaTiO3 NPs and then dispersed in a PVA matrix. The temperature-dependent structural, optical, DC electrical conductivity, and dielectric characteristics of PVA/Ag/CaTiO3 nanocomposite film were studied. As the temperature increased, the average crystallite sizes of CaTiO3 and Ag NPs decreased from 19.8 to 9.7 nm and 25 nm to 14.8, respectively. The optical band gap increased from 5.75 to 5.84 eV at 373 K. Moreover, the increase of the dc conductivity with the temperature shows that the PVA/Ag/CaTiO3 nanocomposite film exhibits a semiconductor behavior. The frequency exponent, S, of PVA/Ag/CaTiO3 nanocomposite film, gradually decreases as the temperature increases and is less than 1. Further, the maximum barrier Wm value is around 0.29 eV. This unique optical, DC electrical conductivity and dielectric properties of PVA/Ag/CaTiO3 nanocomposite film reveal that it can be used for flexible electronic devices.
Author contributions
M.I.A.A.M., S.A., E.K.T., A.S.A.: conceptualization; methodology; data curation; investigation; writing—original draft; writing—review and editing.
Funding
Open access funding provided by The Science, Technology & Innovation Funding Authority (STDF) in cooperation with The Egyptian Knowledge Bank (EKB).
Data availability
All data generated or analysed during this study are included in this published article.
Competing interests
The authors declare no competing interests.
Footnotes
Publisher's note
Springer Nature remains neutral with regard to jurisdictional claims in published maps and institutional affiliations.
References
- 1.Kausar, A. & Taherian, R. Electrical conductivity behavior of polymer nanocomposite with carbon nanofillers. Electr. Conduct. Polym-Based Compos. Exp. Model. Appl. Plast. Des. Lib. 41–72 (2018).
- 2.Somesh T, et al. Polymer nanocomposites comprising PVA matrix and AgGaO2 nanofillers: Probing the effect of intercalation on optical and dielectric response for optoelectronic applications. Ind. J. Sci. Technol. 2021;31:2579–2589. doi: 10.17485/IJST/v14i31.1614. [DOI] [Google Scholar]
- 3.Maajid SA, Safiulla M. Investigation of electrical and thermal property of poly(vinyl alcohol)–calcium titanate nanocomposites. J. Mater. Sci. Mater. Electron. 2018;30(3):2292–2298. doi: 10.1007/s10854-018-0500-4. [DOI] [Google Scholar]
- 4.Somesh TE, et al. Polymer nanocomposites comprising PVA matrix and AgGaO2 nanofillers: Probing the effect of intercalation on optical and dielectric response for optoelectronic applications. Indian J. Sci. Technol. 2021;14(31):2579–2589. doi: 10.17485/IJST/v14i31.1614. [DOI] [Google Scholar]
- 5.Meera K, Ramesan MT. Performance of boehmite nanoparticles reinforced carboxymethyl chitosan/polyvinyl alcohol blend nanocomposites tailored through green synthesis. J. Polym. Environ. 2023;31(2):447–460. doi: 10.1007/s10924-022-02649-1. [DOI] [Google Scholar]
- 6.Ramesan MT, et al. Nano zinc ferrite filler incorporated polyindole/poly(vinyl alcohol) blend: Preparation, characterization, and investigation of electrical properties. Adv. Polym. Technol. 2018;37(8):3639–3649. doi: 10.1002/adv.22148. [DOI] [Google Scholar]
- 7.Ramesan MT. In situ synthesis, characterization and conductivity of copper sulphide/polypyrrole/polyvinyl alcohol blend nanocomposite. Polym.-Plast. Technol. Eng. 2012;51(12):1223–1229. doi: 10.1080/03602559.2012.696766. [DOI] [Google Scholar]
- 8.Ramesan MT, et al. Influence of copper sulphide nanoparticles on the structural, mechanical and dielectric properties of poly(vinyl alcohol)/poly(vinyl pyrrolidone) blend nanocomposites. J. Mater. Sci. Mater. Electron. 2018;29(3):1992–2000. doi: 10.1007/s10854-017-8110-0. [DOI] [Google Scholar]
- 9.Passi M, Pal B. Influence of Ag/Cu photodeposition on CaTiO3 photocatalytic activity for degradation of Rhodamine B dye. Korean J. Chem. Eng. 2022;39(4):942–953. doi: 10.1007/s11814-021-0975-1. [DOI] [Google Scholar]
- 10.Hui-Ping L, Yi-Feng D, Lin Y. Anomalous optical and electronic properties of CaTiO3 perovskites. Commun. Theor. Phys. 2007;48(3):563. doi: 10.1088/0253-6102/48/3/033. [DOI] [Google Scholar]
- 11.Shi X, et al. Synthesis of vertically aligned CaTiO3 nanotubes with simple hydrothermal method and its photoelectrochemical property. Nanotechnology. 2018;29(38):385605. doi: 10.1088/1361-6528/aacfde. [DOI] [PubMed] [Google Scholar]
- 12.Yan Y, et al. Enhanced photocatalytic performance and mechanism of Au@CaTiO3 composites with Au nanoparticles assembled on CaTiO3 nanocuboids. Micromachines. 2019;10(4):254. doi: 10.3390/mi10040254. [DOI] [PMC free article] [PubMed] [Google Scholar]
- 13.Křenek T, et al. Nano and micro-forms of calcium titanate: Synthesis, properties and application. Open Ceramics. 2021;8:100177. doi: 10.1016/j.oceram.2021.100177. [DOI] [Google Scholar]
- 14.Lalan V, Mahadevan Pillai VP, Gopchandran KG. Enhanced electron transfer due to rGO makes Ag–CaTiO3@rGO a promising plasmonic photocatalyst. J. Sci. Adv. Mater. Devices. 2022;7(3):100468. doi: 10.1016/j.jsamd.2022.100468. [DOI] [Google Scholar]
- 15.AbdulKareem SK, Ajeel SA. Effect of annealing temperatures on the structural and crystalline properties of CaTiO3 powder synthesized via conventional solid-state method. Mater. Today Proc. 2021;42:2674–2679. doi: 10.1016/j.matpr.2020.12.647. [DOI] [Google Scholar]
- 16.Patil B, Srinivasa R, Dharwadkar S. Synthesis of CaTiO3 from calcium titanyl oxalate hexahydrate (CTO) as precursor employing microwave heating technique. Bull. Mater. Sci. 2007;30:225–229. doi: 10.1007/s12034-007-0040-7. [DOI] [Google Scholar]
- 17.Mallik, P. K. et al. Characterisation of sol-gel synthesis of phase pure CaTiO3 nano powders after drying. In IOP Conference Series: Materials Science and Engineering. (IOP Publishig, 2015).
- 18.Chen T, et al. Hydrothermal synthesis of perovskite CaTiO3 tetragonal microrods with vertical V-type holes along the [010] direction. CrystEngComm. 2019;21(32):4763–4770. doi: 10.1039/C9CE00726A. [DOI] [Google Scholar]
- 19.Passi M, Pal B. A review on CaTiO3 photocatalyst: Activity enhancement methods and photocatalytic applications. Powder Technol. 2021;388:274–304. doi: 10.1016/j.powtec.2021.04.056. [DOI] [Google Scholar]
- 20.Čubová K, Čuba V. Synthesis of inorganic nanoparticles by ionizing radiation—A review. Radiat. Phys. Chem. 2020;169:108774. doi: 10.1016/j.radphyschem.2020.108774. [DOI] [Google Scholar]
- 21.Flores-Rojas GG, López-Saucedo F, Bucio E. Gamma-irradiation applied in the synthesis of metallic and organic nanoparticles: A short review. Radiat. Phys. Chem. 2020;169:107962. doi: 10.1016/j.radphyschem.2018.08.011. [DOI] [Google Scholar]
- 22.Chen P, et al. Synthesis of silver nanoparticles by γ-ray irradiation in acetic water solution containing chitosan. Radiat. Phys. Chem. 2007;76(7):1165–1168. doi: 10.1016/j.radphyschem.2006.11.012. [DOI] [Google Scholar]
- 23.Wiguna, P. et al.Physicochemical properties of colloidal Ag/PVA nanoparticles synthesized by gamma irradiation. In Journal of Physics: Conference Series (IOP Publishing, 2020).
- 24.AbdelMaksoud MIA, et al. Gamma irradiation-assisted synthesis of PANi/Ag/MoS2/LiCo0.5Fe2O4 nanocomposite: Efficiency evaluation of photocatalytic bisphenol A degradation and microbial decontamination from wastewater. Opt. Mater. 2021;119:111396. doi: 10.1016/j.optmat.2021.111396. [DOI] [Google Scholar]
- 25.Abdel Maksoud MIA, Elsaid MAM, Abd Elkodous M. Gamma radiation induced synthesis of Ag decorated NiMn2O4 nanoplates with enhanced electrochemical performance for asymmetric supercapacitor. J. Energy Storage. 2022;56:105938. doi: 10.1016/j.est.2022.105938. [DOI] [Google Scholar]
- 26.Abdel Maksoud MIA, et al. Gamma radiation-induced synthesis of a novel chitosan/silver/Mn-Mg ferrite nanocomposite and its impact on cadmium accumulation and translocation in brassica plant growth. Int. J. Biol. Macromol. 2022;194:306–316. doi: 10.1016/j.ijbiomac.2021.11.197. [DOI] [PubMed] [Google Scholar]
- 27.Abdel Maksoud MIA, et al. Gamma-rays induced synthesis of Ag-decorated ZnCo2O4–MoS2 heterostructure as novel photocatalyst and effective antimicrobial agent for wastewater treatment application. J. Inorganic Organomet. Polym. Mater. 2022;32(9):3621–3639. doi: 10.1007/s10904-022-02387-w. [DOI] [Google Scholar]
- 28.Maksoud MA, et al. Gamma irradiation-assisted synthesis of PANi/Ag/MoS2/LiCo0.5Fe2O4 nanocomposite: Efficiency evaluation of photocatalytic bisphenol A degradation and microbial decontamination from wastewater. Opt. Mater. 2021;119:111396. doi: 10.1016/j.optmat.2021.111396. [DOI] [Google Scholar]
- 29.Ghobashy MM, et al. Radiation induced in-situ cationic polymerization of polystyrene organogel for selective absorption of cholorophenols from petrochemical wastewater. J. Environ. Manag. 2018;210:307–315. doi: 10.1016/j.jenvman.2018.01.018. [DOI] [PubMed] [Google Scholar]
- 30.Bekhit M, et al. Radiation-induced synthesis of copper sulfide nanotubes with improved catalytic and antibacterial activities. Environ. Sci. Pollut. Res. 2021;28(32):44467–44478. doi: 10.1007/s11356-021-13482-9. [DOI] [PubMed] [Google Scholar]
- 31.Younis SA, Ghobashy MM, Samy M. Development of aminated poly (glycidyl methacrylate) nanosorbent by green gamma radiation for phenol and malathion contaminated wastewater treatment. J. Environ. Chem. Eng. 2017;5(3):2325–2336. doi: 10.1016/j.jece.2017.04.024. [DOI] [Google Scholar]
- 32.Sokary R, et al. A potential antibiofilm, antimicrobial and anticancer activities of chitosan capped gold nanoparticles prepared by γ-irradiation. Mater. Technol. 2021;37(7):493–502. doi: 10.1080/10667857.2020.1863555. [DOI] [Google Scholar]
- 33.Bekhit M, et al. Radiation-induced synthesis of copper sulfide nanotubes with improved catalytic and antibacterial activities. Environ. Sci. Pollut. Res. 2021;28:44467–44478. doi: 10.1007/s11356-021-13482-9. [DOI] [PubMed] [Google Scholar]
- 34.Lee SW, Lozano-Sanchez LM, Rodriguez-Gonzalez V. Green tide deactivation with layered-structure cuboids of Ag/CaTiO3 under UV light. J. Hazard Mater. 2013;263(Pt 1):20–27. doi: 10.1016/j.jhazmat.2013.08.017. [DOI] [PubMed] [Google Scholar]
- 35.Maddu A, Permatasari L, Arif A. Structural and dielectric properties of CaTiO3 synthesized utilizing Duck’s eggshell as a calcium source. J. Ceram. Process. Res. 2017;18(2):146–150. [Google Scholar]
- 36.Zdorovets MV, et al. Synthesis, properties and photocatalytic activity of CaTiO3-based ceramics doped with lanthanum. Nanomaterials. 2022;12(13):2241. doi: 10.3390/nano12132241. [DOI] [PMC free article] [PubMed] [Google Scholar]
- 37.Krumm, S. An interactive Windows program for profile fitting and size/strain analysis. In Materials Science Forum (Trans Tech Publ, 1996).
- 38.Dou P, et al. One-step microwave-assisted synthesis of Ag/ZnO/graphene nanocomposites with enhanced photocatalytic activity. J. Photochem. Photobiol. A. 2015;302:17–22. doi: 10.1016/j.jphotochem.2014.12.012. [DOI] [Google Scholar]
- 39.Kottappara R, Palantavida S, Vijayan BK. A facile synthesis of Cu–CuO–Ag nanocomposite and their hydrogenation reduction of p-nitrophenol. SN Appl. Sci. 2020;2(9):1–12. doi: 10.1007/s42452-020-03386-7. [DOI] [Google Scholar]
- 40.Gayathri, S. et al.Investigation of physicochemical properties of Ag doped ZnO nanoparticles prepared by chemical route. (2015).
- 41.Ahmad K, Kumar P, Mobin SM. Hydrothermally grown novel pyramids of the CaTiO3 perovskite as an efficient electrode modifier for sensing applications. Mater. Adv. 2020;1(6):2003–2009. doi: 10.1039/D0MA00303D. [DOI] [Google Scholar]
- 42.Kumar S, et al. Bio-based (chitosan/PVA/ZnO) nanocomposites film: Thermally stable and photoluminescence material for removal of organic dye. Carbohydr. Polym. 2019;205:559–564. doi: 10.1016/j.carbpol.2018.10.108. [DOI] [PubMed] [Google Scholar]
- 43.Prashanth K, et al. Solution combustion synthesis of Cr2O3 nanoparticles and derived PVA/Cr2O3 nanocomposites-positron annihilation spectroscopic study. Mater. Today Proc. 2016;3(10):3646–3651. doi: 10.1016/j.matpr.2016.11.008. [DOI] [Google Scholar]
- 44.Ray SS, Bousmina M. Biodegradable polymers and their layered silicate nanocomposites: In greening the 21st century materials world. Prog. Mater Sci. 2005;50(8):962–1079. doi: 10.1016/j.pmatsci.2005.05.002. [DOI] [Google Scholar]
- 45.Dong C, et al. Insight into glass transition temperature and mechanical properties of PVA/TRIS functionalized graphene oxide composites by molecular dynamics simulation. Mater. Des. 2021;206:109770. doi: 10.1016/j.matdes.2021.109770. [DOI] [Google Scholar]
- 46.Singh, M. K. & Singh, A. Thermal characterization of materials using differential scanning calorimeter. J. Charact. Polym. Fibres 201–222 (2022).
- 47.Domínguez J. Thermosets. Elsevier; 2018. Rheology and curing process of thermosets; pp. 115–146. [Google Scholar]
- 48.Shikinaka K, et al. Tuneable shape-memory properties of composites based on nanoparticulated plant biomass, lignin, and poly (ethylene carbonate) Soft Matter. 2018;14(45):9227–9231. doi: 10.1039/C8SM01683F. [DOI] [PubMed] [Google Scholar]
- 49.Sasidharan S, et al. Perovskite titanates at the nanoscale: Tunable luminescence by energy transfer and enhanced emission with Li+ co-doping. J. Solid State Chem. 2020;288:121449. doi: 10.1016/j.jssc.2020.121449. [DOI] [Google Scholar]
- 50.Chahal RP, et al. γ-Irradiated PVA/Ag nanocomposite films: Materials for optical applications. J. Alloy. Compd. 2012;538:212–219. doi: 10.1016/j.jallcom.2012.05.085. [DOI] [Google Scholar]
- 51.Xiong Y, et al. Performance of organic–inorganic hybrid anion-exchange membranes for alkaline direct methanol fuel cells. J. Power Sources. 2009;186(2):328–333. doi: 10.1016/j.jpowsour.2008.10.070. [DOI] [Google Scholar]
- 52.Liu J, et al. Synthesis of MoS2/SrTiO3 composite materials for enhanced photocatalytic activity under UV irradiation. J. Mater. Chem. A. 2015;3(2):706–712. doi: 10.1039/C4TA04984E. [DOI] [Google Scholar]
- 53.Kashyap S, Pratihar SK, Behera SK. Strong and ductile graphene oxide reinforced PVA nanocomposites. J. Alloy. Compd. 2016;684:254–260. doi: 10.1016/j.jallcom.2016.05.162. [DOI] [Google Scholar]
- 54.Aziz SB, et al. Structural and optical characteristics of PVA:C-dot composites: Tuning the absorption of ultra violet (UV) region. Nanomaterials. 2019 doi: 10.3390/nano9020216. [DOI] [PMC free article] [PubMed] [Google Scholar]
- 55.Zidan HM, et al. Characterization and some physical studies of PVA/PVP filled with MWCNTs. J. Market. Res. 2019;8(1):904–913. [Google Scholar]
- 56.Abdel Maksoud MIA, et al. Effect of gamma irradiation on the free-standing polyvinyl alcohol/chitosan/Ag nanocomposite films: Insights on the structure, optical, and dispersion properties. Appl. Phys. A. 2021;127(8):619. doi: 10.1007/s00339-021-04776-3. [DOI] [Google Scholar]
- 57.Sallam OI, et al. Enhanced linear and nonlinear optical properties of erbium/ytterbium lead phosphate glass by gamma irradiation for optoelectronics applications. Appl. Phys. A. 2022;128(9):819. doi: 10.1007/s00339-022-05965-4. [DOI] [Google Scholar]
- 58.Abou Hussein EM, et al. Unveiling the gamma irradiation effects on linear and nonlinear optical properties of CeO2–Na2O–SrO–B2O3 glass. Opt. Mater. 2021;114:111007. doi: 10.1016/j.optmat.2021.111007. [DOI] [Google Scholar]
- 59.El Askary A, et al. Optical, thermal, and electrical conductivity strength of ternary CMC/PVA/Er2O3 NPs nanocomposite fabricated via pulsed laser ablation. Phys. B. 2022;637:413910. doi: 10.1016/j.physb.2022.413910. [DOI] [Google Scholar]
- 60.Yang C-C. Synthesis and characterization of the cross-linked PVA/TiO2 composite polymer membrane for alkaline DMFC. J. Membr. Sci. 2007;288(1–2):51–60. doi: 10.1016/j.memsci.2006.10.048. [DOI] [Google Scholar]
- 61.Heydari M, et al. Effect of cross-linking time on the thermal and mechanical properties and pervaporation performance of poly (vinyl alcohol) membrane cross-linked with fumaric acid used for dehydration of isopropanol. J. Appl. Polym. Sci. 2013;128(3):1640–1651. [Google Scholar]
- 62.Webster JG. Electrical Measurement, Signal Processing, and Displays. CRC Press; 2003. [Google Scholar]
- 63.El-ghandour A, et al. Temperature and frequency dependence outline of DC electrical conductivity, dielectric constants, and AC electrical conductivity in nanostructured TlInS2 thin films. Physica E. 2019;105:13–18. doi: 10.1016/j.physe.2018.08.024. [DOI] [Google Scholar]
- 64.Elliott SR. A.C. conduction in amorphous chalcogenide and pnictide semiconductors. Adv. Phys. 1987;36(2):135–217. doi: 10.1080/00018738700101971. [DOI] [Google Scholar]
- 65.Morad I, et al. Effect of the biphase TiO2 nanoparticles on the dielectric and polaronic transport properties of PVA nanocomposite: Structure analysis and conduction mechanism. Vacuum. 2020;181:109735. doi: 10.1016/j.vacuum.2020.109735. [DOI] [Google Scholar]
- 66.Sankarappa T, et al. AC conductivity and dielectric studies in V2O5–TeO2 and V2O5–CoO–TeO2 glasses. J. Mol. Struct. 2008;889(1):308–315. doi: 10.1016/j.molstruc.2008.02.009. [DOI] [Google Scholar]
- 67.El-Nahass MM, et al. Structural investigation, thermal analysis and AC conduction mechanism of thermally evaporated alizarin red S thin films. Optik. 2018;170:304–313. doi: 10.1016/j.ijleo.2018.05.130. [DOI] [Google Scholar]
- 68.El-Menyawy EM, Zeyada HM, El-Nahass MM. AC conductivity and dielectric properties of 2-(2,3-dihydro-1,5-dimethyl-3-oxo-2-phenyl-1H-pyrazol-4-ylimino)-2-(4-nitrophenyl)acetonitrile thin films. Solid State Sci. 2010;12(12):2182–2187. doi: 10.1016/j.solidstatesciences.2010.10.001. [DOI] [Google Scholar]
- 69.Macedo, P. B. & Moynihan, C. T. The Role of Ionic Diffusion in Polarisation in Vitreous Ionic Conductors (1972).
- 70.Day DR, et al. The role of boundary layer capacitance at blocking electrodes in the interpretation of dielectric cure data in adhesives. J. Adhes. 1985;18(1):73–90. doi: 10.1080/00218468508074937. [DOI] [Google Scholar]
- 71.Gharbi S, et al. Influence of calcium substitution on structural, morphological and electrical conductivity properties of La1-xCaxNi0.5Ti0.5O3 (x = 0.0, x = 0.2) compounds for energy storage devices. Inorg. Chem. Commun. 2022;144:109925. doi: 10.1016/j.inoche.2022.109925. [DOI] [Google Scholar]
- 72.Sharma J, et al. Study of dielectric properties of nanocrystalline cobalt ferrite upto microwave frequencies. Macromol. Symp. 2015;357(1):38–42. doi: 10.1002/masy.201400183. [DOI] [Google Scholar]
- 73.El-Ghamaz NA, et al. Conducting polymers. VI. Effect of doping with iodine on the dielectrical and electrical conduction properties of polyacrylonitrile. Solid State Sci. 2013;24:140–146. doi: 10.1016/j.solidstatesciences.2013.07.016. [DOI] [Google Scholar]
- 74.Zeyada HM, El-Nahass MM. Electrical properties and dielectric relaxation of thermally evaporated zinc phthalocyanine thin films. Appl. Surf. Sci. 2008;254(6):1852–1858. doi: 10.1016/j.apsusc.2007.07.175. [DOI] [Google Scholar]
- 75.Morii K, et al. Dielectric relaxation in amorphous thin films of SrTiO3 at elevated temperatures. J. Appl. Phys. 1995;78(3):1914–1919. doi: 10.1063/1.360228. [DOI] [Google Scholar]
- 76.Long A. Frequency-dependent loss in amorphous semiconductors. Adv. Phys. 1982;31(5):553–637. doi: 10.1080/00018738200101418. [DOI] [Google Scholar]
- 77.Alosabi A, et al. Electrical conduction mechanism and dielectric relaxation of bulk disodium phthalocyanine. Phys. Scr. 2022;97(5):055804. doi: 10.1088/1402-4896/ac5ff8. [DOI] [Google Scholar]
- 78.Gajula GR, et al. An investigation on the conductivity, electric modulus and scaling behavior of electric modulus of barium titanate-lithium ferrite composite doped with Nb, Gd and Sm. Mater. Chem. Phys. 2020;241:122347. doi: 10.1016/j.matchemphys.2019.122347. [DOI] [Google Scholar]
- 79.Rayssi C, et al. Frequency and temperature-dependence of dielectric permittivity and electric modulus studies of the solid solution Ca0.85Er0.1Ti1-xCo4x/3O3 (0 ≤ x ≤ 01) RSC Adv. 2018;8(31):17139–17150. doi: 10.1039/C8RA00794B. [DOI] [PMC free article] [PubMed] [Google Scholar]
- 80.Mohamed MB, Abdel-Kader MH. Effect of annealed ZnS nanoparticles on the structural and optical properties of PVA polymer nanocomposite. Mater. Chem. Phys. 2020;241:122285. doi: 10.1016/j.matchemphys.2019.122285. [DOI] [Google Scholar]
- 81.Sugumaran S, Bellan CS, Nadimuthu M. Characterization of composite PVA–Al2O3 thin films prepared by dip coating method. Iran. Polym. J. 2015;24(1):63–74. doi: 10.1007/s13726-014-0300-5. [DOI] [Google Scholar]
Associated Data
This section collects any data citations, data availability statements, or supplementary materials included in this article.
Data Availability Statement
All data generated or analysed during this study are included in this published article.


