

Abstract
BACKGROUND:
Psoriatic arthritis (PsA) is a chronic progressive inflammatory condition associated with significant direct and indirect costs. Tofacitinib is an oral Janus kinase inhibitor for the treatment of PsA. Economic evaluations, alongside clinical data, help inform papers and formulary decisions in the United States.
OBJECTIVE:
To evaluate outcomes and costs of including tofacitinib in treatment strategies for PsA from a third-party U.S. payer perspective, using a health economic model.
METHODS:
A decision tree model was developed to evaluate treatment sequences (up to 4 lines of advanced PsA therapy) with or without tofacitinib. Patients included in the model had active PsA and a previous inadequate response (IR) to conventional synthetic disease-modifying antirheumatic drug (csDMARD) or tumor necrosis factor inhibitor (TNFi) therapy. The analysis time horizon was 2 years; decision points for continuing/switching treatments occurred quarterly, based on clinical response (assessed using the primary rheumatoid measure of efficacy, American College of Rheumatology [ACR]20 response only) and adverse drug reactions (ADRs). Costs included those related to ADRs and drug acquisition, monitoring, and administration. Other endpoints of PsA, such as assessment of enthesitis and dactylitis, were not integrated into the model.
RESULTS:
Treatment strategies including tofacitinib were associated with cost savings versus strategies without tofacitinib across all modeled scenarios, with an estimated 2-year cost saving of up to $8,454,858, based on 1 million insurants. Similarly, costs per member per month and per ACR20 responder were lower for sequences including tofacitinib versus sequences without. These savings arose because of lower ADR and drug acquisition/administration costs for sequences including tofacitinib. Deterministic sensitivity analyses showed these results to be robust.
CONCLUSIONS:
This analysis suggests that including tofacitinib in the treatment of active PsA in csDMARD-IR or TNFi-IR patients is a cost-saving alternative to sequences without tofacitinib, potentially reducing costs for PsA advanced therapies by up to $8.4 million over 2 years for payers insuring 1 million individuals.
What is already known about this subject
Psoriatic arthritis (PsA) is associated with substantial direct health care costs and indirect costs related to disability and loss of productivity.
Previous economic analyses in the United States have demonstrated cost savings associated with tofacitinib as a second-line therapy for rheumatoid arthritis (RA), following an inadequate response to methotrexate, and as a third-line therapy, following biologic disease-modifying antirheumatic drug (DMARD) failure compared with alternative RA pathways of care.
What this study adds
We present one of the first models designed to evaluate the economic impact of including tofacitinib in treatment strategies for PsA from a third-party U.S. payer perspective.
Results showed that the incorporation of tofacitinib into treatment sequences for patients with active PsA (including tumor necrosis factor inhibitor [TNFi]-naive and TNFi-inadequate responder patients) following failure of conventional synthetic DMARD therapy was associated with greater response as measured by American College of Rheumatology (ACR)20/50/70, as well as lower total costs, costs per member per month, and costs per ACR20 responder when compared with sequences excluding tofacitinib.
Inclusion of tofacitinib on formulary for a payer insuring 1 million individuals could reduce payer costs for advanced PsA therapies by up to $8.4 million over 2 years.
Psoriatic arthritis (PsA) is a chronic, inflammatory spondyloarthropathy, affecting ligaments, tendons, joints, nails, and skin.1 Because of its progressive nature, PsA is associated with substantial direct health care costs and indirect costs related to disability and loss of productivity.2-4 With prevalence in North America estimated to be 0.13%,5 and a 2015 review of publications reporting that incidence in the general population ranges from 3.6 to 7.2 per 100,000 patient-years,6 PsA represents a considerable economic burden to patients and society. As prevalence of PsA is increasing in Canada, Denmark, Israel, and Taiwan,7-10 the costs of this disease are likely to increase further.
Treatment options for PsA include nonsteroidal anti-inflammatory drugs (NSAIDs), conventional synthetic disease-modifying antirheumatic drugs (csDMARDs), biologic DMARDs (bDMARDs), and targeted synthetic DMARDs (tsDMARDs).11,12 bDMARD treatments for PsA comprise tumor necrosis factor (TNF)-α and interleukin (IL) inhibitor therapies, while the tsDMARD class contains phosphodiesterase 4 (PDE-4) and Janus kinase (JAK) pathway inhibitors.11,12
Until recently, treatment recommendations for active PsA suggested csDMARDs as initial therapy after failure of NSAIDs, followed by bDMARD or tsDMARD treatment, if necessary.11,12 In patients with peripheral arthritis and an inadequate response (IR) to ≥ 1 csDMARD, initial bDMARD treatment would usually be a TNF inhibitor (TNFi; e.g., adalimumab, etanercept). While for patients for whom TNFi are inappropriate, bDMARDs targeting IL-12/23 or IL-17 pathways, such as secukinumab, may be considered. If bDMARDs are not appropriate, tsDMARD treatment may be an option.11,12 More recent guidelines by the American College of Rheumatology (ACR) and the National Psoriasis Foundation recommend a different treatment approach: biologic TNFi therapy, rather than csDMARDs or the PDE-4 inhibitor apremilast, is conditionally recommended as first-line therapy for active PsA in treatment-naive patients, while csDMARDs or apremilast may be considered for patients without severe PsA and psoriasis, patients who prefer oral treatment over parenteral therapy, or those for whom TNFi are inappropriate.13 In patients with active PsA and an IR to csDMARDs or apremilast, switching to a TNFi is conditionally recommended over switching to a different csDMARD or apremilast, while tofacitinib may be considered for those without severe psoriasis who prefer oral medication or those with contraindications to TNFi.13 Similarly, in patients with active PsA and an IR to TNFi monotherapy, switching to tofacitinib over a different TNFi is conditionally recommended if the patient prefers oral therapy or had a primary TNFi efficacy failure or a TNFi-associated serious adverse effect.13
Tofacitinib is an oral JAK inhibitor for the treatment of PsA. The efficacy and safety of tofacitinib 5 and 10 mg twice daily (BID) has been demonstrated in phase 3 trials of up to 12 months’ duration in patients with PsA and an IR to csDMARDs or TNFi therapy and has been investigated in a long-term extension study (NCT01976364, completed May 20, 2019; database locked as of July 30, 2019).14,15 In the United States, tofacitinib 5 mg BID (immediate-release formulation) and 11 mg once daily (QD; modified-release [MR] formulation) are approved for the treatment of adult patients with active PsA with IR or intolerance to methotrexate or other DMARDs.16
Despite the development of new PsA treatments, a recently published study of U.S. claims data from 2009 to 2014 reported that the all-cause direct health care costs for PsA patients remained high at $26,883 per patient per year (vs. $7,181 for control patients, defined as patients who had never had a diagnosis of PsA or psoriasis in their entire claims history).2
As patient populations evolve and new medications enter the market, health economic evaluations can provide critical information for payers and formulary decision makers. To better understand the effect of including tofacitinib on U.S. payer formularies for treatment of DMARD-IR patients with active PsA, a decision tree model was designed using the most commonly prescribed and reimbursed PsA treatments to estimate and compare clinical response, total costs, and, most importantly for U.S. payers, costs per member per month (PMPM), and between treatment sequences with and without tofacitinib.17
Methods
Patient Population Inputs
Patient population data were sourced using published literature and U.S. databases. In the base case, the starting organization size was assumed to be 1 million insurants. Model input parameters and derived populations are shown in Table 1.
TABLE 1.
Patient Population Data Inputs
| Population Parameter | % | Population | Source |
|---|---|---|---|
| Organization size | – | 1,000,000 | Assumption |
| PsA prevalence | 0.13 | 1,300 | Stolwijk et al. (2016)5 |
| Diagnosed patients | 65 | 845 | Decision Resources Group |
| DMARD-treated patients | 58 | 490 | Truven Health Analytics |
| bDMARD- or tsDMARD-treated IR patientsa | 56 | 274 | Truven Health Analytics |
| Subpopulations | |||
| TNFi-naïve patients | 55 | 151 | Assumption |
| TNFi-IR patients | 45 | 124 | Assumption |
Note: Numbers may not sum to total because of rounding.
aIt is assumed that all patients with an IR to bDMARD or tsDMARD were eligible for treatment with tofacitinib.
bDMARD = biologic disease-modifying antirheumatic drug; DMARD = disease-modifying antirheumatic drug; IR = inadequate responder; PsA = psoriatic arthritis; TNFi = tumor necrosis factor inhibitor; tsDMARD = targeted synthetic disease-modifying antirheumatic drug.
The model considered patients with active PsA eligible for bDMARD or tsDMARD therapy, such as tofacitinib, following failure of either csDMARD (TNFi-naive) or TNFi (TNFi-IR) treatment. The model provided the option to analyze all eligible PsA patients as described above, as well as the TNFi-naive and TNFi-IR patient subpopulations.
Model Design and Comparators
A decision tree model was developed,17 which allowed comparison of multiple treatment strategies, each with up to 4 lines of advanced therapy for PsA (Table 2). It was assumed that all patients had a previous IR to csDMARDs. The primary endpoints of interest were the number of treatment responders (as measured by ACR response criteria), total costs, and costs PMPM.
TABLE 2.
Comparator Sequences Used in the Base Case Analysis
| Line of Treatmenta | Treatment Sequence Excluding Tofacitinib | Tofacitinib Comparator Sequence 1 | Tofacitinib Comparator Sequence 2 | Tofacitinib Comparator Sequence 3 |
|---|---|---|---|---|
| First | ADA | TOF | ADA | APR |
| Second | ETA | ADA | TOF | TOF |
| Third | APR | ETA | ETA | ADA |
| Fourth | SEC | APR | APR | SEC |
Note: ADA and ETA are TNFi, and SEC is an anti-IL-17A antagonist, collectively described as bDMARDs; APR and TOF are tsDMARDs and act via targeted inhibition of PDE-4 and JAK, respectively.
aTreatments administered at label-approved dose.
ADA = adalimumab; APR = apremilast; bDMARD = biologic disease-modifying antirheumatic drug; ETA = etanercept; IL = interleukin; JAK = Janus kinase; PDE-4 = phosphodiesterase 4; SEC = secukinumab; TNFi = tumor necrosis factor inhibitor; TOF = tofacitinib; tsDMARD = targeted synthetic disease-modifying antirheumatic drug.
Treatments included in the base case analysis were tofacitinib and recommended therapies (at the time of the study) for patients with active PsA.11,12 The sequencing of treatments was based on current recommendations (at the time of the study) and potential reimbursement guidance.11,12 Each comparator included in the model was reflective of the label-approved dose, and patients were assumed to be receiving concomitant csDMARDs.
Figure 1 shows the model structure. The time horizon was 2 years, to reflect the short-term planning horizon of U.S. payers. Decision points for continuing/switching treatments occurred every 3 months, based on treatment response and occurrence of adverse drug reactions (ADRs). Other endpoints of PsA, such as assessment of enthesitis and dactylitis, were not integrated into the model. Patients reaching fourth-line therapy remain on that treatment until the end of the model time horizon.
FIGURE 1.
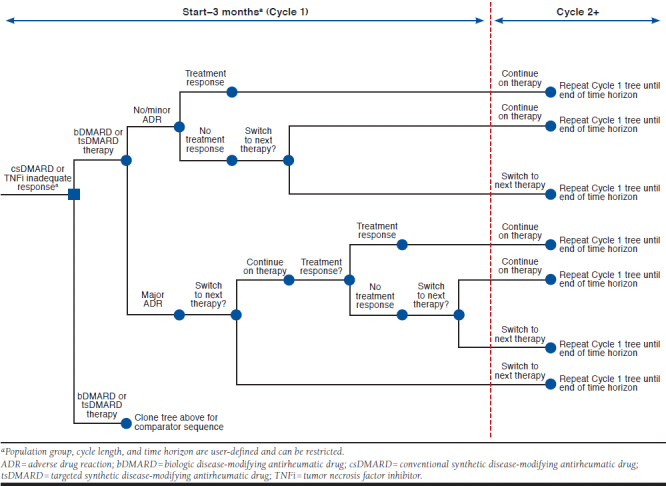
Decision Tree Model
Because of the short time horizon of the model, no discounting of costs or economic outcomes was applied. In addition to internal verification of model calculations, external peer review of calculations was also performed.
Treatment Response and Safety Data
Treatment response was assessed using ACR20/50/70 responses, validated primary or secondary endpoints commonly used as effectiveness measures in PsA clinical trials. ACR20 was used as a proxy for adequate response to treatment; patients who did not achieve this response were assumed to immediately switch treatment.
For ACR responses, 3- and 6-month data endpoints were used, with 3-monthly response decline parameters applied after 6 months (set to 0% by default, because of lack of data). The primary source for treatment response data was the U.S. prescribing information (USPI) accessed at the time of the study for each treatment.16,18-21 Pooled estimates from clinical trial publications were used instead, if: data were not available in the USPI specifically for PsA treatment, csDMARD IR and TNFi-IR population-specific data were available in clinical trial publications but not in the USPI, or data points closer to 3 or 6 months were available in clinical trial publications.
Where available, TNFi-naive data were applied for first-line (post csDMARD-IR) patients, and TNFi-IR data for second-, third-, and fourth-line patients. If population-specific data were not available, alternative data were used (e.g., mixed population data for both populations, or csDMARD-IR data for TNFi-IR); as data were unavailable for secukinumab before 24 weeks, 6-month data were also applied at 3 months in the model. Because of a lack of trial data (at the time of the study), tofacitinib MR 11 mg QD was assumed to have the same efficacy as tofacitinib 5 mg BID, supported by pharmacologic and exposure-response modeling evidence.22,23 It should be noted that ACR70 response data at month 3 were not statistically significant versus placebo in 1 tofacitinib trial.15 Similarly, ACR70 response data at week 16 were not statistically significant versus placebo in 1 apremilast trial.24
To account for the effect of ADRs, major and minor ADR probabilities were applied for each therapy. Serious infections and upper respiratory tract infections (URTIs) were used as proxies for major and minor ADRs, respectively. For patients who experienced major ADRs, similar to other rheumatology models,25 the probability of switching to the next line of therapy was set at 75% in the base case model. Those experiencing a minor ADR continued their current treatment if they had an ACR20 response. This was applied independently of the drug-survival adjustment.
As PsA-specific ADR data were only reported in the USPI for apremilast, ADR probabilities for each treatment were based on the ADRs experienced during the placebo-controlled phases of their respective clinical trials (except secukinumab, where these data were not available). Assuming that ADRs occur at a constant rate, ADR probabilities were adjusted for time and pooled across trials. For apremilast, trials for which the number of serious infections could not be determined were excluded from the calculation. In addition, because of missing data, abatacept intravenous therapy was assumed to have the same URTI probabilities as abatacept subcutaneous therapy. As no serious infections occurred within the placebo-controlled periods for tofacitinib 5 mg or etanercept, a 0% probability of major ADRs was applied for each treatment. Similar to treatment response, tofacitinib MR 11 mg QD was assumed to have the same safety profile as tofacitinib immediate-release 5 mg BID. For secukinumab, only 52-week data were available for serious infections; therefore, major ADR probabilities were based on serious infection event rates at 52 weeks.
Drug Survival Adjustment
In the base case analysis, drug survival, the cumulative percentage of patients remaining on treatment over time, was adjusted to prevent the overestimation of response-related treatment discontinuation and account for the conditional probability of patients achieving ACR20 over time, given that they have remained on treatment up to that point.
In each cycle of the adjusted model, the “current maximum” ACR response was used to prevent ACR response from exceeding response-related drug survival; this was defined as the maximum ACR20 response achieved within the remaining time frame of the model (e.g., if maximum ACR20 response was achieved at 3 months, at 6 months the “current maximum” ACR20 response would be less than or equal to the value at 3 months, as it would reflect the maximum response achieved after 3 months).
Discontinuations because of major ADRs were treated as independent from ACR response-related discontinuations (i.e., these occur with the same probability regardless of ACR response and drug survival).
Resource Use and Unit Cost
Treatment costs, including costs associated with drug administration and monitoring and major/minor ADR costs, were estimated based on the predicted treatment pathway. Costs of concomitant csDMARD therapy or rebates were not included in this model.
Drug costs were estimated using wholesale acquisition cost prices, sourced from AnalySource (prices as of January 4, 2018),26 with the number of induction and maintenance doses for each treatment based on USPIs.16,18-21 Drug administration costs, sourced from InGauge Healthcare Solutions,27 included visits to health care providers, self-injection training, and intravenous infusion. As ACR guidelines for laboratory monitoring are currently unavailable for PsA, the latest ACR guidelines for rheumatoid arthritis (RA) were used as a proxy.28
For major ADRs, a pneumonia event cost (assuming it would be broadly representative of the cost of treating a serious infection) estimated by the Agency for Healthcare Research and Quality,27 and a cost for a follow-up outpatient visit were included.29 For minor ADRs, the expected resource costs were taken from the assumed treatment of a URTI and included the cost of a primary care physician visit and a 7-day course of augmentin.27,30
Incremental, Sensitivity, and Scenario Analyses
A full incremental analysis was conducted to rule out strategies dominated by another sequence having more responders at a lower cost. The incremental cost-effectiveness ratio (ICER) was reported for each remaining strategy, calculated as the additional cost of the strategy divided by its additional benefit (based on the number of additional ACR responders) versus the next most effective strategy.
To identify the most sensitive data input parameters, deterministic sensitivity analyses were presented in tornado diagrams. Except for the ACR response decline parameters, which were manually defined to have a 0% lower and 10% upper value, each input parameter was increased and decreased by 20%. The tornado diagram sensitivity analyses also included different sequencing of therapies including tofacitinib. In addition, 1-way sensitivity analyses were run on each switching probability parameter to explore the effect of varying the switching probabilities, because of treatment nonresponse and major ADRs, on total costs.
To model the implications of alternative options for costs and outcomes, scenario analyses were conducted for the TNFi-naive and TNFi-IR subpopulations. In contrast to the base case analysis, the TNFi-IR scenario analysis compared 3 treatment sequences. All patients were assumed to have failed TNFi treatment in first-line therapy, and only the latter 3 lines of therapy were modeled and costed: treatment sequence 1 (adalimumab, apremilast, secukinumab), treatment sequence 2 (tofacitinib, adalimumab, apremilast), and treatment sequence 3 (etanercept, apremilast, secukinumab).
A further scenario analysis was conducted with the non-adjusted drug survival applied. In each of the scenario analyses, aside from the variations described, all parameters remained the same as in the base case analysis. An additional scenario analysis in which the ACR50 response was used as a proxy for adequate response to treatment was also completed (results not shown).
Results
Base Case Analysis
Among 1 million insurants, it was estimated that the “all eligible PsA patients” population (i.e., patients diagnosed with active PsA who experienced failure of csDMARD or TNFi treatment and are eligible for bDMARD or tsDMARD therapy, including tofacitinib) would consist of 274 patients (Table 1).
Of the 4 strategies analyzed, all sequences including tofacitinib were associated with reduced total costs and reduced costs PMPM versus the treatment sequence excluding tofacitinib, with the lowest costs seen with tofacitinib comparator sequence 3 (Table 3). Furthermore, while the number of patients predicted to achieve an ACR20 response was similar for each treatment sequence, those sequences including tofacitinib had a lower cost per ACR20 responder versus the treatment sequence excluding tofacitinib (Table 3); tofacitinib comparator sequence 3 was again the least expensive.
TABLE 3.
Total Costs over 2 Years Without Rebate
| Treatment Sequence Excluding Tofacitinib | Tofacitinib Comparator Sequence 1 | Tofacitinib Comparator Sequence 2 | Tofacitinib Comparator Sequence 3 | |
|---|---|---|---|---|
| Treatment sequence | ADA→ETA→APR→SEC | TOF→ADA→ETA→APR | ADA→TOF→ETA→APR | APR→TOF→ADA→SEC |
| Total costs, $ | 36,449,210 | 31,225,220 | 34,419,371 | 27,994,352 |
| Total costs PMPM, $ | 1.52 | 1.30 | 1.43 | 1.17 |
| Total ACR20 responders | 252 | 261 | 261 | 253 |
| Total costs per ACR20 responder, $ | 144,376 | 119,706 | 132,040 | 110,683 |
| Total ACR50 responders | 169 | 171 | 174 | 141 |
| Total costs per ACR50 responder, $ | 215,900 | 182,806 | 198,351 | 198,462 |
| Total ACR70 responders | 81 | 81 | 94 | 72 |
| Total costs per ACR70 responder, $ | 449,473 | 383,946 | 368,076 | 388,119 |
| Cost type, $ | ||||
| Drug acquisition | 35,777,297 | 30,516,914 | 33,762,831 | 27,215,006 |
| Administration | 407,956 | 377,332 | 393,876 | 393,781 |
| Monitoring | 173,495 | 291,723 | 214,204 | 323,808 |
| ADR | 90,463 | 39,251 | 48,460 | 61,757 |
ACR20/50/70 = American College of Rheumatology response criteria of 20/50/70%; ADA = adalimumab; ADR = adverse drug reaction; APR = apremilast; ETA = etanercept; PMPM = per member per month; SEC = secukinumab; TOF = tofacitinib.
Sequences including tofacitinib had lower drug acquisition, administration, and ADR costs versus the treatment sequence excluding tofacitinib (Table 3). Notably, monitoring costs for the sequences including tofacitinib were higher than those for the treatment sequence excluding tofacitinib.
At year 2, patient distribution by treatment line was similar between the treatment sequence excluding tofacitinib, and tofacitinib comparator sequences 1 and 2, with 55.8%, 59.0%, and 55.8% of patients remaining on first-line treatment, and 22.2%, 23.0%, and 26.6% of patients remaining on second-line treatment, respectively. In contrast, most patients in tofacitinib comparator sequence 3 (41.2%) were on second-line treatment at year 2, with 31.5% remaining on first-line treatment. The proportions of patients receiving third- and fourth-line treatment at year 2 were generally similar across treatment groups, with a marginally higher proportion of patients in tofacitinib comparator sequence 3 on third- or fourth-line treatment (15.4% and 12.0%, respectively) versus the other treatment sequences (treatment sequence excluding tofacitinib: 10.0% and 12.0%; tofacitinib sequence 1: 9.1% and 9.0%; and tofacitinib comparator sequence 2: 8.9% and 8.8%, respectively).
Incremental Analysis
The incremental analysis showed that the treatment sequence excluding tofacitinib (which had the highest costs and lowest number of ACR20 responders) was dominated by all sequences including tofacitinib (Table 4). Tofacitinib comparator sequence 2 had an ICER of $844,671 per ACR20 responder versus tofacitinib comparator sequence 3, but was dominated by tofacitinib comparator sequence 1 (Table 4).
TABLE 4.
Incremental Analysis
| Strategy | Treatment Sequence | Incremental | ICER ($ per ACR20 Responder) | ||
|---|---|---|---|---|---|
| Costs, $ | ACR20 Responders | Versus Baseline,a $ | Incremental, $ | ||
| Tofacitinib comparator sequence 3 | APR→TOF→ADA→SEC | N/A | N/A | N/A | N/A |
| Tofacitinib comparator sequence 1 | TOF→ADA→ETA→APR | 3,301,907 | 8 | 416,612 | 416,612 |
| Tofacitinib comparator sequence 2 | ADA→TOF→ETA→APR | 6,547,825 | 8 | 844,671 | Dominated |
| Treatment sequence excluding tofacitinib | ADA→ETA→APR→SEC | 8,562,291 | 0 | Dominated | Dominated |
aWithout tofacitinib in the treatment algorithm.
ACR20 = American College of Rheumatology response criteria of 20%; ADA = adalimumab; APR = apremilast; ETA = etanercept; ICER = incremental cost-effectiveness ratio; N/A = not applicable; SEC = secukinumab; TOF = tofacitinib.
Sensitivity Analyses
Deterministic sensitivity analyses of the treatment sequences and key parameters confirmed the model results to be robust, with sequences including tofacitinib consistently being cost saving versus the treatment sequence excluding tofacitinib (Appendix A, available in online article, reports sensitivity analyses results with tofacitinib as first-line therapy only; other comparator sequences not shown). The tornado diagram illustrated that pack/vial costs, 6-month ACR20 response, and the response decline parameters were generally the most sensitive inputs, irrespective of the tofacitinib line of therapy compared.
One-way sensitivity analysis indicated that total costs decreased with lower switching probabilities because of treatment nonresponse for tofacitinib comparator sequences 1 and 3 (Appendix B, available in online article). The sensitivity analysis of the major ADR switching probability suggested that the parameter had a minor effect on the results (Appendix B).
Scenario Analysis
Scenario 1: Analysis of the TNFi-Naive Subpopulation.
Of the 274 PsA patients in the “all eligible patients” population, it was estimated that 151 patients would be TNFi-naive (Table 1).
Results were similar to the base case analysis; all sequences including tofacitinib reduced total costs, costs PMPM, and total cost per ACR20 responder versus the treatment sequence excluding tofacitinib. Tofacitinib comparator sequence 3 was the least expensive, reducing total costs by $4,650,172 versus the treatment sequence excluding tofacitinib. Tofacitinib comparator sequences 1 and 2 reduced the total costs by $2,873,195 and $1,116,412, respectively, versus the treatment sequence excluding tofacitinib. Tofacitinib comparator sequence 2 had an ICER of $844,671 per ACR20 responder versus tofacitinib comparator sequence 3, but was dominated by tofacitinib comparator sequence 1.
Scenario 2: Analysis of the TNFi-IR Subpopulation with Updated Sequences.
Of the 274 PsA patients in the “all eligible patients” population, the estimated TNFi-IR subpopulation consisted of 124 patients (Table 1).
In this scenario, tofacitinib comparator treatment sequence 2 was the least expensive of the 3 treatment sequences modeled, reducing total costs by $2,270,862 and $2,228,755 versus sequence 1 and sequence 3, respectively. With the lowest total costs and highest number of ACR20 responders, tofacitinib comparator treatment sequence 2 dominated both tofacitinib comparator treatment sequences 1 and 3.
Scenario 3: Analysis with the Nonadjusted Drug Survival Applied.
Compared with the base case analysis (Table 3), the numbers of ACR20 responders were greatly reduced for all treatment sequences when the nonadjusted drug survival was applied (treatment sequence excluding tofacitinib, n=103; tofacitinib comparator sequence 1, n = 128; tofacitinib comparator sequence 2, n = 128; tofacitinib comparator sequence 3, n = 112).
As in the base case analysis, total costs over 2 years (without rebate) were lower for sequences including tofacitinib versus the treatment sequence excluding tofacitinib (treatment sequence excluding tofacitinib, $38,596,675; tofacitinib comparator sequence 1, $31,510,263; tofacitinib comparator sequence 2, $31,614,368; tofacitinib comparator sequence 3, $35,879,356). Because of a lower number of ACR20 responders in this scenario versus the base case analysis, costs per ACR20 responder were greatly increased when the nonadjusted drug survival was applied (treatment sequence excluding tofacitinib, $375,294; tofacitinib comparator sequence 1, $246,301; tofacitinib comparator sequence 2, $246,162; tofacitinib comparator sequence 3, $319,726). Tofacitinib comparator sequence 1 dominated the treatment sequence excluding tofacitinib and tofacitinib comparator sequence 3, with an ICER of $216,856 per ACR20 responder for comparator sequence 2.
In contrast to the base case analysis, in which most patients were on first- or second-line treatment at year 2, in this scenario, most patients were on fourth-line treatment after 2 years, regardless of treatment sequence (treatment sequence excluding tofacitinib, 84.5%; tofacitinib comparator sequence 1, 76.6%; tofacitinib comparator sequence 2, 76.2%; tofacitinib comparator sequence 3, 83.4%). Across treatment sequences, < 2% and < 7% of patients were on first- and second-line treatment at year 2, respectively.
Discussion
We are presenting one of the first decision tree models designed to evaluate the economic impact of including tofacitinib in treatment strategies for PsA from a third-party U.S. payer perspective. Results from this model suggest that incorporating tofacitinib into treatment sequences for patients with active PsA (including TNFi-naive and TNFi-IR patients) following failure of csDMARD therapy could be cost saving versus a treatment sequence without tofacitinib. This conclusion was reiterated by subgroup analyses of either TNFi-naive or TNFi-IR patients, comparing treatment sequences without tofacitinib to treatment sequences with tofacitinib. In all patient populations analyzed, sequences including tofacitinib incurred lower total costs, costs PMPM, and costs per ACR20 responder versus sequences excluding tofacitinib. Notably, sequences including tofacitinib were shown to be associated with substantially lower ADR costs and decreased drug administration and acquisition costs versus sequences excluding tofacitinib. In combination, these savings greatly outweighed the increased monitoring costs for tofacitinib sequences. The results presented here further support the economic value of incorporating tofacitinib into treatment strategies for rheumatology patients, as reported in previous cost analyses of tofacitinib in RA.31,32
Sensitivity analyses showed the results to be robust. Costs associated with treatment and drug acquisition were the most sensitive parameters, and the ACR20 response had a substantial effect on the model calculations.
The base case analysis applied a drug-survival adjustment to prevent overestimation of response-related treatment discontinuation and underestimation of the number of ACR20 responders. A scenario analysis was conducted in which this drug-survival adjustment was “switched off.” Consequently, the number of ACR20 responders in this scenario was drastically reduced across all treatment strategies versus the base case analysis. However, the favorable cost outcomes with tofacitinib remained robust, and total costs, costs PMPM, and costs per ACR20 responder were lower for all sequences including tofacitinib versus the treatment sequence excluding tofacitinib. Furthermore, results of a scenario analysis in which ACR50 was used as a proxy for adequate response to treatment were consistent with those observed in the base case analysis (data not shown).
Limitations
Some limitations remain associated with this decision tree model. For example, the model included cross-trial efficacy and safety comparisons from clinical trials not performed contemporaneously, which may have had different study designs and patient populations (e.g., different disease severity and disease duration at baseline). Therefore, the data may not be comparable. Additionally, estimates of treatment efficacy were based on randomized controlled trials. In clinical practice, outcomes of treatment may differ, which could potentially affect health care costs. Costs of concomitant csDMARD therapy were not included in the model; however, this is anticipated to have a minimal effect on results because of the relatively low costs of csDMARDS versus bDMARDs or tsDMARDS. Because of confidentiality practices across all agreements, rebates and contracting details were also not included in this model, which may affect the cost outcomes and limit the general applicability of the findings to the real-world setting.
A further limitation of this analysis was that treatment switching because of reasons other than major ADRs or treatment nonresponse was not considered. Additionally, because of a general lack of reporting on treatment exposure time and ADR event rates, safety probabilities were largely estimated from the proportion of patients experiencing the event during the placebo-controlled period of the trial. This is likely to overestimate the actual ADR probability. Furthermore, the outcome measures used (ACR response) did not capture the full spectrum of PsA clinical manifestations, such as those affecting the skin or other musculoskeletal domains. Finally, a lack of clinical response/response decline data to inform longer-term discontinuation in the base case analysis may mean that longer-term discontinuation is slightly underestimated. However, because of the short time horizon of our model, any underestimation is likely to be minimal.
Interestingly, a recent study of long-term TNFi persistence has shown that discontinuations because of inadequate clinical responses are seen up to, and after, 2 years.33 Similarly, a comparison of discontinuation data for golimumab treatment in patients with active PsA shows that a small number of patients discontinued between years 2 and 5 because of unsatisfactory clinical response.34,35 While there is limited evidence for longer-term treatment discontinuation because of inadequate clinical response with PsA, equivalent discontinuations have been reported for psoriasis and RA. For example, studies of bDMARD treatment in patients with psoriasis (of whom, a portion had PsA) reported discontinuations because of lack of clinical efficacy up to, and after, 2 years in both TNFi-naive and TNFi-IR patient populations.36-39 Similarly, discontinuation of bDMARDs because of inadequate clinical response through 30 months, 36 months, and 14 years have been reported in TNFi-naive and TNFi-IR patients with RA.40-42
Notably, the drug-survival estimates we observed in the adjusted model are comparable with those seen in previous studies of real-world data,43,44 suggesting that they may be more accurate than estimates seen in the unadjusted model. Going forward, formal testing of the model adjusted for drug survival against real-world data is required to fully validate this approach.
Conclusions
The increasing availability of treatment options for PsA presents challenges regarding coverage of high-cost therapies. Although bDMARDs are efficacious and cost-effective therapies for PsA versus csDMARDs,45,46 their high costs contribute to the overall economic burden of the disease.46 Therefore, economic evaluations of new therapy options are valuable to inform payers and formulary decisions. This analysis suggests that including tofacitinib in treatment sequences for TNFi-naive or TNFi-IR patients with PsA is a cost-saving alternative to treatment sequences without tofacitinib. Inclusion of tofacitinib on formulary for a payer insuring 1 million individuals could reduce payer costs for advanced PsA therapies by up to $8.4 million over 2 years, depending on the sequencing of tofacitinib treatment.
ACKNOWLEDGMENTS
Medical writing support, under the guidance of the authors, was provided by Kirsten Woollcott, MSc, CMC Connect, McCann Health Medical Communications, funded by Pfizer Inc.
APPENDIX A. Comparison of Total Costs for Sequences Including Tofacitinib as First-Line Therapy with the Treatment Sequence Excluding Tofacitinib

APPENDIX B. One-Way Sensitivity Analyses of Switching Probabilities Because of Treatment Nonresponse or Major ADRs

DATA-SHARING STATEMENT
Upon request, and subject to certain criteria, conditions, and exceptions (see https://www.pfizer.com/science/clinical-trials/trial-data-and-results for more information), Pfizer will provide access to individual de-identified participant data from Pfizer-sponsored global interventional clinical studies conducted for medicines, vaccines, and medical devices (1) for indications that have been approved in the U.S. and/or E.U. or (2) in programs that have been terminated (i.e., development for all indications has been discontinued). Pfizer will also consider requests for the protocol, data dictionary, and statistical analysis plan. Data may be requested from Pfizer trials 24 months after study completion. The de-identified participant data will be made available to researchers whose proposals meet the research criteria and other conditions, and for which an exception does not apply, via a secure portal. To gain access, data requesters must enter into a data-access agreement with Pfizer.
REFERENCES
- 1.Ritchlin CT, Colbert RA, Gladman DD.. Psoriatic arthritis. N Engl J Med. 2017;376(10):957-70. [DOI] [PubMed] [Google Scholar]
- 2.Merola JF, Herrera V, Palmer JB.. Direct healthcare costs and comorbidity burden among patients with psoriatic arthritis in the USA. Clin Rheumatol. 2018;37(10):2751-61. [DOI] [PubMed] [Google Scholar]
- 3.Lee S, Mendelsohn A, Sarnes E.. The burden of psoriatic arthritis: a literature review from a global health systems perspective. PT. 2010;35(12):680-89. [PMC free article] [PubMed] [Google Scholar]
- 4.Kawalec P, Malinowski KP.. The indirect costs of psoriatic arthritis: systematic review and meta-analysis. Expert Rev Pharmacoecon Outcomes Res. 2015;15(1):125-32. [DOI] [PubMed] [Google Scholar]
- 5.Stolwijk C, van Onna M, Boonen A, van Tubergen A.. Global prevalence of spondyloarthritis: a systematic review and meta-regression analysis. Arthritis Care Res (Hoboken). 2016;68(9):1320-31. [DOI] [PubMed] [Google Scholar]
- 6.Ogdie A, Weiss P.. The epidemiology of psoriatic arthritis. Rheum Dis Clin North Am. 2015;41(4):545-68. [DOI] [PMC free article] [PubMed] [Google Scholar]
- 7.Eder L, Widdifield J, Rosen CF, et al. Trends in the prevalence and incidence of psoriasis and psoriatic arthritis in Ontario, Canada: a population-based study. Arthritis Care Res (Hoboken). 2019;71(8):1084-91. [DOI] [PubMed] [Google Scholar]
- 8.Egeberg A, Kristensen LE, Thyssen JP, et al. Incidence and prevalence of psoriatic arthritis in Denmark: a nationwide register linkage study. Ann Rheum Dis. 2017;76(9):1591-97. [DOI] [PubMed] [Google Scholar]
- 9.Eder L, Cohen AD, Feldhamer I, Greenberg-Dotan S, Batat E, Zisman D.. The epidemiology of psoriatic arthritis in Israel - a population-based study. Arthritis Res Ther. 2018;20(1):3. [DOI] [PMC free article] [PubMed] [Google Scholar]
- 10.Wang TS, Hsieh CF, Tsai TF.. Epidemiology of psoriatic disease and current treatment patterns from 2003 to 2013: a nationwide, population-based observational study in Taiwan. J Dermatol Sci. 2016;84(3):340-45. [DOI] [PubMed] [Google Scholar]
- 11.Gossec L, Smolen JS, Ramiro S, et al. European League Against Rheumatism (EULAR) recommendations for the management of psoriatic arthritis with pharmacological therapies: 2015 update. Ann Rheum Dis. 2016;75(3):499-510. [DOI] [PubMed] [Google Scholar]
- 12.Coates LC, Kavanaugh A, Mease PJ, et al. Group for Research and Assessment of Psoriasis and Psoriatic Arthritis 2015 treatment recommendations for psoriatic arthritis. Arthritis Rheumatol. 2016;68(5):1060-71. [DOI] [PubMed] [Google Scholar]
- 13.Singh JA, Guyatt G, Ogdie A, et al. 2018 American College of Rheumatology/National Psoriasis Foundation guideline for the treatment of psoriatic arthritis. Arthritis Care Res (Hoboken). 2018;71(1):2-29. [DOI] [PMC free article] [PubMed] [Google Scholar]
- 14.Mease P, Hall S, Fitzgerald O, et al. Tofacitinib or adalimumab versus placebo for psoriatic arthritis. N Engl J Med. 2017;377(16):1537-50. [DOI] [PubMed] [Google Scholar]
- 15.Gladman D, Rigby W, Azevedo VF, et al. Tofacitinib for psoriatic arthritis in patients with an inadequate response to TNF inhibitors. N Engl J Med. 2017;377(16):1525-36. [DOI] [PubMed] [Google Scholar]
- 16.Xeljanz (tofacitinib) tablets, for oral use. Pfizer Inc. 2019. Available at: http://labeling.pfizer.com/ShowLabeling.aspx?id=959. Accessed March 25, 2020. [Google Scholar]
- 17.Briggs A, Sculpher M, Claxton K.. Decision Modelling for Health Economic Evaluation. Oxford, England: Oxford University Press; 2006. [Google Scholar]
- 18.Humira (adalimumab) injection, for subcutaneous use. AbbVie Inc. 2020. Available at: https://www.rxabbvie.com/pdf/humira.pdf. Accessed March 25, 2020.
- 19.Enbrel (etanercept) injection, for subcutaneous use. Amgen Inc. 2020. Available at: https://www.pi.amgen.com/~/media/amgen/repositorysites/pi-amgen-com/enbrel/enbrel_pi.pdf. Accessed March 25, 2020.
- 20.Otezla (apremilast) tablets, for oral use. Amgen. 2020. Available at: http://www.otezla.com/otezla-prescribing-information.pdf. Accessed March 25, 2020.
- 21.Cosentyx (secukinumab) injection, for subcutaneous use. Novartis. 2020. Available at: http://www.pharma.us.novartis.com/product/pi/pdf/cosentyx.pdf. Accessed March 25, 2020.
- 22.Lamba M, Wang R, Fletcher T, Alvey C, Kushner J, Stock TC.. Extended-release once-daily formulation of tofacitinib: evaluation of pharmacokinetics compared with immediate-release tofacitinib and impact of food. J Clin Pharmacol. 2016;56(11):1362-71. [DOI] [PMC free article] [PubMed] [Google Scholar]
- 23.Lamba M, Hutmacher MM, Furst DE, et al. Model-informed development and registration of a once-daily regimen of extended-release tofacitinib. Clin Pharmacol Ther. 2017;101(6):745-53. [DOI] [PMC free article] [PubMed] [Google Scholar]
- 24.Wells AF, Edwards CJ, Kivitz AJ, et al. Apremilast monotherapy in DMARD-naive psoriatic arthritis patients: results of the randomized, placebo-controlled PALACE 4 trial. Rheumatology (Oxford). 2018;57(7):1253-63. [DOI] [PMC free article] [PubMed] [Google Scholar]
- 25.Claxton L, Jenks M, Taylor M, et al. An economic evaluation of tofacitinib treatment in rheumatoid arthritis: modeling the cost of treatment strategies in the United States. J Manag Care Spec Pharm. 2016;22(9):1088-102. Available at: https://www.jmcp.org/doi/10.18553/jmcp.2016.22.9.1088. [DOI] [PMC free article] [PubMed] [Google Scholar]
- 26.Databank First. AnalySource. 2018. Available at: https://www.analysource.com/. Accessed January 4, 2018.
- 27.InGauge Healthcare Solutions. Physicians’ Fee & Coding Guide 2015. Atlanta, GA: InGauge Health Solutions; March 2015. [Google Scholar]
- 28.Singh JA, Saag KG, Bridges SL Jr, et al. 2015 American College of Rheumatology guideline for the treatment of rheumatoid arthritis. Arthritis Rheumatol. 2016;68(1):1-26. [DOI] [PubMed] [Google Scholar]
- 29.Agency for Healthcare Research and Quality. HCUPnet, Healthcare Cost and Utilization Project. 2014 national statistics - principal diagnosis only. By payer for “private insurance.” 2014. Available at: http://hcupnet.ahrq.gov/. Accessed March 25, 2020.
- 30.Truven Health Analytics, IBM Watson Health. Micromedex RED BOOK Online. Database. Available at: http://truvenhealth.com/Products/Micromedex/Product-Suites/Clinical-Knowledge/RED-BOOK. Accessed December 10, 2018.
- 31.Claxton L, Taylor M, Gerber RA, et al. Modelling the cost-effectiveness of tofacitinib for the treatment of rheumatoid arthritis in the United States. Curr Med Res Opin. 2018;34(11):1991-2000. [DOI] [PubMed] [Google Scholar]
- 32.Claxton L, Taylor M, Soonasra A, Bourret JA, Gerber RA.. An economic evaluation of tofacitinib treatment in rheumatoid arthritis after methotrexate or after 1 or 2 TNF inhibitors from a U.S. payer perspective. J Manag Care Spec Pharm. 2018;24(10):1010-17. Available at: https://www.jmcp.org/doi/10.18553/jmcp.2018.17220. [DOI] [PMC free article] [PubMed] [Google Scholar]
- 33.Fagerli KM, Kearsley-Fleet L, Watson KD, et al. Long-term persistence of TNF-inhibitor treatment in patients with psoriatic arthritis. Data from the British Society for Rheumatology Biologics Register. RMD Open. 2018;4(1):e000596. [DOI] [PMC free article] [PubMed] [Google Scholar]
- 34.Kavanaugh A, McInnes IB, Mease PJ, et al. Clinical efficacy, radiographic and safety findings through 2 years of golimumab treatment in patients with active psoriatic arthritis: results from a long-term extension of the randomised, placebo-controlled GO-REVEAL study. Ann Rheum Dis. 2013;72(11):1777-85. [DOI] [PMC free article] [PubMed] [Google Scholar]
- 35.Kavanaugh A, McInnes IB, Mease P, et al. Clinical efficacy, radiographic and safety findings through 5 years of subcutaneous golimumab treatment in patients with active psoriatic arthritis: results from a long-term extension of a randomised, placebo-controlled trial (the GO-REVEAL study). Ann Rheum Dis. 2014;73(9):1689-94. [DOI] [PMC free article] [PubMed] [Google Scholar]
- 36.Iskandar IYK, Warren RB, Lunt M, et al. Differential drug survival of second-line biologic therapies in patients with psoriasis: observational cohort study from the British Association of Dermatologists Biologic Interventions Register (BADBIR). J Invest Dermatol. 2018;138(4):775-84. [DOI] [PMC free article] [PubMed] [Google Scholar]
- 37.Egeberg A, Ottosen MB, Gniadecki R, et al. Safety, efficacy and drug survival of biologics and biosimilars for moderate-to-severe plaque psoriasis. Br J Dermatol. 2018;178(2):509-19. [DOI] [PubMed] [Google Scholar]
- 38.Warren RB, Smith CH, Yiu ZZ, et al. Differential drug survival of biologic therapies for the treatment of psoriasis: a prospective observational cohort study from the British Association of Dermatologists Biologic Interventions Register (BADBIR). J Invest Dermatol. 2015;135(11):2632-40. [DOI] [PubMed] [Google Scholar]
- 39.Davila-Seijo P, Dauden E, Carretero G, et al. Survival of classic and biological systemic drugs in psoriasis: results of the BIOBADADERM registry and critical analysis. J Eur Acad Dermatol Venereol. 2016;30(11):1942-50. [DOI] [PubMed] [Google Scholar]
- 40.Sakai R, Tanaka M, Nanki T, et al. Drug retention rates and relevant risk factors for drug discontinuation due to adverse events in rheumatoid arthritis patients receiving anticytokine therapy with different target molecules. Ann Rheum Dis. 2012;71(11):1820-26. [DOI] [PubMed] [Google Scholar]
- 41.Ebina K, Hashimoto M, Yamamoto W, et al. Drug retention and discontinuation reasons between seven biologics in patients with rheumatoid arthritis - the ANSWER cohort study. PLoS One. 2018;13(3):e0194130. [DOI] [PMC free article] [PubMed] [Google Scholar]
- 42.Kondo M, Yamada H.. Drug survival rates of biological disease-modifying antirheumatic drugs and Janus kinase-inhibitor therapy in 801 rheumatoid arthritis patients: a 14 year-retrospective study from a rheumatology clinic in Japan. Mod Rheumatol. 2019;29(6):928-35. [DOI] [PubMed] [Google Scholar]
- 43.Glintborg B, Ostergaard M, Krogh NS, et al. Clinical response, drug survival, and predictors thereof among 548 patients with psoriatic arthritis who switched tumor necrosis factor alpha inhibitor therapy: results from the Danish Nationwide DANBIO Registry. Arthritis Rheum. 2013;65(5):1213-23. [DOI] [PubMed] [Google Scholar]
- 44.Harrold LR, Stolshek BS, Rebello S, et al. Impact of prior biologic use on persistence of treatment in patients with psoriatic arthritis enrolled in the U.S. Corrona registry. Clin Rheumatol. 2017;36(4):895-901. [DOI] [PubMed] [Google Scholar]
- 45.Cawson MR, Mitchell SA, Knight C, et al. Systematic review, network meta-analysis and economic evaluation of biological therapy for the management of active psoriatic arthritis. BMC Musculoskelet Disord. 2014;15:26. [DOI] [PMC free article] [PubMed] [Google Scholar]
- 46.D’Angiolella LS, Cortesi PA, Lafranconi A, et al. Cost and cost effectiveness of treatments for psoriatic arthritis: a systematic literature review. Pharmacoeconomics. 2018;36(5):567-89. [DOI] [PubMed] [Google Scholar]