

Abstract
BACKGROUND:
Over the past 12 years, 43 states and Washington DC have implemented oral anticancer medication parity laws in response to the burden of pharmacy cost sharing. Parity laws are designed to provide equal coverage and cost sharing between orally and parenterally administered anticancer medications for patients in commercial, fully insured health plans (FIHPs). However, there is considerable state-level variation in the requirements to achieve compliance with parity laws, and the clinical and economic effectiveness of parity is not fully known.
OBJECTIVES:
To (a) understand the impact of parity laws on out-of-pocket (OOP) spending and adherence to tyrosine kinase inhibitors (TKI) among commercially insured patients with chronic myeloid leukemia (CML) and (b) compare these effects across states with and without per prescription or per 30-day OOP spending limits as part of their parity laws.
METHODS:
Patients aged 18-64 years with CML, at least 1 pharmacy claim for a TKI, and residence in a state that implemented oral anticancer parity legislation between January 1, 2007, and January 1, 2017, were identified from the IBM MarketScan Commercial Claims and Encounters database. A propensity score-weighted difference-in-difference approach was used to measure the impact of parity on OOP spending and adherence in the 6 months after the first pharmacy claim for a TKI (index date) for patients enrolled in FIHPs (subject to parity) and self-funded health plans (SFHPs; exempt from parity). OOP spending was standardized to a 30-day equivalent amount and adjusted to 2017 US dollars. Adherence was assessed using the proportion of days covered (PDC), and patients were categorized as adherent with PDC ≥ 0.80.
RESULTS:
Of 1,887 patients initiating a TKI before or after their state’s parity law, 678 (35.9%) were enrolled in FIHPs (480 before vs 198 after parity), and 1,209 (64.1%) were enrolled in SFHPs (688 before vs 521 after parity). Implementation of parity laws was not associated with any changes in mean OOP spending; however, it was associated with a reduced likelihood of paying $0 per 30 days across all states (adjusted difference-in-difference [aDD] OR = 0.662; 95% CI = 0.535-0.820) and states without OOP spending limits (aDD OR = 0.654; 95% CI = 0.508-0.848), but not in states with limits. Nonsignificant but directionally opposite changes at each end of the OOP spending distribution were observed for states with and without OOP spending limits, with increased spending observed at the 75th, 90th, and 95th percentiles in states without limits. Mean PDC and adherence showed a nonsignificant increase among FIHP and SFHP patients across all states, states with limits, and states without limits.
CONCLUSIONS:
Oral anticancer parity laws are not associated with reduced OOP spending or improved adherence in a commercially insured sample of patients with CML. These findings were consistent for states that included OOP spending limits as a component of their parity laws.
What is already known about this subject
Oral chemotherapy parity laws have been put into place by states to provide equity in the cost to patients and access to oral chemotherapies compared with intravenous treatments.
These parity laws have been associated with various changes in out-of-pocket spending for tyrosine kinase inhibitors used for chronic myeloid leukemia but not medication adherence.
What this study adds
This study builds on previous literature by using data from a large, varied sample of insurers and examining the impact of state variability in parity laws.
In this sample (N = 1,887), parity laws had little to no impact on reducing out-of-pocket spending or improving adherence for patients taking tyrosine kinase inhibitors for chronic myeloid leukemia. The number of patients paying $0 for their prescriptions increased, but cost increases were observed for those with the highest costs in quantile regression results.
It is likely that oral chemotherapy parity laws will need additional protections or standardization at the federal level to be effective at reducing patient costs and increasing adherence.
In the early 2000s, clinical trials showed that imatinib improved 5-year overall survival from 57% to 89% in patients with Philadelphia chromosome-positive chronic myeloid leukemia (CML), dramatically improving on historical parenteral chemotherapy.1,2 Besides its novel mechanism as a tyrosine kinase inhibitor (TKI), imatinib was also one of the earliest orally administered and targeted anticancer medications.3 Since the early 2000s, orally administered anticancer medications have increasingly served as a component of cancer treatment plans,4 and they provide a variety of benefits to patients: less pain and discomfort, a greater sense of involvement in therapy, and less interference with daily routine.5 However, these medications are also expensive; for example, monthly costs of treatment for CML as of April 2020 approached $15,000 for second-generation TKIs.6
The economic impact of TKI use in CML is an important topic, since patients receive continuous treatment with long-term financial burden. For patients, out-of-pocket (OOP) costs pose a significant barrier to using orally administered anticancer medications. In recent years, patient OOP payments at the pharmacy counter have grown rapidly, with coinsurance spending increasing by 67% and deductible spending increasing by 176% between 2006 and 2016.7 These cumulative changes have produced extraordinary OOP costs, causing patients with cancer to alter their lifestyle and ration anticancer medications.8-10 This is especially concerning when considering the setting of CML, where previous research has shown that adherence to TKIs is associated with early response milestones.11
In 2008, Oregon implemented the first US oral anticancer parity law as an effort to reduce the financial burden for patients taking these medications.12 Subsequently, from 2008 to 2019, 43 states and Washington DC followed Oregon in enacting parity laws (Table 1 and Supplementary Materials (565.6KB, pdf) , available in online article). At a minimum, these 44 laws require private, fully insured health plans (FIHPs) to provide orally administered anticancer medications at coverage no less favorable than that for parenteral therapies, including those provider-administered therapies given intravenously, intramuscularly, or subcutaneously. However, state parity laws do not apply to Medicare or Medicaid plans, which are regulated at the federal level by the Employee Retirement Income Security Act of 1974, or to private, self-funded health plans (SFHPs). Further, the current oral anticancer parity law landscape represents a patchwork of attempts to improve access to orally administered anticancer therapies, since there is significant state-level variation in the legal requirements. For example, 34 states prohibit increasing the cost-sharing amount for parenteral options to achieve compliance, and only 11 states require that orally administered anticancer medications be covered below a certain threshold of OOP spending, most commonly $100-$300 per prescription or per 30 days of medication supplied.13
TABLE 1.
Summary of State Parity Laws
| State | Date effective | Cost share less thana | Deductible includedb | Max OOPc | High deductibled | State | Date effective | Cost share less thana | Deductible includedb | Max OOPc | High deductibled |
|---|---|---|---|---|---|---|---|---|---|---|---|
| AL | No parity law implemented | MT | No parity law implemented | ||||||||
| AK | 01/01/16 | ✓ | ✓ | NE | 10/01/12 | ✓ | |||||
| AZ | 01/01/16 | ✓ | ✓ | NV | 01/01/15 | $100/Rx | |||||
| AR | 01/01/18 | ✓ | ✓ | NH | 01/01/17 | ✓ | ✓ | $200/Rx | ✓ | ||
| CA | 01/01/15 | $250/30 days | ✓ | NJ | 07/16/12 | ✓ | ✓ | ||||
| CO | 01/01/11 | ✓ | NM | 06/17/11 | ✓ | ✓ | |||||
| CT | 01/01/11 | NY | 01/01/12 | ||||||||
| DE | 01/01/13 | NC | No parity law implemented | ||||||||
| FL | 07/01/14 | ND | 08/01/15 | ✓ | ✓ | ||||||
| GA | 01/01/15 | $200/Rx | OH | 01/01/15 | $100/Rx | ✓ | |||||
| HI | 01/01/10 | ✓ | ✓ | OK | 11/01/13 | ✓ | ✓ | $100/Rx | |||
| ID | No parity law implemented | OR | 01/01/08 | ||||||||
| IL | 01/01/12 | PA | 01/01/16 | ✓ | |||||||
| IN | 01/01/10 | RI | 01/01/14 | ||||||||
| IA | 07/01/09 | SC | No parity law implemented | ||||||||
| KS | 04/01/10 | SD | 01/01/16 | ||||||||
| KY | 01/01/15 | ✓ | ✓ | $100/30 days | ✓ | TN | No parity law implemented | ||||
| LA | 01/01/13 | $100/Rx | TX | 09/01/11 | ✓ | ||||||
| ME | 01/01/15 | UT | 10/01/13 | $300/Rx | |||||||
| MD | 10/01/12 | VT | 04/01/10 | ||||||||
| MA | 01/01/13 | VA | 07/01/12 | ||||||||
| MI | No parity law implemented | WA | 01/01/12 | ||||||||
| MN | 05/14/10 | ✓ | ✓ | WV | 01/01/16 | ✓ | |||||
| MS | 07/01/15 | ✓ | ✓ | WI | 01/01/15 | ✓ | ✓ | $100/30 days | ✓ | ||
| MO | 01/01/15 | ✓ | ✓ | $75/30 days | ✓ | WY | 07/01/15 | ✓ | ✓ | ||
Notes: ✓ = included in state parity legislation. Sources for each state’s parity laws are available in Supplementary Tables 2 and 3 (565.6KB, pdf) (available in online article).
aCost share less than = copayment or coinsurance for orally administered anticancer medications must be equal to or less than parenteral anticancer medications.
bDeductible included = deductible included in definition of cost sharing.
cMax OOP = state parity legislation includes a maximum OOP for orally administered anticancer medications.
dHigh deductible = state parity legislation requires patients to meet their deductibles before parity legislation applies.
OOP = out-of-pocket; Rx = prescription.
Recent research has shown that oral anticancer parity laws improve use of these medications and decrease OOP spending for some patients, without increasing total health care spending.14 However, the outcomes reported to date represent a blended sample of state parity laws with various requirements. As such, it is unknown whether some types of parity laws are more effective than others, and key learnings have potential to drive reform and improve economic outcomes in patients receiving oral anticancer therapy.
In addition, data on the effects of parity laws on oral anticancer medication adherence are conflicting. Comparing states with and without parity between 2008 and 2013, Chin et al found that copayments for oral endocrine therapies for breast cancer decreased for low baseline spenders after parity and that a higher monthly copayment was directly associated with risk of nonadherence.15 However, in a more recent analysis of patients initiating oral anticancer medication for CML or multiple myeloma, parity had no effect on adherence or discontinuation.16 Because of the expansive and well-established use of oral medications in CML, we sought to add to the extent of the literature regarding the clinical and economic effects of parity legislation for patients with CML and evaluate how these effects might differ in states, including per prescription or per 30-day OOP spending limits as a component of their parity laws.
Methods
DATA SOURCE
This study used the integrated health care claims data from the IBM MarketScan Commercial Claims and Encounters database during the period from January 1, 2007, to December 31, 2017. The database consists of employer- and health plan-sourced data containing medical and drug claims for up to 50 million individuals annually. Enrollees are employees, Medicare-eligible retirees, and their dependents insured by employer-sponsored benefit plans. Health care for these individuals is provided under a variety of fee-for-service, fully capitated, and partially capitated health plans, including preferred and exclusive provider organizations (PPOs and EPOs), point of service (POS) plans, and health maintenance organizations (HMOs).
The database includes detailed payments (employer and patient OOP spending), use, and outcomes data for health care services performed as inpatient and outpatient services, prescription drug claims (retail and mail order), and information on patient enrollment. Use of these data for research purposes was approved as exempt by the University of Florida Institutional Review Board.
STUDY DESIGN
A retrospective cohort design using a difference-in-differences analytic approach was used to assess monthly OOP cost sharing and TKI adherence for adult patients with CML residing in states that implemented oral anticancer parity legislation between January 1, 2007, and January 1, 2017. Patients were categorized and assessed according to their status of coverage within an FIHP or SFHP, as well as the assessment window that occurred either before or after parity legislation. Patient outcomes were assessed as the interaction between health plan type and time period (ie, through difference-in-differences estimation). Patients who initiated oral anticancer therapy before parity and continued after the parity implementation date were excluded from the analysis. Additionally, a 180-day implementation period after state adoption of the law was required for individuals considered in the period after implementation, allowing for a lag period in the plans’ adoption of new policies within the state regarding the law. All patients were followed for 180 days from the date of their first pharmacy claim for an oral TKI. The study design is illustrated in Supplementary Figure 1 (565.6KB, pdf) (available in online article).
COHORT SELECTION
Patients were selected using International Classification of Diseases, Ninth/Tenth Revision, Clinical Modification codes (Supplementary Table 1 (565.6KB, pdf) , available in online article). Patients were identified as those with a CML diagnosis who were new users of any of the following TKIs as identified by National Drug Code numbers (Supplementary Table 1 (565.6KB, pdf) ): bosutinib, dasatinib, imatinib, nilotinib, and ponatinib. The date of the first observed TKI claim was considered the index date. We excluded patients aged younger than 18 years and older than 64 years, those with acute lymphoid leukemia, patients without continuous health plan enrollment from 3 months before through 6 months after their index date, patients whose first TKI claim indicated a copayment or coinsurance amount less than $0 (representing possible data entry errors), patients with missing beneficiary state residence location, and patients with missing insurance plan type.
OUTCOMES
Outcomes of interest included TKI adherence and OOP spending (standardized to 30 days) among patients before and after parity implementation. The proportion of days covered (PDC) in the 180 days after the index date was used to measure adherence. PDC was calculated by dividing the total number of days that a patient had a medication by this 6-month follow-up period, allowing for within-class medication switches (to any other TKI) to avoid possible overestimation of nonadherence. Patients were categorized into various adherence levels based on PDC (ie, PDC ≥ 0.80, PDC ≥ 0.85, and PDC ≥ 0.90).
Mean and quantile OOP spending was calculated by summing copayments, coinsurance, and deductibles paid by the patient; this value was then standardized to a 30-day fill-equivalent price by dividing the total payments by the total days supplied during the 180-day follow-up period. The proportions of patients with OOP spending of $0 and at least $100 were also evaluated. OOP spending was inflated using the pharmaceutical component of the Personal Consumption Expenditures Price Index to 2017 US dollars. Since previous literature has established nonlinear changes in costs associated with parity,14 the distribution of patient spending at the 25th, 50th, 75th, 90th, and 95th percentiles was calculated.
STATISTICAL ANALYSIS
This analysis used a difference-in-differences approach to compare FIHPs with SFHPs as a control. The difference-in-differences approach is well suited for measuring the effects of policy change that may be confounded by concurrent effects over time.17 To balance or control for observed differences in baseline characteristics between patients of FIHPs and SFHPs, a weighted difference-in-differences model was used.17
Propensity scores were estimated by modeling the probability of a patient having an FIHP vs SFHP as a function of baseline characteristics.18,19 The propensity score was created as a function of the following baseline variables measured in the 3 months before the patient’s index date: patient age (continuous), sex, geographic region, and insurance type (PPO or other). We also included 2 measures of health care use and comorbidity during the 3 months before TKI initiation: weighted Elixhauser comorbidity score and the unique number of prescription medications used preceding treatment initiation.
Next, a stabilized inverse probability of treatment weight was created by multiplying the inverse probability of treatment weights by the marginal prevalence of the treatment actually received for each patient.20,21 This approach estimated the inverse of the probability of being enrolled in an FIHP among privately insured patients vs SFHP, which should balance those measured covariates between these groups.
OOP spending was estimated using quantile regression to assess the changes in the distribution of patient spending at the 25th, 50th, 75th, 90th, and 95th percentiles.22,23 Additionally, linear regression was used for estimating mean OOP spending, and logistic regression was used to estimate the probability of paying a 30-day standardized OOP cost of $0, as well as paying more/less than $100.
Similarly, linear and logistic regression were used to estimate the mean PDC and the probability of achieving various levels of adherence based on various PDC thresholds (ie, ≥ 0.80, ≥ 0.85, and ≥ 0.90). Adherence and OOP spending were estimated unadjusted as well as adjusted after propensity score-weighted difference-in-differences risk ratios and 95% CIs were calculated. Statistical tests were 2-sided with P < 0.05 indicative of statistical significance.
Results
Demographic and clinical characteristics of the 1,887 identified patients with CML in FIHPs and SFHPs who initiated TKIs before or after their state’s implementation of parity are presented in Table 2. Patient attrition is depicted in Supplementary Figure 2 (565.6KB, pdf) (available in online article). We identified 678 patients in FIHPs (480 before parity, 198 after parity) and 1,209 in SFHPs (688 before parity, 521 after parity). Patients residing in a state implementing a parity law that specified a per prescription or per 30-day limit on OOP spending comprised 38% of the sample (n = 717). The sample was well balanced regarding most covariates before and after parity. Patients were commonly enrolled in EPOs/PPOs and HMOs except for patients enrolled in SFHPs after parity, who commonly selected EPOs/PPOs and high-deductible health plans. Additionally, patients in FIHPs and SFHPs were more likely to initiate index treatment with brand or generic imatinib relative to other TKIs before parity (FIHPs, 72.5%; SFHPs, 72.8%) than they were after parity (FIHPs, 40.4%; SFHPs, 38.6%).
TABLE 2.
Baseline Demographic and Clinical Characteristics in the 3 Months Before Index Date
| Before parity | After parity | |||
|---|---|---|---|---|
| FIHPs (n = 480) | SFHPs (n = 688) | FIHPs (n = 198) | SFHPs (n = 521) | |
| Age, mean (SD) | 48.3 (10.3) | 49.0 (11.6) | 47.5 (11.7) | 47.8 (11.2) |
| Sex, n (%) | ||||
| Male | 257 (53.5) | 386 (56.1) | 98 (49.5) | 290 (55.6) |
| Female | 223 (46.5) | 302 (43.9) | 100 (50.5) | 231 (44.3) |
| Geographic region, n (%) | ||||
| Northeast | 66 (13.8) | 95 (13.8) | 41 (20.7) | 114 (21.9) |
| North Central | 133 (27.7) | 119 (17.3) | 40 (20.2) | 102 (19.6) |
| South | 193 (40.2) | 287 (41.7) | 98 (49.5) | 207 (39.7) |
| West | 88 (18.3) | 187 (27.2) | 19 (9.6) | 98 (18.8) |
| Health plan type, n (%) | ||||
| Comprehensive | 4 (0.8) | 23 (3.3) | 0 (0) | 16 (3.1) |
| EPO/PPO | 349 (72.7) | 384 (55.8) | 140 (70.7) | 333 (63.9) |
| HMO | 69 (14.4) | 147 (21.4) | 23 (11.6) | 34 (6.5) |
| POS/POS with capitation | 30 (6.3) | 81 (11.8) | 28 (14.1) | 37 (7.1) |
| CDHP/HDHP | 28 (5.8) | 53 (7.7) | 7 (3.5) | 101 (19.4) |
| Number of IP visits, mean (SD) | 1.1 (3.0) | 1.1 (3.0) | 1.0 (3.2) | 1.1 (3.0) |
| Number of OP visits, mean (SD) | 6.5 (4.8) | 7.4 (5.9) | 7.0 (4.8) | 7.2 (5.3) |
| Overall number of medications, mean (SD) | 6.1 (7.2) | 6.3 (6.7) | 6.5 (7.5) | 5.9 (6.4) |
| Weighted Elixhauser score, mean (SD) | 2.4 (5.4) | 2.1 (4.6) | 2.5 (5.7) | 2.4 (5.0) |
| Index treatment agent, n (%) | ||||
| Bosutinib | 2 (0.4) | 0 (0) | 1 (0.5) | 4 (0.8) |
| Dasatinib | 78 (16.3) | 114 (16.6) | 79 (39.9) | 215 (41.3) |
| Imatinib mesylate | 348 (72.5) | 501 (72.8) | 80 (40.4) | 201 (38.6) |
| Nilotinib hydrochloride | 52 (10.8) | 72 (10.5) | 37 (18.7) | 100 (19.2) |
| Ponatinib hydrochloride | 0 (0) | 1 (0.2) | 1 (0.5) | 1 (0.2) |
| Year of index treatment, n (%) | ||||
| 2007 | 36 (7.5) | 66 (9.6) | 0 (0) | 0 (0) |
| 2008 | 70 (14.6) | 88 (12.8) | 1 (0.5) | 0 (0) |
| 2009 | 96 (20.0) | 125 (18.2) | 0 (0) | 2 (0.4) |
| 2010 | 85 (17.7) | 84 (12.2) | 3 (1.5) | 0 (0) |
| 2011 | 70 (14.6) | 105 (15.3) | 8 (4.0) | 9 (1.7) |
| 2012 | 49 (10.2) | 68 (9.9) | 26 (13.1) | 40 (7.7) |
| 2013 | 41 (8.5) | 96 (14.0) | 35 (17.7) | 74 (14.2) |
| 2014 | 28 (5.8) | 46 (6.7) | 41 (20.7) | 65 (12.5) |
| 2015 | 5 (1.0) | 7 (1.0) | 37 (18.7) | 97 (18.6) |
| 2016 | 0 (0) | 3 (0.4) | 39 (19.7) | 158 (30.3) |
| 2017 | 0 (0) | 0 (0) | 8 (4.0) | 76 (14.6) |
| Residing in state specifying limit on OOP spending as component of parity, n (%) | ||||
| No | 276 (57.5) | 338 (49.1) | 145 (73.2) | 411 (78.9) |
| Yes | 204 (42.5) | 350 (50.9) | 53 (26.8) | 110 (21.1) |
CDHP = consumer-driven health plan; EPO = exclusive provider organization; FIHP = fully insured health plan; HDHP = high-deductible health plan; IP = inpatient; OOP = out-of-pocket; OP = outpatient; POS = point-of-service; PPO = preferred provider organization; SFHP = self-funded health plan.
OOP SPENDING
Average OOP spending on oral TKIs per 30 days was similar in FIHPs and SFHPs before parity (Table 3). After parity, mean OOP spending increased from $132 to $241 in FIHPs and from $108 to $173 in SFHPs. After adjustment for baseline covariates, the increase in mean OOP spending in FIHPs relative to SFHPs was nonsignificant ($34; 95% CI = −$38-$106). When the spending distributions were assessed at various percentiles, nonsignificant savings associated with parity were observed except for patients with OOP spending at the 75th percentile of the spending distribution; these patients experienced a nonsignificant increase in expenses. While the probability of paying $0 per 30 days increased in SFHPs and FIHPs, the larger increase among members of SFHPs drove the finding that parity was associated with a significantly reduced likelihood of paying $0 per 30 days (adjusted difference-in-difference odds ratio [aDD OR] = 0.662; 95% CI = 0.535-0.820). There was no association between parity and a change in the likelihood of spending at least $100 per 30 days (aDD OR = 1.064; 95% CI = 0.943-1.190).
TABLE 3.
Out-of-Pocket Spending Per 30 Days Among Patients in FIHPs and SFHPs Before and After Parity
| FIHPs | SFHPs | Unadjusted DD | Adjusted DD | |||||
|---|---|---|---|---|---|---|---|---|
| Before parity | After parity | Before parity | After parity | DD | 95% CI | aDDa | 95% CIa | |
| Overall, N | 480 | 198 | 688 | 521 | – | – | – | – |
| Mean (SD) | $132 ($346) | $241 ($777) | $108 ($241) | $173 ($369) | $44 | −$34-$123 | $34 | −$38-$106 |
| 25th percentile | $18 | $5 | $24 | $19 | −$8 | −$18-$1 | −$4 | −$15-$6 |
| 50th percentile | $33 | $38 | $38 | $53 | −$11 | −$21-$0 | −$6 | −$16-$4 |
| 75th percentile | $63 | $112 | $85 | $112 | $21 | −$9-$52 | $27 | −$5-$58 |
| 90th percentile | $298 | $571 | $204 | $505 | −$23 | −$355-$308 | −$105 | −$424-$215 |
| 95th percentile | $809 | $945 | $492 | $948 | −$319 | −$953-$316 | −$204 | −$833-$425 |
| $0 | 15.6% | 23.2% | 1.3% | 13.4% | 0.609 | 0.498-0.752 | 0.662 | 0.535-0.820 |
| ≥ $100 | 16.9% | 27.8% | 20.1% | 30.5% | 1.020 | 0.909-1.149 | 1.064 | 0.943-1.190 |
| States with limit, n | 204 | 53 | 350 | 110 | – | – | – | – |
| Mean (SD) | $141 ($324) | $131 ($239) | $112 ($235) | $224 ($412) | −$123 | −$234-−$12 | −$86 | −$198-$26 |
| 25th percentile | $22 | $28 | $23 | $28 | $1 | −$14-$16 | $8 | −$5-$22 |
| 50th percentile | $33 | $50 | $34 | $72 | −$19 | −$50-$12 | −$13 | −$46-$20 |
| 75th percentile | $66 | $103 | $72 | $156 | −$44 | −$165-$77 | $0 | −$102-$103 |
| 90th percentile | $423 | $296 | $251 | $545 | −$421 | −$1,026-$183 | −$275 | −$839-$290 |
| 95th percentile | $890 | $485 | $605 | $1,162 | −$962 | −$2,219-$294 | −$780 | −$2,268-$707 |
| $0 | 8.8% | 3.8% | 0.9% | 2.7% | 0.595 | 0.342-1.031 | 0.602 | 0.346-1.053 |
| ≥ $100 | 20.1% | 28.3% | 19.4% | 40.0% | 0.870 | 0.704-1.064 | 0.935 | 0.746-1.163 |
| States without limit, n | 276 | 145 | 338 | 411 | – | – | – | – |
| Mean (SD) | $125 ($348) | $282 ($894) | $104 ($247) | $160 ($357) | $101 | −$6-$209 | $71 | −$25-$167 |
| 25th percentile | $15 | $0 | $26 | $15 | −$3 | −$14-$8 | −$7 | −$17-$2 |
| 50th percentile | $34 | $33 | $50 | $50 | −$1 | −$14-$13 | −$1 | −$15-$13 |
| 75th percentile | $63 | $114 | $91 | $108 | $34 | −$2-$70 | $35 | −$1-$71 |
| 90th percentile | $264 | $668 | $164 | $463 | $105 | −$281-$492 | $124 | −$314-$561 |
| 95th percentile | $686 | $1,049 | $408 | $929 | −$158 | −$1,011-$694 | $150 | −$528-$828 |
| $0 | 20.7% | 30.3% | 1.8% | 16.3% | 0.629 | 0.493-0.800 | 0.654 | 0.508-0.848 |
| ≥ $100 | 14.5% | 27.6% | 20.7% | 28.0% | 1.111 | 0.952-1.282 | 1.124 | 0.971-1.299 |
Notes: Linear regression was used for estimating mean OOP spending. Logistic regression was used to estimate the probability of paying a 30-day standardized OOP cost of $0, as well as paying more than $100.
aBolded values denote statistical significance of the interaction term with P <0.05.
aDD = adjusted difference-in-differences; DD = difference-in-differences; FIHP = fully insured health plan; OOP = out-of-pocket; SFHP = self-funded health plan.
Nonsignificant but directionally opposite changes at the lower and higher ends of the spending distribution were observed for parity laws with vs without per prescription or per 30-day OOP spending limits. In states with an OOP spending limit, mean OOP spending decreased from $141 to $131 in FIHPs but increased from $112 to $224 in SFHPs. In states without a limit, mean OOP spending increased across FIHPs and SFHPs, from $125 to $282 and from $104 to $160, respectively. After adjustment for baseline covariates, the differences observed with parity in each subgroup were not statistically significant. Changes associated with parity also differed directionally at the 25th, 90th, and 95th percentiles.
Similar to the results for all parity laws, a reduced likelihood of paying $0 per 30 days was observed for patients in FIHPs relative to those in SFHPs before vs after parity, although statistical significance was observed only for states without limits (aDD OR = 0.654; 95% CI = 0.508-0.848). On the other hand, nonsignificant, directionally opposite associations were observed for the likelihood of paying at least $100 per 30 days, with a signal of potential savings for parity laws with limits (Table 3).
ADHERENCE
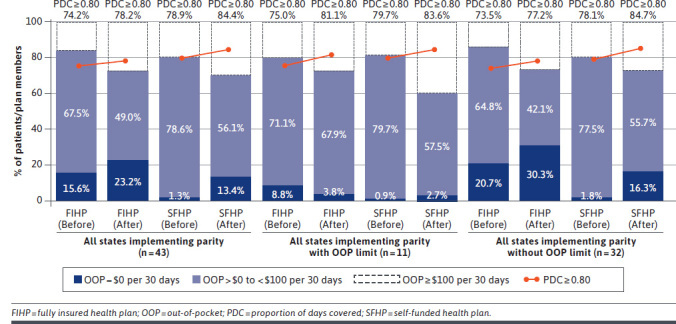
Across all analyses, there was no association of parity with adherence (Table 4 and Figure 1). Considering all states that implemented parity, point estimates for mean adherence to oral TKIs were consistently higher in SFHPs than in FIHPs before parity implementation. For FIHPs across all states, mean PDC increased from 0.85 before parity to 0.87 after parity. Similarly, mean PDC in SFHPs increased from 0.87 to 0.90 (aDD OR = −0.01; 95% CI = −0.03-0.01). The proportion of patients characterized as adherent (ie, PDC ≥ 0.80) increased from 74.2% to 78.2% in FIHPs and from 78.9% to 84.4% in SFHPs (aDD OR = 0.97; 95% CI = 0.86-1.10).
TABLE 4.
Adherence to Oral TKIs Among Patients in FIHPs and SFHPs Before and After Parity
| FIHPs | SFHPs | Unadjusted DD | Adjusted DD | |||||
|---|---|---|---|---|---|---|---|---|
| Before parity | After parity | Before parity | After parity | DD | 95% CI | aDD | 95% CI | |
| Overall, N | 480 | 198 | 688 | 521 | – | – | – | – |
| PDC, median (Q1, Q3) | 0.96 (0.79, 1.00) | 0.98 (0.89, 1.00) | 0.98 (0.83, 1.00) | 0.98 (0.89, 1.00) | – | – | – | – |
| PDC, mean (SD) | 0.85 (0.22) | 0.87 (0.20) | 0.87 (0.21) | 0.90 (0.17) | −0.01 | (−0.03-0.01) | −0.01 | (−0.03-0.01) |
| PDC ≥ 0.80 (%) | 74.2% | 78.2% | 78.9% | 84.4% | 0.96 | (0.85-1.09) | 0.97 | (0.86-1.10) |
| PDC ≥ 0.85 (%) | 69.2% | 73.2% | 73.6% | 78.3% | 0.94 | (0.82-1.09) | 1.00 | (0.90-1.13) |
| PDC ≥ 0.90 (%) | 63.1% | 66.2% | 67.7% | 72.5% | 0.95 | (0.85-1.06) | 0.93 | (0.84-1.04) |
| With limit, n | 204 | 53 | 350 | 110 | – | – | – | – |
| PDC, median (Q1, Q3) | 0.96 (0.80, 1.00) | 0.98 (0.86, 1.00) | 0.98 (0.83, 1.00) | 0.98 (0.87, 1.00) | – | – | – | – |
| PDC, mean (SD) | 0.85 (0.22) | 0.90 (0.16) | 0.88 (0.20) | 0.90 (0.17) | 0.02 | (−0.01-0.06) | 0.02 | (−0.01-0.06) |
| PDC ≥ 0.80 (%) | 75.0% | 81.1% | 79.7% | 83.6% | 1.02 | (0.81-1.30) | 1.02 | (0.80-1.31) |
| PDC ≥ 0.85 (%) | 69.6% | 75.5% | 73.1% | 78.2% | 1.01 | (0.81-1.25) | 1.05 | (0.84-1.31) |
| PDC ≥ 0.90 (%) | 62.3% | 71.7% | 67.4% | 70.0% | 1.08 | (0.88-1.32) | 1.10 | (0.89-1.36) |
| Without limit, n | 276 | 145 | 338 | 411 | – | – | – | – |
| PDC, median (Q1, Q3) | 0.96 (0.78, 1.00) | 0.95 (0.83, 1.00) | 0.98 (0.83, 1.00) | 0.98 (0.90, 1.00) | – | – | – | – |
| PDC, mean (SD) | 0.85 (0.22) | 0.86 (0.21) | 0.87 (0.22) | 0.90 (0.17) | −0.03 | (−0.06-0.00) | −0.03 | −0.05-0.00) |
| PDC ≥ 0.80 (%) | 73.5% | 77.2% | 78.1% | 84.7% | 0.94 | (0.81-1.10) | 0.96 | (0.83-1.11) |
| PDC ≥ 0.85 (%) | 68.8% | 72.4% | 74.0% | 78.4% | 0.98 | (0.86-1.13) | 1.00 | (0.87-1.15) |
| PDC ≥ 0.90 (%) | 63.8% | 64.1% | 68.1% | 75.9% | 0.91 | (0.80-1.04) | 0.90 | (0.79-1.02) |
Notes: Linear regression was used for estimating mean absolute changes in PDC. Logistic regression odds ratios are represented to estimate the probability of achieving levels of adherence based on various PDC (ie, ≥ 0.80, ≥ 0.85, ≥ 0.90).
aDD = adjusted difference-in-differences; DD = difference-in-differences; FIHP = fully insured health plan; PDC = proportion of days covered; SFHP = self-funded health plan.
FIGURE 1.
Out-of-Pocket Spending and Adherence Before and After Parity
The association of parity with adherence to oral TKIs for parity laws with vs without OOP limits differed directionally, similar to the results observed for OOP spending. While all results for adherence were nonsignificant, greater increases in PDC and the likelihood of adherence (ie, PDC ≥ 0.80) were observed for patients in FIHPs relative to those in SFHPs in states with OOP limits vs those without them as a component of parity. Results for each analysis were consistent across sensitivity analyses using higher PDC thresholds (ie, PDC ≥ 0.85, PDC ≥ 0.90) to determine adherence.
Discussion
Among commercially insured patients with CML, this study indicated that parity laws are not associated with changes in TKI-related OOP spending or adherence. In this analysis, we also presented novel subanalyses of parity laws, finding that the presence of a per prescription or per 30-day OOP limit may yield reduced OOP spending at high percentiles and nominally improved adherence at the expense of increasing spending at low percentiles. This is contrary to findings in states with parity laws lacking an OOP limit. Because of small sample sizes in the stratified subanalysis, further research is needed to confirm findings comparing parity laws with and without OOP limits.
Parity laws have been previously associated with a higher likelihood of paying $0 per month and lower monthly OOP spending below the 90th (among all cancers) or 95th (among only CML) percentiles.14,16 At the upper ends of the spending distribution, monthly OOP spending increased after parity implementation.14,16 We found that while patients enrolled in FIHPs had a greater likelihood of paying $0 per 30 days after parity laws a larger increase was observed by patients enrolled in SFHPs. OOP spending increased similarly in both groups. When analyzing OOP costs, a methodological difference of standardizing 180-day OOP spending (rather than per fill OOP spending) to 30 days provides a different view of parity compared with other studies but limited our ability to detect smaller changes in OOP spending. However, we also hypothesized that the increased number of payers in our sample, including the presence of regional payers, may hint at variation in payer responses to parity laws.
In addition, it is possible that some SFHPs may have voluntarily altered the structure of cost sharing for oral anticancer medications to align with changes intended by parity. Although SFHPs are not subject to some state insurance requirements, they maintain some risk for losses and thus may hold greater incentives to successfully manage care, contain costs, and improve outcomes such as medication adherence.24 An additional comparison to FIHPs in states without parity laws—such as that in another recent analysis, which showed that SFHPs did not modify their benefit design after implementation of OOP caps for specialty drugs25—may provide greater insight into this possibility.
The lack of an association between parity and adherence also confirms previous findings related to parity in this population but conflicts with broader analyses of adherence in patients with CML and with the effects of parity in other patient groups. In the previously mentioned analysis of parity among patients with CML, parity was not found to be associated with TKI adherence,16 although past work has demonstrated an elastic demand function for TKIs.26 On the other hand, a significant association between parity and adherence to aromatase inhibitors for patients with breast cancer was previously reported.15 In addition, patient medication-taking behavior relative to OOP costs may have been influenced by further OOP cost reductions available through manufacturer copay assistance programs, which are not visible in these source data. Manufacturer copay assistance programs have grown from providing $8 billion to $12 billion in offsets for branded medication OOP costs from 2013 to 2019.27
It is important to note that generic formulations of imatinib became available in 2016, achieving nearly 60% share of fills by the end of 2016 and nearly 80% by the end of 2017. Thus, generic imatinib use is reflected in the later years of this analysis among some percentage of the 47 patients (23.7%) in FIHPs and 234 patients (44.9%) in SFHPs. This imbalance may have mitigated the observed impact of parity; however, the effect was likely small. The difference in list price between brand and generic imatinib was only 8% in 2016 and 10% in 2017. The majority of newly treated patients received second-generation TKIs over imatinib by 2016.28
For patients with CML, reducing the cost burden of treatment and improving adherence to TKI therapy remain key humanistic and economic concerns. While more equitable benefit design is a key focus of parity laws, it is just one of the keys in optimizing disease management and outcomes. For example, in addition to burdensome cost sharing, list prices for branded drugs (including oncology agents) continue to outpace inflation in accordance with historical trends.27,29 While rebates blunt the impact of list price growth for protected brand medications,27 patients commonly do not benefit from the resultant lower net prices, which instead reduce spending for employers, health plans, and pharmacy benefit managers and lower premiums for the broader beneficiary base.
In an alternative scenario where patients with CML are better able to afford therapy and adhere to treatment, the health care system might also benefit economically. In CML, TKI exposure suppresses the proliferation of hematopoietic cells through inhibition of the BCR-ABL protein,30 and adherence is associated with early response milestones.11 Thus, improved adherence may help the health care system avoid higher-cost interventions associated with treatment failure, such as switching to later-generation TKIs or hematopoietic stem cell transplantation. Improved disease management may also reduce the risk of premature mortality, since early molecular response is associated with overall survival in CML.31
At the federal level, the Cancer Drug Parity Act of 2019 (House Resolution 1730) intends to extend the reach of parity laws to all states and to SFHPs and public programs such as Medicare.32 This change is likely to be budget friendly for payers, since parity implementation and OOP limits have not previously resulted in a significant change to health plan spending.16,25 However, if the experience after parity implementation at the federal level were to match the effects described to date, policymakers should not expect to move the needle in mitigating the difficult financial situations and suboptimal outcomes experienced by some patients.
Based on this analysis and previous studies, producing meaningful change for patients taking oral anticancer medication will require additional policy intervention. Apart from increasing oversight to ensure that parity laws are implemented appropriately and further studying the state-specific effects of parity laws, policymakers could consider additive approaches such as requiring list price increases to remain at or below common consumer price indices.33
Another innovative solution might be value-based insurance design, which provides lower cost sharing for high-value drugs such as TKIs that extend life, improve quality of life, and avoid downstream medical expenses.34,35 Regardless of the specific solution, it is important that any potential solution considered by policymakers involve the patient perspective to incorporate their unique viewpoints and allow for subsequent research to evaluate and confirm the policy’s effects.36
LIMITATIONS
Our study should be interpreted in the context of some limitations. This analysis is subject to the commonly described limitations of administrative claims data. Further, our analysis is limited in that we could only include patients aged less than 65 years residing in states subject to the requirements of parity laws. As such, the small number of patients included in this study may have led the study to be underpowered to detect small differences in outcomes. In addition, parity laws may be associated with different outcomes in populations more sensitive to medication costs, like older adults who may receive a fixed income, be enrolled in Medicare coverage, and be unable to enroll in manufacturer copayment assistance programs. Therefore, the findings of this analysis are generalizable only to commercially insured populations of patients with CML and receiving TKIs.
Next, this analysis may not fully capture the impact of parity laws. Because of limitations in paid administrative claims data, we were unable to capture primary nonadherence (prescription abandonment at the point-of-sale, potentially due to high costs). Similarly, we did not assess specific clinical outcomes such as treatment switches, hematopoietic stem cell transplant, or mortality.
Finally, this study did not evaluate the extent to which various run-in periods after parity implementation may lead to different results. For example, plans may achieve compliance over a period of time as parity laws are clarified after implementation. Such was the case in Ohio, where parity was clarified to apply only after meeting the deductible in a high-deductible health plan 2 months after implementation.37 In this state-specific case, use of a different run-in period in the study design may have led to different estimates of the outcomes associated with parity.
Conclusions
In a broad sample of commercially insured patients with CML, parity was not associated with reductions in OOP spending or improvements in adherence to TKIs, and there was no significant variation observed for states including OOP spending limits as a component of their parity laws. Parity laws might be improved by ensuring appropriate oversight and by directing additional research toward state-specific approaches to parity. However, a more holistic approach to lowering OOP spending for patients with CML should be pursued.
REFERENCES
- 1.Chronic Myeloid Leukemia Trialists’ Collaborative Group. Interferon alfa versus chemotherapy for chronic myeloid leukemia: a meta-analysis of seven randomized trials. J Natl Cancer Inst. 1997;89(21):1616-20. [PubMed] [Google Scholar]
- 2.Druker BJ, Guilhot F, O’Brien SG, et al. Five-year follow-up of patients receiving imatinib for chronic myeloid leukemia. N Engl J Med. 2006;355(23):2408-17. [DOI] [PubMed] [Google Scholar]
- 3.Iqbal N, Iqbal N. Imatinib: a breakthrough of targeted therapy in cancer. Chemother Res Pract. 2014;2014:357027. [DOI] [PMC free article] [PubMed] [Google Scholar]
- 4.Shih YC, Smieliauskas F, Geynisman DM, et al. Trends in the cost and use of targeted cancer therapies for the privately insured nonelderly: 2001 to 2011. J Clin Oncol. 2015;33(19):2190-96. [DOI] [PMC free article] [PubMed] [Google Scholar]
- 5.Hematology/Oncology Pharmacy Association. Oral chemotherapy issue brief. March 18, 2015. Accessed July 26, 2019. Available from: http://www.hoparx.org/images/hopa/advocacy/Issue-Briefs/HOPA_Oral_Chemotherapy_Issue_Brief.pdf
- 6.IBM Watson Health. IBM Micromedex. RED BOOK. Accessed April 20, 2020. https://www.ibm.com/products/micromedex-red-book
- 7.Claxton G. Levitt L, Rae M, Sawyer B. Increases in cost-sharing payments continue to outpace wage growth. Peterson-KFF Health System Tracker. June 15, 2018. Accessed April 20, 2020 https://www.healthsystemtracker.org/brief/increases-in-cost-sharing-payments-have-far-outpaced-wage-growth/ [Google Scholar]
- 8.Zafar SY, Peppercorn JM, Schrag D, et al. The financial toxicity of cancer treatment: a pilot study assessing out-of-pocket expenses and the insured cancer patient’s experience. Oncologist. 2013;18(4):381-90. [DOI] [PMC free article] [PubMed] [Google Scholar]
- 9.Whitney RL, Bell JF, Reed SC, et al. Predictors of financial difficulties and work modifications among cancer survivors in the United States. J Cancer Surviv. 2016;10(2):241-50. [DOI] [PMC free article] [PubMed] [Google Scholar]
- 10.Altice CK, Banegas MP, Tucker-Seeley RD, Yabroff KR. Financial hardships experienced by cancer survivors: a systematic review. J Natl Cancer Inst. 2016;109(2):djw205. [DOI] [PMC free article] [PubMed] [Google Scholar]
- 11.Wei G, Rafiyath S, Liu D. First-line treatment for chronic myeloid leukemia: dasatinib, nilotinib, or imatinib. J Hematol Oncol. 2010;3:47. [DOI] [PMC free article] [PubMed] [Google Scholar]
- 12.Faiman B. Oral cancer therapy: policy implications for the uninsured and underinsured populations. J Adv Pract Oncol. 2013;4(5):354-60. [DOI] [PMC free article] [PubMed] [Google Scholar]
- 13.Kircher SM, Meeker CR, Nimeiri H, et al. The parity paradigm: can legislation help reduce the cost burden of oral anticancer medications? Value Health. 2016;19(1):88-98. [DOI] [PubMed] [Google Scholar]
- 14.Duzetzina SB, Huskamp HA, Winn AN, et al. Out-of-pocket and health care spending changes for patients using orally administered anticancer therapy after adoption of state parity laws. JAMA Oncol. 2018;4(6):e173598. [DOI] [PMC free article] [PubMed] [Google Scholar]
- 15.Chin AL, Bentley JP, Pollom EL. The impact of state parity laws on copayments for and adherence to oral endocrine therapy for breast cancer. Cancer. 2019;125:374-81. [DOI] [PMC free article] [PubMed] [Google Scholar]
- 16.Dusetzina SB, Huskamp HA, Jazowski SA, et al. Oral oncology parity laws, medication use, and out-of-pocket spending for patients with blood cancers. J Natl Cancer Inst. 2020;112(10):1055-62. [DOI] [PMC free article] [PubMed] [Google Scholar]
- 17.Stuart EA, Huskamp HA, Duckworth K, et al. Using propensity scores in difference-in-differences models to estimate the effects of a policy change. Health Serv Outcomes Res Methodol. 2014;14(4):166-82. [DOI] [PMC free article] [PubMed] [Google Scholar]
- 18.Sato T, Matsuyama Y. Marginal structural models as a tool for standardization. Epidemiology. 2003;14(6):680-86. [DOI] [PubMed] [Google Scholar]
- 19.Robins JM, Hernán MA, Brumback B. Marginal structural models and causal inference in epidemiology. Epidemiology. 2000;11(5):550-60. [DOI] [PubMed] [Google Scholar]
- 20.van Walraven C, Austin PC, Jennings A, Quan H, Forster AJ. A modification of the Elixhauser comorbidity measures into a point system for hospital death using administrative data. Med Care. 2009;47(6):626-33. [DOI] [PubMed] [Google Scholar]
- 21.Hernan MA, Brumback B, Robins JM. Marginal structural models to estimate the causal effect of zidovudine on the survival of HIV-positive men. Epidemiology. 2000;11(5):561-70. [DOI] [PubMed] [Google Scholar]
- 22.Heckman JJ, Smith J, Clements N. Making the most out of programme evaluations and social experiments: accounting for heterogeneity in programme impacts. Rev Econ Stud. 1997;64(4):487-535. [Google Scholar]
- 23.Heckman JJ. The scientific model of causality. Sociol Methodol. 2005;35(1):1-97. [Google Scholar]
- 24.Kaiser Family Foundation. Employer health benefits: 2019 annual survey. Accessed August 9, 2020. http://files.kff.org/attachment/Report-Employer-Health-Benefits-Annual-Survey-2019
- 25.Yeung K, Barthold D, Dusetzina SB, Basu A. Patient and plan spending after state specialty-drug out-of-pocket spending caps. N Engl J Med. 2020;383:558-66. [DOI] [PubMed] [Google Scholar]
- 26.Dusetzina SB, Winn AN, Abel GA, Huskamp HA, Keating NL. Cost sharing and adherence to tyrosine kinase inhibitors for patients with chronic myeloid leukemia. J Clin Oncol. 2014;32(4):306-11. [DOI] [PubMed] [Google Scholar]
- 27.IQVIA Institute for Human Data Science. Medicine spending and affordability in the United States. August 4, 2020. Accessed April 5, 2021. https://www.iqvia.com/insights/the-iqvia-institute/reports/medicine-spending-and-affordability-in-the-us
- 28.Cole AL, Dusetzina SB. Generic price competition for specialty drugs: too little, too late? Health Aff (Millwood). 2018;37(5):738-42. [DOI] [PubMed] [Google Scholar]
- 29.Bennette CS, Richards C, Sullivan SD, Ramsey SD. Steady increase in prices for oral anticancer drugs after market launch suggests a lack of competitive pressure. Health Aff (Millwood). 2016;35(5):805-12. [DOI] [PubMed] [Google Scholar]
- 30.Patel AB, O’Hare T, Deininger MW. Mechanisms of resistance to ABL kinase inhibition in chronic myeloid leukemia and the development of next generation ABL kinase inhibitors. Hematol Oncol Clin North Am. 2017;31(4):589-612. [DOI] [PMC free article] [PubMed] [Google Scholar]
- 31.Hanfstein B, Müller MC, Hehlmann R, et al. Early molecular and cytogenetic response is predictive for long-term progression-free and overall survival in chronic myeloid leukemia (CML). Leukemia. 2012;26(9):2096-102. [DOI] [PubMed] [Google Scholar]
- 32.Cancer Drug Parity Act of 2019. HR 1730. 116 Cong. 2nd Sess. (2019). Accessed August 9, 2020. https://www.congress.gov/bill/116th-congress/house-bill/1730/text
- 33.Anderson GF. It’s time to limit drug price increases. Health Affairs Blog. July 25, 2019. Accessed August 9, 2020. https://www.healthaffairs.org/do/10.1377/hblog20190715.557473/full/
- 34.Yeung K, Basu A, Hansen RN, Watkins JB, Sullivan SD. Impact of a value-based formulary on medication utilization, health services utilization, and expenditures. Med Care. 2017;55(2):191-98. [DOI] [PMC free article] [PubMed] [Google Scholar]
- 35.Noens L, van Lierde MA, De Bock R, et al. Prevalence, determinants, and outcomes of nonadherence to imatinib therapy in patients with chronic myeloid leukemia: the ADAGIO study. Blood. 2009;113(22):5401-11 [DOI] [PubMed] [Google Scholar]
- 36.Rimer BK. The imperative of addressing cancer drug costs and value. National Cancer Institute. March 15, 2018. Accessed August 9, 2020. https://www.cancer.gov/news-events/cancer-currents-blog/2018/presidents-cancer-panel-drug-prices [Google Scholar]
- 37.Amended Substitute House Bill Number 201, HB 201, Ohio 130th Gen Assembly (2013-2014). Accessed August 9, 2020. http://archives.legislature.state.oh.us/bills.cfm?ID=130_HB_201