

Abstract
BACKGROUND:
In 2014, qualified health plans sold in the Affordable Care Act (ACA) marketplaces were accused of providing drug coverage that was too restrictive and costly. After the change in administration in 2016, efforts to repeal portions of the ACA led to increases in premiums, decreases in enrollment, and overall uncertainty.
OBJECTIVE:
To examine how the number of formulary tiers and medication cost sharing, as well as transparency around these aspects, in qualified bronze and silver health plans in California, Florida, and Illinois changed from 2014 to 2018.
METHODS:
A search of all bronze and silver qualified health plans in California, Florida, and Illinois was performed in 2014 and in 2018 through the marketplace and issuer websites.
RESULTS:
From 2014 to 2018, the total number of bronze and silver qualified health plans offered in California, Florida, and Illinois remained relatively stable (36 to 35, 123 to 122, and 60 to 74, respectively). Over the same time period, the median number of formulary tiers remained constant for California and Florida (four and five) and increased from five to seven for Illinois. Of note, most Illinois plans shifted from a formulary with five or fewer tiers (92% of plans) to seven tiers (73% of plans) between 2014 and 2018. There was also an increase in the use of coinsurance instead of copay for each of the four following formulary tiers: generic (19% to 27% of plans), preferred brand (21% to 38%), nonpreferred brand (33% to 52%), and specialty (76% to 91%). Additionally, there was an increase in the median coinsurance rates for each of the aforementioned tiers: 0% to 25%, 0% to 35%, 30% to 40%, and 30% to 40%, respectively. The proportion of plans that provided their formularies on the marketplace website increased from 82% to 97% from 2014 to 2018, with the increase mostly driven by California plans (0% to 80%). There was a small increase in the proportion of plans that reported medication cost sharing through the medical benefit from 2014 (19%) to 2018 (25%).
CONCLUSIONS:
Between 2014 and 2018, qualified health plans increased their use of formularies with greater numbers of tiers, the use of coinsurance for each tier, and higher coinsurance rates. Availability of formularies on marketplace websites increased, but cost sharing transparency for medications covered by the medical benefit could greatly improve.
What is already known about this subject
The Affordable Care Act (ACA) establishes minimum essential coverage requirements and, depending on the type of marketplace, either the state or federal government is responsible for ensuring adequate coverage, including drug formulary coverage.
In 2014, there were criticisms that some qualified health plans on the ACA marketplaces were providing drug coverage that was too restrictive and costly. Out-of-pocket expenses for medications in a typical silver qualified health plan were estimated to be twice as high as they were in the average employer-sponsored plan.
What this study adds
Between 2014 and 2018, bronze and silver qualified health plans in California, Florida, and Illinois shifted to formularies with greater numbers of tiers (up to seven).
There was also an increase in the use of coinsurance, as well as the median coinsurance rate per formulary tier between 2014 and 2018.
While the availability of formularies on marketplace websites increased from 2014 to 2018, there remains room for improvement in transparency around cost sharing of medications covered through the medical benefit.
Qualified health plans, established by the Patient Protection and Affordable Care Act (ACA) of 2010, are health insurance plans that are sold on ACA marketplaces (exchanges) after certification of meeting minimum essential coverage requirements. These requirements include providing 10 essential health benefits and following established limits on cost sharing.1 One of the 10 essential health benefits is prescription drug coverage, and the level of coverage provided must be comparable to that of each state’s benchmark plan.2 The benchmark plan is selected based on a process outlined by the Center for Medicare and Medicaid Services, and each state can have a different benchmark plan.2 For state-run marketplaces, each state evaluates whether a health plan is comparable to the benchmark plan. Whereas, final approval is given at the federal level for federally-facilitated marketplaces.3 As a result, different types of marketplaces can offer plans that differ in levels of access and coverage.
In 2014, the first year the ACA marketplaces were operational, there were criticisms that some plans offered drug formulary coverage that was too restrictive and costly for patients.4–7 For example, a formal complaint was made to the Department of Health and Human Services that some plans were practicing “adverse tiering.” All medications in the human immunodeficiency virus (HIV) drug class were being placed on the formulary tier with the highest cost sharing, thereby dissuading people with HIV from selecting the plans.8 In such plans, the estimated average annual out-of-pocket cost of a typical HIV regimen (ie, emtricitabine, tenofovir, and efavirenz) was over $6,000, compared to less than $3,000 in a non-adverse tiering plan.6 Compared to gold and platinum plans, bronze and silver plans have lower actuarial values and lower monthly premiums; therefore, bronze and silver plans would be more likely to exhibit adverse tiering or impose more restrictive coverage and higher medication cost sharing.9 Bronze and silver plans are also the most popular: 90% of enrollees choose these plans.10 Therefore, our study focuses on bronze and silver plans.
In addition to providing affordable health insurance to more Americans, another goal of the ACA was to improve transparency around marketplace health insurance. In particular, the ACA imposed cost sharing transparency requirements, including for medications, as well as reporting and disclosure requirements on plans.11,12 For example, plans were required to provide enrollees and applicants with a uniform Summary of Benefits and Coverage (SBC) document that used plain language and provided two examples of expected patient costs for common scenarios. However, surveys of marketplace assister programs found that more than 80% of consumers did not understand their plan choices in 2014, and many had questions about health plans that were not answered by information on the marketplace website in 2016.13,14
From 2014 to 2016, annual enrollment in plans through the marketplaces increased from approximately eight million to 12.7 million.15 However, after the change of administration in 2016, there was a myriad of efforts to repeal the ACA. In October 2017, cost sharing reduction payments, the federal government subsidies paid to insurers to lower premiums for patients under 250% of the federal poverty line, were halted.16,17 In December 2017, the Tax Cuts and Jobs Act was signed, repealing the individual mandate starting in 2019.18 As a result, between 2017 and 2018, average marketplace benchmark premiums increased by 34%—more than four times greater than the increase the year before.19,20 The increase has likely contributed to the decline in both the number of enrollees and the number of issuers of qualified health plans since 2016.15,21,22 What remains unknown is how uncertainty around the ACA, after 2016, affected formulary design and medication cost sharing levels. The objective of this study is to examine how the number of formulary tiers and medication cost sharing, as well as transparency around these aspects, in qualified bronze and silver health plans in California, Florida, and Illinois changed from 2014 to 2018.
Methods
A search of all bronze and silver qualified health plans in California, Florida, and Illinois was performed in 2014 and in 2018, following the same search strategy. California, Florida, and Illinois were chosen because of their representation of different types of marketplaces (ie, state-based, federally–facilitated, and state-federal partnership, respectively).23-25 Identification of qualified health plans was conducted through the online marketplace for each respective state. California provides its own website, www.coveredca.com, while Florida and Illinois use the federally-run website, www.healthcare.gov/see-plans, to facilitate their marketplaces. Identical plans that were offered in multiple zip codes were only recorded once. Health plan information was identified using consistent search criteria for all three states: an assumed age of 30 years and a single person household annual income of $50,000. The 30 years was based on the largest proportion of (40%) enrollees in health insurance marketplaces: the age group of 18 to 34 years.26 The $50,000 annual income was chosen based on the 2014 median household income in the United States of $53,637.27
In California, additional information concerning one’s expected health care use, as well as smoking and pregnancy status, is requested. Medium use—which was defined on the California state-based marketplace as one prescription each month and three to five doctor’s visits, tests, or x-rays per year—was assumed along with non-smoking and non-pregnant status. The following characteristics were reported for each plan: bronze vs silver level, plan type, online availability of formulary, number of formulary tiers, pharmacy benefit cost sharing, and drug cost sharing through the medical benefit.
To assess degree of transparency, information on availability of formularies and medical benefit drug coverage was gathered from marketplace websites, issuer websites, and specific plan documents. If formularies were not provided on the marketplace website, identification numbers and plan names were entered into the independent plan website in order to identify the formulary. To identify pharmacy and medical drug benefit information for each plan, we used the SBC document, which outlined the tier structure and cost sharing for drugs. The SBC document also outlined the amounts and types of specific deductibles or out-of-pocket maximums.
Results
From 2014 to 2018, the total number of bronze and silver qualified health plans offered in California, Florida, and Illinois remained relatively stable (36 to 35, 123 to 122, and 60 to 74, respectively).
PLAN CHARACTERISTICS
In 2014, there were a total of 111 silver plans and 108 bronze plans offered across the California, Florida, and Illinois marketplaces. The proportion of silver plans increased from 51% in 2014 to 56% in 2018. Florida offered the largest proportion of silver plans at 62% (Supplementary Table (11.6KB, pdf) , available in online article).
PHARMACY BENEFIT
In 2014, none of the California plans provided their formularies on the marketplace website, and only 19 of 36 plans (52%) provided their formularies on the issuer website. By 2018, 28 of 36 California plans (80%) provided their formularies directly on the marketplace website, and all plans provided their formularies on the issuer website. From 2014 to 2018, all—or nearly all—Florida and Illinois plans included a link to their formulary directly on the marketplace website (Table 1). Formulary information was found either as a link in the SBC or on the marketplace website. Formularies were offered either as downloadable PDF documents or as a website with a search tool to find a drug of interest.
TABLE 1.
Number (and Proportion) of Plans with a Formulary Available
| Formulary available on marketplace website, number (%) | Formulary available online (marketplace or issue website), number (%) | |||
|---|---|---|---|---|
| 2014 | 2018 | 2014 | 2018 | |
| California (n = 36 in 2014; n = 35 in 2018) | 0 (0) | 28 (80) | 19 (53) | 35 (100) |
| Florida (n = 123 in 2014; n = 122 in 2018) | 120 (98) | 122 (100) | 120 (98) | 122 (100) |
| Illinois (n = 60 in 2014; n = 74 in 2018) | 60 (100) | 74 (100) | 60 (100) | 74 (100) |
| Total (n = 219 in 2014; n = 231 in 2018) | 180 (82) | 224 (97) | 199 (91) | 231 (100) |
In 2014, the median number of formulary tiers were—respectively—four, five, and five for California, Florida, and Illinois, compared to four, five, and seven in 2018. There was an increase in the proportion of plans offering larger numbers of formulary tiers in Florida and Illinois (Figure 1). Specifically, 92% of the Illinois plans used five or less tiers in 2014; however, in 2018, 73% of the Illinois plans used a seven-tier formulary. A common seven-tier formulary included the following tiers: generic mail, generic retail, preferred brand mail, preferred brand retail, nonpreferred brand mail, nonpreferred brand retail, and specialty retail. Meanwhile, almost all the California plans used four-tier formularies.
FIGURE 1.

Number of Formulary Tiers by State and Year
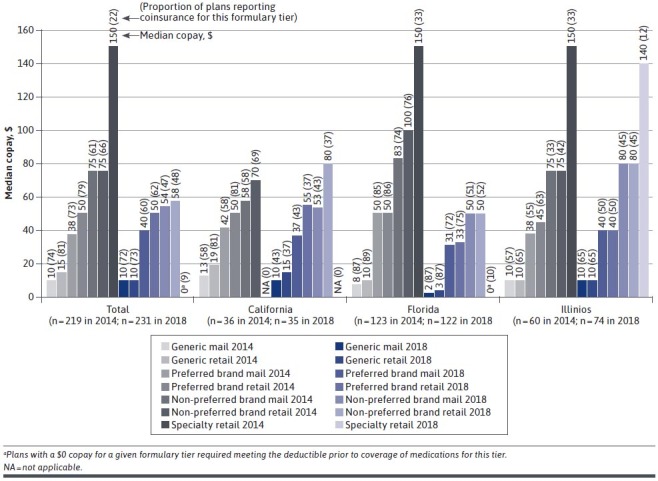
The use of copays instead of coinsurance decreased from 2014 to 2018. The largest decreases were seen for higher tiers (eg, those with higher cost sharing) across all plans in the three states (Figure 2). For the nonpreferred brand mail, nonpreferred brand retail, and specialty tiers, the proportion of plans using copays decreased, respectively, from 61% to 47%, 66% to 48%, and 22% to 9%. Between 2014 and 2018, median copay amounts by formulary tier remained relatively consistent for California and Illinois plans but decreased for Florida plans.
FIGURE 2.

Median Copay for (and Proportion of Plans with) a Given Formulary Tier by State and Yeara
From 2014 to 2018, there was an increase in the proportion of plans using coinsurance instead of copay for their generic (19% to 27% of plans), preferred brand (21% to 38% of plans), nonpreferred brand (33% to 52% of plans), and specialty (76% to 91% of plans) formulary tiers (Figure 3). There was also an increase in the coinsurance rates, respectively, for each of the aforementioned tiers: 0% to 25%, 0% to 35%, 30% to 40%, and 30% to 40%. When coinsurance was used, the coinsurance rates were the same for mail order vs retail. In particular, California plans showed the greatest changes in both increased use of coinsurance as well as increase in coinsurance rates between 2014 and 2018.
FIGURE 3.
Median Coinsurance for (and Proportion of Plans with) a Given Formulary Tier by State and Yeara
MEDICAL BENEFIT
Across all states, there was a small increase in the proportion of plans that reported medication cost sharing through the medical benefit from 2014 (19%) to 2018 (25%), with Florida plans most likely to report (Table 2). Almost half (49%) of plans that reported medication cost sharing through the medical benefit used coinsurance in 2018. This percentage was a slight increase from 2014 (43%). Between the years of 2014 to 2018, the median coinsurance rate increased from 10% to 40%, and the median copay stayed constant at $60.
TABLE 2.
Medication Cost Sharing Through the Medical Benefit
| Number (%) of plans reporting medication cost sharing through the medical benefit | Median copaya, $ | Median coinsurancea, % (% of reporting plans) | ||||
|---|---|---|---|---|---|---|
| 2014 | 2018 | 2014 | 2018 | 2014 | 2018 | |
| California (n = 36 in 2014; n = 35 in 2018) | 0 (0) | 2 (6) | NA | NA | NA | 40 (100) |
| Florida (n = 123 in 2014; n = 122 in 2018) | 42 (34) | 49 (40) | 60 (57) | 60 (59) | 10 (43) | 40 (41) |
| Illinois (n = 60 in 2014; n = 74 in 2018) | 0 (0) | 6 (8) | NA | NA | NA | 50 (100) |
| Total (n = 219 in 2014; n = 231 in 2018) | 42 (19) | 57 (25) | 60 (57) | 60 (51) | 10 (43) | 40 (49) |
aMedian copay and coinsurance across reporting plans.
NA = not applicable.
The SBC rarely provided information about medical drug benefit, so a more detailed schedule of benefits (SOB) document often needed to be searched. If the issuer provided a SOB for a specific plan, it was found either as a link at the top of the SBC or in a link on the marketplace website. Even in the SOB document, medication cost sharing through the medical benefit was often excluded from the summary tables and instead described somewhere within the lengthy document (eg, 80+ pages), making information on medication cost sharing through the medical benefit difficult to find.
Discussion
Our study found that between 2014 and 2018, bronze and silver qualified health plans in California, Florida, and Illinois shifted to more complicated formulary structures with higher patient medication cost sharing. Across all three states, there were increases in the use of coinsurance instead of copayments, higher coinsurance rates, and greater numbers of formulary tiers (up to seven tiers). For specialty tiers, generally requiring the most cost sharing, approximately 75% of plans used coinsurance in 2014. By 2018, 90% of plans used coinsurance. The median coinsurance amount for specialty tiers over this time period also increased from 30% to 40%, which could lead to significant medication costs.
The increased use of coinsurance may cause concern, given that prior studies, examining 2014 qualified health plans, found that cost sharing for prescription drugs was already more expensive than employer-sponsored plans.28,29 One study estimated that out-of-pocket expenses for medications in a typical silver plan were twice as high as they were in the average employer-sponsored plan, and that nearly one-third of enrollees would hit the out-of-pocket spending cap.28 Due to the high cost sharing, it was predicted that fewer prescriptions would be filled, and there would be higher spending on medical services.28
Among the three states, plans shifted in different ways between 2014 and 2018. The shifts were likely due to the different type of marketplace and benchmark plan for each state. California plans showed the largest increases in both coinsurance use and rates between 2014 and 2018. By 2018, plans with seven-tier formularies comprised of three-quarters of Illinois plans and one-third of Florida plans. Seven-tier formularies may help insurance plans better manage their prescription spending at a more detailed level and allow for savings from filling at mail order pharmacies. However, seven-tier formularies may also confuse patients about their expected out-of-pocket medication costs. This confusion can lead to avoidance of medication use and poorer medication adherence.30-32 Therefore, plans may want to consider the potential patient impact of more complicated formulary structures.
In terms of transparency, our study found that the availability of formularies on the marketplace website improved from 2014 to 2018, especially in California. As a state-based marketplace, California uses its own marketplace website instead of the federal marketplace website. This is likely the reason that no California plans had their formularies available on the marketplace website in 2014, while nearly all plans in Florida and Illinois had their formularies available on the federal marketplace website. By 2018, eight of 10 California plans had their formularies available on the marketplace website. In addition to formulary availability, our study also found room for improvement in cost sharing transparency for medications covered through the medical benefit. In 2018, only a quarter of plans had information about medication cost sharing through the medical benefit available on the marketplace or issuer websites, and many times, the information was difficult to find. Given that medications covered by the medical benefit are often very costly, patients should be able to easily find their expected cost sharing for medications.
LIMITATIONS
Due to resource constraints, we examined only bronze and silver health plans and three states’ marketplaces; therefore, study results are not generalizable beyond this scope. We focused on bronze and silver health plans because approximately 90% of plan enrollees choose bronze or silver plans.10 Additionally, compared to gold and platinum health plans, bronze and silver plans have lower actuarial values and, therefore, are at higher risk of greater formulary restrictiveness and higher medication cost sharing.9 We chose California, Florida, and Illinois to represent different types of marketplaces (ie, state-based, federally-facilitated, and state-federal partnership, respectively). However, the 2014 cost sharing levels that we found were similar to those reported in prior studies.28,29
Conclusions
Between 2014 and 2018, bronze and silver qualified health plans in California, Florida, and Illinois shifted to more complicated formulary structures with higher patient medication cost sharing. Across the three states, there were increases in the use of coinsurance instead of copayments, higher coinsurance rates, and the use of greater numbers of formulary tiers. For specialty tiers, generally requiring the most cost sharing, approximately three-quarters of plans used coinsurance in 2014. By 2018, nine out of 10 plans used coinsurance. Over this time period, the median coinsurance amount for specialty tiers also increased from 30% to 40%, potentially putting patients at risk of significant medication costs. While the availability of formularies on marketplace websites increased from 2014 to 2018, there remains room for improvement in transparency around cost sharing of medications, particularly of those covered through the medical benefit. As formulary structures become more complicated, plans may want to consider the potential impact on patient understanding of their expected out-of-pocket costs.
REFERENCES
- 1.United States Department of Health and Human Services. Qualified health plan. HealthCare.gov Accessed February 4, 2021. https://www.healthcare.gov/glossary/qualified-health-plan/
- 2.Centers for Medicare and Medicaid Services. Information on essential health benefits (EHB) benchmark plans. CMS.gov Accessed February 4, 2021. https://www.cms.gov/CCIIO/Resources/Data-Resources/ehb
- 3.Dash S, Monahan C, Lucia K. Health insurance exchanges and state decisions. Project HOPE. Published online July 18, 2013. doi:10.1377/hpb20130718.132696 [Google Scholar]
- 4.Gottlieb S. Under obamacare’s “closed formularies” patients with serious chronic diseases like MS don’t get access to vital medicines. Forbes. Published June 13, 2014. Accessed February 4, 2021. https://www.forbes.com/sites/scottgottlieb/2014/06/13/obamacare-shortchanges-patients-with-chronic-diseases/?sh=6133f604156f
- 5.Zamani-Hank Y. The affordable care act and the burden of high cost sharing and utilization management restrictions on access to HIV medications for people living with HIV/AIDS. Popul Health Manag. 2016;19(4):272-278. doi:10.1089/pop.2015.0076 [DOI] [PubMed] [Google Scholar]
- 6.Jacobs DB, Sommers BD. Using drugs to discriminate—adverse selection in the insurance marketplace. N Engl J Med. 2015;372(5):399-402. doi:10.1056/NEJMp1411376 [DOI] [PubMed] [Google Scholar]
- 7.Pharmaceutical Research and Manufacturers of America. An analysis of exchange plan benefits for certain medicines. PhRAMA.org. Published June 2, 2014. Accessed February 1, 2014. https://phrma.org/en/Report/An-Analysis-of-Exchange-Plan-Benefits-for-Certain-Medicines
- 8.National Health Law Program. Discriminatory pharmacy benefits design in select qualified health plans offered in Florida, office of civil rights, department of health and human services. healthlaw.org. Published May 29, 2014. Accessed February 4, 2021. https://healthlaw.org/resource/discriminatory-pharmacy-benefits-design-in-select-qualified-health-plans-offered-in-florida-office-of-civil-rights-department-of-health-and-human-services/
- 9.United States Department of Health and Human Services. The “metal" categories: bronze, silver, gold & platinum. HealthCare.gov. Accessed February 5, 2021. https://www.healthcare.gov/choose-a-plan/plans-categories/
- 10.Kaiser Family Foundation. Marketplace plan selections by metal level. kff.org. Accessed February 4, 2021. https://www.kff.org/health-reform/state-indicator/marketplace-plan-selections-by-metal-level-2/?dataView=1¤tTimeframe=0&selectedRows=%7B%22wrapups%22:%7B%22united-states%22:%7B%7D%7D%7D&sortModel=%7B%22colId%22:%22Location%22,%22sort%22:%22asc%22%7D
- 11.Keith K. Trump administration finalizes transparency rule for health insurers. Health Affairs. Published November 1, 2020. Accessed February 4, 2021. https://www.healthaffairs.org/do/10.1377/hblog20201101.662872/full/
- 12.Pollitz K, Levitt L. Health insurance transparency under the affordable care act. Kaiser Family Foundation; 2012. Accessed February 4, 2021. https://www.kff.org/health-reform/perspective/health-insurance-transparency-under-the-affordable-care-act/
- 13.Pollitz K, Tolbert J, Ma R. Survey of Health Insurance Marketplace Assister Programs: A First Look at Consumer Assistance under the Affordable Care Act. Kaiser Family Foundation Accessed February 4, 2021. http://files.kff.org/attachment/survey-of-health-insurance-marketplace-assister-programs-report
- 14.Pollitz K, Tolbert J, Semanskee A. 2016 survey of health insurance marketplace assister programs and brokers. Kaiser Family Foundation. Published June 8, 2016. Accessed February 4, 2021. https://www.kff.org/health-reform/report/2016-survey-of-health-insurance-marketplace-assister-programs-and-brokers/
- 15.Kaiser Family Foundation. Marketplace enrollment, 2014-2020. kff.org. Accessed February 1, 2021. https://www.kff.org/health-reform/state-indicator/market-place-enrollment/?activeTab=graph¤tTimeframe=0&startTimeframe=6&selectedRows=%7B%22wrapups%22:%7B%22united-states%22:%7B%7D%7D%7D&sor-tModel=%7B%22colId%22:%222014Number%20of%20Individuals%20Who%20Selected%20a%20Marketplace%20Plan%22,%22sort%22:%22desc%22%7D
- 16.Jost T. Court says marketplace insurers are entitled to payments for reducing cost-sharing, but must offset premium tax credit increases. The Commonwealth Fund. Published August 18, 2020. Accessed February 4, 2021. https://www.commonwealthfund.org/blog/2020/court-marketplace-insurers-payments-reducing-cost-sharing
- 17.National Conference of State Legislatures. State insurance mandates and the ACA essential benefits provisions. ncsl.org. Published April 12, 2018. Accessed February 4, 2021. https://www.ncsl.org/research/health/state-ins-man-dates-and-aca-essential-benefits.aspx
- 18.Willison CE, Singer PM. Repealing the affordable care act essential health benefits: threats and obstacles. Am J Public Health. 2017;107(8):1225-1226. doi:10.2105/AJPH.2017.303888 [DOI] [PMC free article] [PubMed] [Google Scholar]
- 19.Kaiser Family Foundation. Marketplace average benchmark premiums. kff.org. Accessed February 3, 2021. https://www.kff.org/health-reform/state-indicator/marketplace-average-benchmark-premiums/?currentTimeframe=0&selectedRows=%7B%22wrapups%22:%7B%22united-states%22:%7B%7D%7D%7D&sortModel=%7B%22colId%22:%22Location%22,%22sort% 22:%22asc%22%7D
- 20.Wengle E, Blumberg L. Marketplace coverage enrollment by metal tier, 2016-2018: trends in states using the healthcare.gov enrollment platform. Robert Wood Johnson Foundation. Published September 29, 2020. Accessed February 4, 2021. https://www.rwjf.org/en/library/research/2020/09/marketplace-coverage-enrollment-by-metal-tier--2016-2018--trends.html
- 21.Fehr R, Cox C, Levitt L. Data note: changes in enrollment in the individual health insurance market through early 2019. Kaiser Family Foundation. Published August 21, 2019. Accessed February 1, 2021. https://www.kff.org/private-insurance/issue-brief/data-note-changes-in-enrollment-in-the-individual-health-insurance-market-through-early-2019/
- 22.Kaiser Family Foundation. Number of issuers participating in the individual health insurance marketplaces. kff.org. Accessed February 1, 2021. https://www.kff.org/other/state-indicator/number-of-issuers-participating-in-the-individual-health-insurance-marketplace/?currentTimeframe=0&selectedRows=%7B%22wrapups%22:%7B%22united-states%22:%7B%7D%7D%7D&sortModel=%7B%22colId%22:%22Location%22,%22sort%22:%22asc%22%7D
- 23.Kaiser Family Foundation. State health insurance marketplace types, 2021. kff.org. Accessed February 1, 2021.https://www.kff.org/health-reform/state-indicator/state-health-insurance-marketplace-types/?currentTimeframe=0&sortModel=%7B%22colId%22:%22Location%22,%22sort%22:%22asc%22%7D
- 24.National Conference of State Legislatures. State actions to address health insurance exchanges. ncsl.org. Published October 26, 2020. Accessed February 1, 2021. https://www.ncsl.org/research/health/state-actions-to-imple-ment-the-health-benefit.aspx#archives
- 25.Giovannelli J, Lucia K. The experiences of state-run marketplaces that use healthcare.gov. The Commonwealth Fund. Published September 17, 2015. Accessed February 4, 2021. https://www.commonwealthfund.org/publications/issue-briefs/2015/sep/experiences-state-run-marketplaces-use-healthcaregov [PubMed]
- 26.Levitt L, Claxton G, Damico A. The numbers behind “young invincibles" and the affordable care act. Kaiser Family Foundation. Published December 17, 2013. Accessed February 1, 2021. https://www.kff.org/health-reform/perspective/the-numbers-behind-young-invincibles-and-the-affordable-care-act/
- 27.DeNavas-Walt C, Proctor BD. Income and poverty in the United States: 2014: the current population reports. US Department of Commerce. Published September 2015. Accessed February 1, 2021. https://www.census.gov/content/dam/Census/library/publications/2015/demo/p60-252.pdf
- 28.Thorpe KE, Allen L, Joski P. Out-ofpocket prescription costs under a typical silver plan are twice as high as they are in the average employer plan. Health Aff (Milwood). 2015;34(10):1695-1703. doi:10.1377/hlthaff.2015.0323 [DOI] [PubMed] [Google Scholar]
- 29.Buttorff C, Andersen MS, Riggs KR, Alexander GC. Comparing employer-sponsored and federal exchange plans: wide variations in cost sharing for prescription drugs. Health Aff (Milwood). 2015;34(3):467-476. doi:10.1377/hlthaff.2014.0615 [DOI] [PubMed] [Google Scholar]
- 30.Reed M, Brand R, Newhouse JP, Selby JV, Hsu J. Coping with prescription drug cost sharing: knowledge, adherence, and financial burden. Health Serv Res. 2008;43(2):785-797. doi:10.1111/j.1475-6773.2007.00797.x [DOI] [PMC free article] [PubMed] [Google Scholar]
- 31.Piette JD, Heisler M. The relationship between older adults’ knowledge of their drug coverage and medication cost problems. J Am Geriatr Soc. 2006;54(1):91-96. doi:10.1111/j.1532-5415.2005.00527.x [DOI] [PubMed] [Google Scholar]
- 32.Tipirneni R, Politi MC, Kullgren JT, Kieffer EC, Goold SD, Scherer AM. Association between health insurance literacy and avoidance of health care services owing to cost. JAMA Netw Open. 2018;1(7):e184796. doi:10.1001/jamanetworkopen.2018.4796 [DOI] [PMC free article] [PubMed] [Google Scholar]