Abstract
BACKGROUND:
Little is known about the economic burden of treatment-resistant depression (TRD) in patients with physical conditions.
OBJECTIVE:
To assess health care resource utilization (HRU) and costs, work loss days, and related costs in patients with TRD and physical conditions versus patients with the same conditions and non-TRD major depressive disorder (MDD) or without MDD.
METHODS:
Adults aged < 65 years with MDD treated with antidepressants were identified in the OptumHealth Care Solutions database (July 2009-March 2017). Patients who received a diagnosis of MDD and initiated a third antidepressant regimen (index date) after 2 regimens of adequate dose and duration were defined as having TRD. Patients with non-TRD MDD and without MDD were assigned a random index date. Patients with < 6 months of continuous health plan eligibility pre- or post-index; a diagnosis of psychosis, schizophrenia, bipolar disorder/mania, dementia, and developmental disorders; and/or no baseline physical conditions (cardiovascular, metabolic, and respiratory disease or cancer) were excluded. Patients with TRD were matched 1:1 to each of the non-TRD MDD and non-MDD cohorts based on propensity scores. Per patient per year HRU, costs, and work loss outcomes were compared up to 24 months post-index date using negative binominal and ordinary least square regressions.
RESULTS:
A total of 2,317 patients with TRD (mean age, 47.6 years; 63.1%, female; mean follow-up, 19.7 months) had ≥ 1 co-occurring key physical condition (cardiovascular, 52.5%; metabolic, 48.2%; respiratory, 16.4%; and cancer, 9.5%). Relative to non-TRD MDD and non-MDD cohorts, respectively, patients with TRD had 46% and 235% more inpatient admissions, 28% and 128% more emergency department visits, and 53% and 155% more outpatient visits (all P < 0.05). Health care costs were $22,541 in the TRD cohort, $17,450 in the non-TRD MDD cohort, and $10,047 in the non-MDD cohort, yielding cost differences of $5,091 (vs. non-TRD MDD) and $12,494 (vs. non-MDD; all P < 0.01). In patients with work loss data available (n = 278/cohort), those with TRD had 2.0 and 2.9 times more work loss as well as $8,676 and $10,323 higher work loss costs relative to those with non-TRD MDD and without MDD, respectively (all P < 0.001).
CONCLUSIONS:
In patients with physical conditions, those with TRD had higher HRU and health care costs, work loss days, and associated costs compared with non-TRD MDD and non-MDD cohorts.
What is already known about this subject
Approximately a third of patients with major depressive disorder (MDD), who receive pharmacologic treatment, have treatment-resistant depression (TRD). These patients incur significantly higher health care costs than those with treatment-responsive MDD (i.e., non-TRD MDD) and without MDD.
Patients with MDD and, in particular those with TRD, have higher rates of physical conditions than individuals without MDD.
Despite the documented interplay between depression and physical health, limited data are available on the health care resource utilization (HRU) and health care costs of patients with TRD and co-occurring physical conditions.
What this study adds
Patients with TRD and concurrent physical conditions incurred higher all-cause HRU and higher all-cause health care costs compared with patients with the same physical conditions and non-TRD MDD or without MDD.
Medical costs related to physical conditions were similar in patients with MDD regardless of TRD but were significantly higher in patients with TRD versus those without MDD. Thus, MDD may complicate the clinical management of physical conditions or have a negative impact on their course.
The work loss-related costs of patients with TRD were more than 2-fold higher than those of patients with non-TRD MDD and 3-fold higher than those of patients without MDD.
Major depressive disorder (MDD) is a common and incapacitating psychiatric condition with a 12-month prevalence of 7.2% in the United States in 2018.1 About 50% of individuals with MDD are reported to receive pharmacotherapy for their condition.2 Among them, approximately one third are estimated to have treatment-resistant depression (TRD),3 which is most commonly defined as an absence of response to ≥ 2 different antidepressant regimens of adequate dose and duration.4
The incremental economic burden of patients with TRD relative to patients with treatment-responsive MDD (i.e., non-TRD MDD) or individuals without MDD is substantial across U.S. payers, including commercial health plans,5 Medicare,6 Medicaid,7,8 and Veterans Health Administration.3 Specifically, commercially insured patients with TRD were reported to have $6,709 higher annual costs compared with patients with non-TRD MDD and $9,917 higher annual costs compared with individuals without MDD.5 On a national scale, patients with TRD are estimated to incur a direct health care costs burden of approximately $30 billion annually, representing more than 50% of the overall cost burden of pharmacologically treated MDD.3 Furthermore, patients with TRD were shown to exhibit greater work loss-related costs than matched controls with non-TRD MDD and without MDD.5,9
Physical conditions often accompany mental illness. At least half of patients with MDD are affected by 1 or more co-occurring physical conditions.10,11 Patients with MDD, and in particular those with TRD, have higher rates of comorbidities than individuals without MDD.5,6,8,12 Moreover, TRD appears to be associated with higher rates of cardiovascular disease,7,13 metabolic disorders,12,14-16 and respiratory disease13 relative to non-TRD MDD. Notably, the severity of depression has been shown to be associated with the presence of comorbidities,17 and previous studies found that co-occurring physical conditions are associated with a reduced likelihood of response to antidepressants.10,11
Given the interactions between depression and physical health, patients with TRD and co-occurring physical conditions may incur substantially increased health care utilization and higher health care costs. The present study sought to assess health care resource utilization (HRU) and costs, work loss days, and related costs among privately insured U.S. patients with TRD and key physical conditions compared with patients with the same physical conditions who either had non-TRD MDD or did not have MDD.
Methods
Data Source
The Optum Health Care Solutions commercial insurance claims database (July 1, 2009-March 31, 2017) was used. This database contains information on 19.1 million privately insured individuals nationwide, including claimant demographics and insurance eligibility; medical and prescription drug claims; and short- and long-term disability claims, salary, and employment status for a subset of patients. This database only contains de-identified data that fully comply with the patient confidentiality requirements of the Health Insurance Portability and Accountability Act. Per Title 45 of Code of Federal Regulations, Part 46.101(b)(4),18 the analysis of our study is exempt from institutional review for the following reasons: (a) it is a retrospective analysis of existing data (hence no patient intervention or interaction), and (b) no patient-identifiable information is included in the claims dataset.
Study Design
A retrospective longitudinal matched cohort study design was used. Patients (between ages 18 and 64 years) with MDD and TRD and key physical conditions including cardiovascular,7,13 metabolic,12,14-16 and respiratory diseases13 or cancer13 (the TRD cohort) were matched and compared with 2 cohorts of patients with the same physical conditions who (a) had non-TRD MDD (the non-TRD MDD cohort) and (b) did not have MDD (the non-MDD cohort). The study period spanned from July 1, 2009, to March 31, 2017.
For patients in the TRD cohort, the index date was defined as the initiation of a third antidepressant treatment course after absence of response to 2 courses of adequate dose and duration within the same MDD episode. Adequate dose was defined as a starting dose recommended by the American Psychiatric Association treatment guidelines.19 Adequate duration was defined as at least 6 weeks of continuous therapy with no gaps longer than 14 days. For patients in the non-TRD MDD cohort, the index date was imputed after the first antidepressant so that the distribution of time elapsed from the first antidepressant to the imputed index date would mimic that observed in the TRD cohort. For patients in the non-MDD cohort, the index date was imputed after the start of continuous insurance eligibility so that the distribution of time elapsed from the start of insurance eligibility to the imputed index date would mimic that observed in the TRD cohort.
Baseline characteristics (including key physical conditions) were evaluated in the 6-month period before the index date, which was defined as the baseline period. Study outcomes were evaluated during the follow-up period. The follow-up period spanned from the index date to the earliest among the following events: (a) the end of continuous eligibility or data availability (March 31, 2017), (b) 2 years post-index date, or (c) among the non-MDD cohort, a diagnosis of MDD or an antidepressant claim.
Definition of Study Cohorts
Patients included in the TRD and non-TRD MDD cohorts met the following criteria: (a) ≥ 1 diagnosis of MDD (International Classification of Diseases, Ninth Revision, Clinical Modification [ICD-9-CM]: 296.2x, 296.3x; International Classification of Diseases, Tenth Revision, Clinical Modification [ICD-10-CM]: F32.x [excluding F32.8], F33.x [excluding F33.8]) during the study period; (b) ≥ 1 antidepressant claim of adequate dose and duration after January 1, 2010; (c) no claims for an antidepressant in the 6 months before the first antidepressant claim; and (d) ≥ 1 diagnosis for depression (ICD-9-CM: 296.2x, 296.3x, 300.4x, 311.x, 309.0x, or 309.1x; ICD-10-CM: F32.x, F33.x, F34.1, or F43.21) during the period from 6 months before the first antidepressant claim up to 2 years after the index date.
Those patients included in the TRD cohort were additionally required to start a third antidepressant treatment course after an absence of response to 2 antidepressant courses (including augmentation therapy with anticonvulsant, antipsychotic, lithium, psychostimulant, and thyroid hormone medications) of adequate dose and duration within 2 years of the first antidepressant claim. An absence of response was defined as a switch of an antidepressant (< 180 days after the end of the previous treatment), an addition of an antidepressant, or an initiation of an augmentation therapy.5 The criteria of < 180 days between treatment courses and no more than 2 years between the first antidepressant claim and the third antidepressant treatment course helped to ensure that the onset of TRD was identified within the same MDD episode.14
Patients included in the non-MDD cohort had neither claims for an antidepressant nor diagnoses for MDD before the index date or within ≥ 6 months afterward.
Finally, patients in all 3 cohorts met the following criteria: (a) no diagnosis for specific psychiatric conditions (i.e., psychosis, schizophrenia, bipolar disorder/manic depression, dementia, mental retardation, other specific delays in development, and pervasive developmental disorders) during the study period; (b) ≥ 6 months of continuous insurance eligibility before and after the index date; (c) ≥ 1 claim for a key physical health condition (i.e., cardiovascular, metabolic, and respiratory disease or cancer) during the baseline period; and (d) aged 18-65 years at the index date.
Outcome Measures
HRU and health care costs were reported by category, including inpatient, emergency department (ED), outpatient, and other services. Health care cost categories also included medical costs (i.e., sum of inpatient, ED, outpatient, and other costs); pharmacy costs; and total health care costs (sum of medical and pharmacy costs).
Work loss and related costs were evaluated for employees with available work loss information and included paid disability and medical-related absenteeism. Paid disability days and associated costs were obtained from the data directly. Days of medical-related absenteeism were imputed as the length of stay of inpatient admissions, 1 day for each ED visit, or a half a day for each outpatient and other visit, plus days when the patient was eligible for disability, but not yet receiving benefits. Costs of medical-related absenteeism were obtained based on the number of days of medical-related absenteeism and wage data. All outcomes were reported per patient per year; in patients with less than a year of follow-up, outcomes were extrapolated for the full year based on the available data. Costs were expressed in 2017 U.S. dollars and measured from a payer’s perspective. Physical condition-related outcomes were defined based on claims with a diagnosis for any of the key physical conditions (i.e., cardiovascular, metabolic, and respiratory diseases or cancer). Additionally, behavioral health-related outcomes were defined based on claims with an ICD-9-CM diagnosis between 290 and 319 (inclusive) or an ICD-10-CM diagnosis between F01 and F99 (inclusive).
Statistical Analysis
Patients with TRD were matched 1:1 to patients with non-TRD MDD and without MDD based on (a) the availability of work loss data (exact match) and (b) age, sex, year of the index date, geographical region, type of health care plan, and presence of each physical condition (propensity score match). The balance of baseline characteristics between cohorts after matching was assessed with standardized differences (< 10% indicated balance). HRU and work loss outcomes during the follow-up period were compared between matched cohorts using unadjusted negative binomial regressions that accounted for the correlation between matched pairs. Results were reported as incidence rate ratios (IRRs) with 95% confidence intervals (CIs) and P values. Cost outcomes were reported as mean cost differences between matched cohorts, which were estimated using unadjusted ordinary least squares regressions; to account for a nonnormal distribution of cost data, 95% CIs and P values were obtained from nonparametric bootstrap procedures with 500 replications.
Results
Of the 7,135 patients with TRD who met study selection criteria, 2,317 (32.5%) had ≥ 1 key co-occurring physical condition. Among 45,690 patients with non-TRD MDD who met study inclusion criteria, 13,003 (28.5%) had ≥ 1 key co-occurring physical condition. A total of 2,317 patients from the TRD cohort were matched 1:1 to patients with non-TRD MDD and without MDD.
Baseline Characteristics
After matching, cohorts were well balanced in terms of demographic characteristics and key physical conditions (Table 1). In the 3 cohorts, mean age was 47.3-47.7 years; 62.4%-64.8% were female. Mean Quan-Charlson Comorbidity Index was 0.9 in the TRD cohort and 0.8 in the non-TRD MDD and non-MDD cohorts. Between 51.1% and 52.5% of patients in each cohort had cardiovascular disease, 47.7% and 48.2% had a metabolic disease, 16.0% and 16.4% had a respiratory disease, and 9.0% and 9.9% had cancer. The annualized mean (median) number of days with outpatient visits related to a key physical condition during the baseline period was 5.5 (4.0) in the TRD cohort, 5.4 (4.0) in the non-TRD MDD cohort, and 4.3 (2.0) in the non-MDD cohort.
TABLE 1.
Baseline Characteristics in Matched Cohortsa
| TRD Cohort n = 2,317 | Non-TRD MDD Cohort n = 2,317 | Std Diff, % | Non-MDD Cohort n = 2,317 | Std Diff, % | |
|---|---|---|---|---|---|
| Age, years, mean ± SD (median) | 47.6 ± 12.0 (50) | 47.3 ± 12.3 (50) | 2.1 | 47.7 ± 12.0 (50) | 1.4 |
| Female, n (%) | 1,463 (63.1) | 1,501 (64.8) | 3.4 | 1,445 (62.4) | 1.6 |
| Year of index date, n (%) | |||||
| 2010 | 302 (13.0) | 308 (13.3) | 0.8 | 334 (14.4) | 4.0 |
| 2011 | 532 (23.0) | 565 (24.4) | 3.4 | 543 (23.4) | 1.1 |
| 2012 | 423 (18.3) | 447 (19.3) | 2.7 | 414 (17.9) | 1.0 |
| 2013 | 344 (14.8) | 318 (13.7) | 3.2 | 302 (13.0) | 5.2 |
| 2014 | 295 (12.7) | 287 (12.4) | 1.0 | 306 (13.2) | 1.4 |
| 2015 | 238 (10.3) | 224 (9.7) | 2.0 | 232 (10.0) | 0.9 |
| 2016 | 183 (7.9) | 168 (7.3) | 2.4 | 186 (8.0) | 0.5 |
| Geographic region, n (%) | |||||
| South | 812 (35.0) | 824 (35.6) | 1.1 | 837 (36.1) | 2.3 |
| Midwest | 578 (24.9) | 552 (23.8) | 2.6 | 534 (23.0) | 4.4 |
| Northeast | 495 (21.4) | 505 (21.8) | 1.0 | 512 (22.1) | 1.8 |
| West | 303 (13.1) | 303 (13.1) | 0 | 305 (13.2) | 0.3 |
| Unknown | 129 (5.6) | 133 (5.7) | 0.7 | 129 (5.6) | 0 |
| Type of health care plan, n (%) | |||||
| Preferred provider organization | 1,710 (73.8) | 1,703 (73.5) | 0.7 | 1,722 (74.3) | 1.2 |
| Point of service plan | 320 (13.8) | 335 (14.5) | 1.9 | 320 (13.8) | 0 |
| Indemnity plan (i.e., fee for service) | 236 (10.2) | 234 (10.1) | 0.3 | 224 (9.7) | 1.7 |
| Other health care plan | 51 (2.2) | 45 (1.9) | 1.8 | 51 (2.2) | 0 |
| Relationship to health care plan holder, n (%) | |||||
| Employee | 1,324 (57.1) | 1,375 (59.3) | 4.5 | 1,406 (60.7) | 7.2 |
| Available work loss data | 278 (12.0) | 278 (12.0) | 0 | 278 (12.0) | 0 |
| Spouse | 805 (34.7) | 745 (32.2) | 5.5 | 764 (33.0) | 3.7 |
| Child | 186 (8.0) | 194 (8.4) | 1.3 | 144 (6.2) | 7.1 |
| Other/unknown | 2 (0.1) | 3 (0.1) | 1.3 | 3 (0.1) | 1.3 |
| Quan-CCI, 21 mean ± SD (median) | 0.9 ± 1.3 (1) | 0.8 ± 1.3 (0) | 4.7 | 0.8 ± 1.2 (0) | 10.0 |
| Number of unique agents, mean ± SD (median) | |||||
| AD agents | 1.8 ± 0.8 (2) | 1.1 ± 0.6 (1) | 104.1 | – | – |
| Psychiatric agentsb | 3.2 ± 1.5 (3) | 1.7 ± 1.1 (1) | 116.3 | 0.1 ± 0.3 (0) | 289.7 |
| Key physical conditions, n (%) | 2,317 (100.0) | 2,317 (100.0) | 0 | 2,317 (100.0) | 0 |
| Cardiovascular disease | 1,216 (52.5) | 1,183 (51.1) | 2.9 | 1,206 (52.1) | 0.9 |
| Metabolic diseases | 1,116 (48.2) | 1,114 (48.1) | 0.2 | 1,106 (47.7) | 0.9 |
| Respiratory diseases | 381 (16.4) | 371 (16.0) | 1.2 | 381 (16.4) | 0 |
| Cancer | 221 (9.5) | 208 (9.0) | 1.9 | 229 (9.9) | 1.2 |
| Key behavioral health conditions, n (%) | 995 (42.9) | 630 (27.2) | 33.5 | 80 (3.5) | 105.9 |
| Anxiety | 854 (36.9) | 546 (23.6) | 29.3 | 43 (1.9) | 98.8 |
| Substance use disorder | 263 (11.4) | 124 (5.4) | 21.8 | 37 (1.6) | 40.4 |
| Total health care costs, 2017 USD, per patient per year, mean ± SD (median) | 30,039 ± 70,215 (11,271) | 20,247 ± 58,084 (6,021) | 15.2 | 12,622 ± 42,994 (2,827) | 29.9 |
| Medical costs | 25,262 ± 67,882 (6,750) | 17,152 ± 56,192 (3,518) | 13.0 | 10,738 ± 42,063 (1,552) | 25.7 |
| Pharmacy costs | 4,777 ± 12,529 (2,155) | 3,094 ± 9,887 (956) | 14.9 | 1,884 ± 6,514 (318) | 29.0 |
| Follow-up time, months, mean ± SD (median) | 19.7 ± 6.1 (24) | 20.5 ± 5.6 (24) | 13.8 | 19.8 ± 5.9 (24) | 2.5 |
a Patients were matched on exact matching factors (i.e., availability of work loss data) and the propensity score (the probability of being in the TRD cohort vs. the non-TRD MDD or non-MDD cohort), modeled using logistic regression adjusted for categoric age, sex, year of the index date, each key physical health condition, geographic region, and type of health care plan.
b Includes antidepressants as well as anxiolytics, anticonvulsants/mood stabilizers, antipsychotics, psychostimulants, thyroid hormone (T3), and lithium.
AD = antidepressant; MDD = major depressive disorder; Quan-CCI = Quan-Charlson Comorbidity Index; SD = standard deviation; Std Diff = standardized difference; TR D = treatment-resistant depression; USD = U.S. dollars.
Given that cohorts were not matched on the presence of behavioral health conditions, anxiety and substance use disorder (SUD) were more common in the TRD cohort (anxiety, 36.9%; SUD, 11.4%) than the non-TRD MDD (anxiety, 23.6%; SUD, 5.4%) and non-MDD cohorts (anxiety, 1.9%; SUD, 1.6%). Among patients with TRD, 69.0% used a selective serotonin reuptake inhibitor, 31.5% a norepinephrine-dopamine reuptake inhibitor, 30.6% a serotonin-norepinephrine reuptake inhibitor, 19.0% a serotonin modulator, 9.5% tricyclics or tetracyclics, and 8.1% norepinephrine-serotonin modulators during the baseline period. A total of 278 (12.0%) patients in each cohort had work loss data available and were included in the analysis of work loss outcomes. The mean duration of follow-up was 19.7 months in patients with TRD, 20.5 months in patients with non-TRD MDD, and 19.8 months in patients without MDD; the median was 24 months in all cohorts.
Health Care Resource Utilization
Relative to patients with non-TRD MDD, those with TRD had higher all-cause HRU. Specifically, patients with TRD annually had 46% more inpatient admissions, 28% more ED visits, and 53% more outpatient visits than those with non-TRD MDD (all P < 0.05; Figure 1). With respect to physical condition-related HRU, patients with TRD annually had 44% more ED visits and 23% more outpatient visits than patients with non-TRD MDD (all P < 0.01).
FIGURE 1.
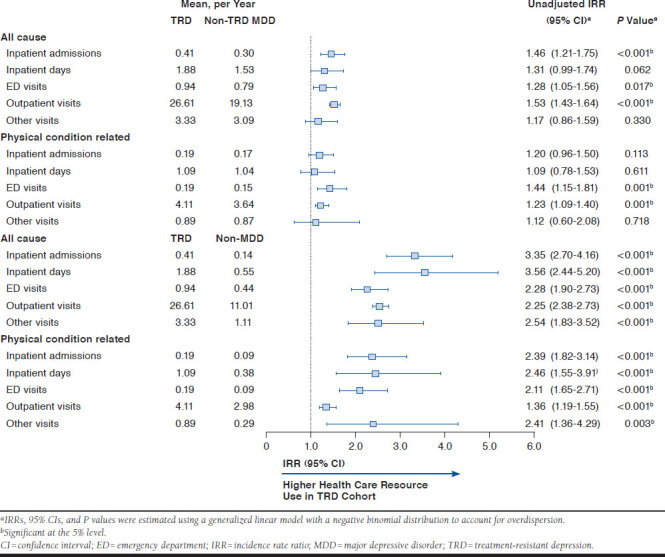
All-Cause and Physical Condition-Related Health Care Resource Use During Follow-Up Period (N = 2,317 per Cohort)
When using the non-MDD cohort as comparator, the TRD cohort annually had 3.4 times more all-cause inpatient admissions, 3.6 times more all-cause inpatient days, 2.3 times more all-cause ED visits, 2.6 times more all-cause outpatient visits, and 2.5 times more all-cause other visits (all P < 0.01). The TRD cohort also had higher physical condition-related HRU in all categories, including 2.4 times more inpatient admissions, 2.5 times more inpatient days, 2.1 times more ED visits, 1.4 times more outpatient visits, and 2.4 times more other visits (all P < 0.01).
Health Care Costs
Relative to patients with non-TRD MDD, patients with TRD incurred $5,091 higher all-cause health care costs annually (P < 0.01). This difference was predominantly driven by $2,423 higher outpatient and $2,295 higher pharmacy costs (all P < 0.01; Figure 2). Physical condition-related medical costs were similar between the TRD and non-TRD MDD cohorts (Figure 3). About 55% of the difference in all-cause health care costs between these 2 cohorts was due to higher behavioral health-related costs in the TRD cohort (mean: TRD, $4,270; non-TRD MDD, $1,458; P < 0.01).
FIGURE 2.
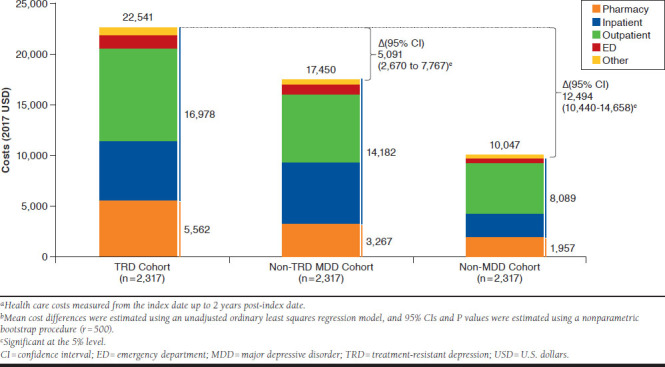
Mean Annual All-Cause Health Care Costs (2017 USD) During Follow-Up Perioda,b
FIGURE 3.
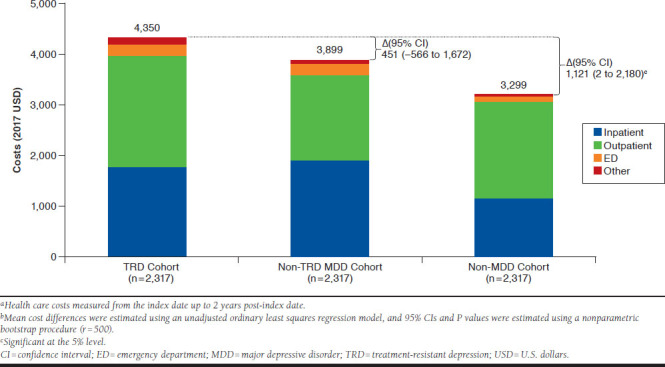
Mean Annual Physical Condition-Related Medical Costs (2017 USD) During Follow-Up Perioda,b
Relative to patients in the non-MDD cohort, those in the TRD cohort had $12,494 higher all-cause health care costs annually (P < 0.001), a difference mainly driven by $4,280 higher outpatient costs, $3,605 higher pharmacy costs, and $3,462 higher inpatient costs (all P < 0.01; Figure 2). Physical condition-related medical costs were $1,121 higher in the TRD versus non-MDD cohort annually (P < 0.05; Figure 3). About 34% of the difference in all-cause health care costs between the 2 cohorts was due to higher behavioral health-related costs in the TRD cohort (mean: TRD, $4,270; non-MDD, $69; P < 0.01), and about 9% due to higher physical condition-related medical costs.
Work Loss Days
Patients with TRD had twice as much all-cause work loss annually (P < 0.01), including 31% more medical-related absenteeism and 2.5 times more disability time than those with non-TRD MDD (all P < 0.01); physical condition-related work loss was similar between both cohorts (Figure 4).
FIGURE 4.
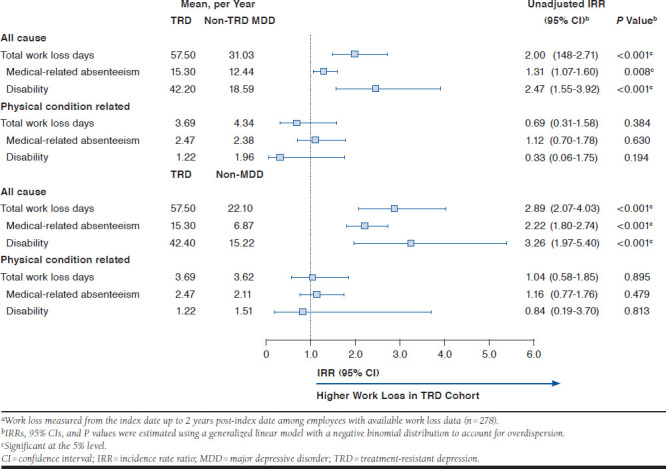
All-Cause and Physical Condition-Related Work Loss (Days) During Follow-Up Period (N = 278 per Cohort)a
Compared with patients without MDD, those with TRD incurred 2.9 times more all-cause work loss annually (P < 0.01), including 2.2 times more medical-related absenteeism and 3.3 times more disability time (all P < 0.01); physical condition-related work loss was similar between cohorts.
Costs Related to Work Loss
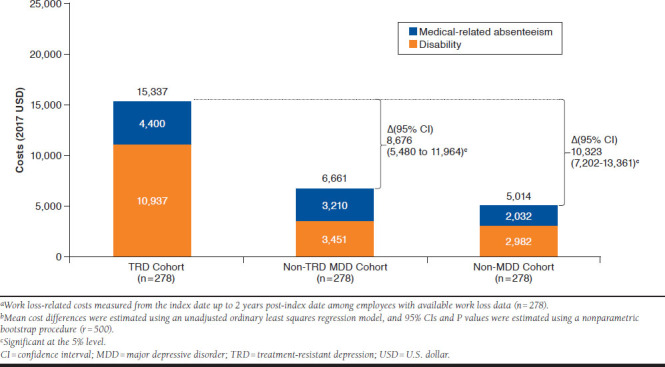
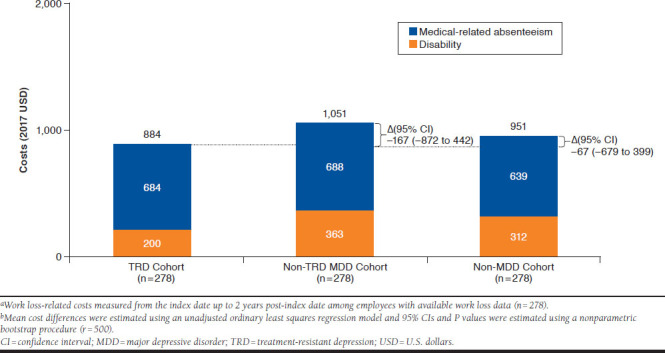
Patients with TRD had $8,676 higher all-cause work loss costs annually, relative to patients with non-TRD MDD, a difference driven by $7,487 higher disability costs (all P < 0.01; Appendix A, available in online article); medical-related absenteeism costs were not significantly different between cohorts. About 47% of all-cause work loss cost difference was due to higher behavioral health-related costs in the TRD cohort (mean: TRD, $5,502; non-TRD MDD, $1,392; P < 0.01). Physical condition-related work loss costs were similar between cohorts (Appendix B, available in online article).
Relative to patients without MDD, those with TRD had $10,323 higher all-cause work loss costs annually (P < 0.01; Appendix A), including $7,955 higher disability costs and $2,367 higher medical-related absenteeism costs (P < 0.01). About 48% of all-cause work loss cost difference was due to higher behavioral health-related costs in the TRD cohort (means: TRD, $5,502; non-TRD MDD, $521; P < 0.01). Physical condition-related work loss costs were similar between these cohorts (Appendix B).
Discussion
In this real-world observational study, the economic burden of TRD was assessed in a population of patients with the following physical conditions: cardiovascular, metabolic, respiratory diseases and cancer.
In this population, all-cause health care costs of patients with TRD were 30% higher than those of patients with non-TRD MDD and more than double those of patients without MDD. Physical condition-related health care costs were similar between patients with TRD and non-TRD MDD. Higher physical condition-related health care costs in the TRD cohort nonetheless explained 9% of the difference in all-cause health care costs between the TRD and non-MDD cohort. Fifty-five percent of the difference in all-cause health care costs between the TRD and non-TRD MDD cohorts was due to higher behavioral health-related costs in the TRD cohort; this proportion was 34% for TRD versus non-MDD comparison.
Mean all-cause health care costs observed in the present study among patients with TRD were high. Specifically, these were about 30% higher than costs reported for the same cohorts in a previous study in commercially insured patients selected regardless of the presence of physical conditions.5 Higher mean costs in the current study may reflect the additional costs of physical conditions, although differences in study design (particularly, the index date definition) may also contribute to them. Indeed, the index date of the TRD cohort corresponded to the initiation of a third antidepressant in the current study, whereas Amos et al. (2018) defined it as the initiation of the first antidepressant.5 The cost differences between the TRD and non-TRD MDD cohorts (present study, $5,091; Amos et al., $7,471), as well as between the TRD versus non-MDD cohorts (present study, $12,494; Amos et al., $12,479) were comparable in both studies.5 This suggests that the interaction of TRD and physical conditions might not substantially change the overall burden of TRD.
The interplay between co-occurring physical conditions and MDD is complex and is not fully understood. Some indirect evidence from the present study suggest that TRD or MDD might negatively affect the course or management of preexisting physical conditions. Specifically, HRU and total health care costs related to physical conditions were higher among patients with TRD relative to patients without MDD. Although no statistically significant difference in health care costs related to physical conditions was found between the TRD and non-TRD MDD cohorts, patients with TRD had more ED visits due to physical conditions relative to patients with non-TRD MDD. MDD might complicate management of physical conditions or have a negative impact on their course through various channels. For example, patients with mental illness have been reported to have inadequate access to health care.20 Moreover, the use of certain antidepressants or adjunctive treatments may play a role as well. Specifically, potential drug-drug interactions may hinder the optimal treatment of certain physical conditions. For safety reasons the use of some antidepressants requires additional monitoring in patients with MDD presenting with specific comorbidities,19 thereby also increasing HRU and costs. Further research is required to explore the relationship between TRD and the severity of physical conditions.
Previous studies have shown that co-occurring physical conditions are associated with lower rates of response to antidepressants.10,11 Although this body of evidence suggests that physical conditions may in turn contribute to TRD, data from the current study are insufficient to further substantiate this hypothesis.
With respect to the indirect economic burden among patients with physical conditions, patients with TRD in this study had all-cause work loss-related costs more than double those of patients with non-TRD MDD and triple those of patients without MDD. Work loss costs related to physical conditions were similar between the cohorts, and higher behavioral health-related costs in the TRD cohort explained just less than 50% of the difference in all-cause work loss-related costs between the cohorts. Interestingly, the incremental work loss-related costs of TRD were not dramatically different when using patients with non-TRD MDD or without MDD as a comparison basis. This seems to suggest that the majority of indirect cost burden related to work loss among medically treated patients with MDD is driven by TRD rather than by non-TRD MDD.
Overall, the results from the current study provide evidence that TRD is associated with substantial economic burden in patients with physical conditions.
Limitations
The present study is subject to several limitations. First, the algorithm used to identify patients with TRD relied solely on pharmacy claims, and clinical considerations to assess absence of response could not be incorporated. Although the most common definition of TRD was used (i.e., no response to ≥ 2 antidepressant treatment courses),4 there is no consensus definition endorsed by clinical guidelines.
Second, patients included in the non-TRD MDD cohort may have been in remission at the time of their randomly imputed index date, which may have impacted the magnitude of differences in HRU, costs, and work loss-related outcomes. Third, although exact and propensity score-based matching techniques were used to minimize the potential confounding, comparisons may be subject to residual biases due to unmeasured patient characteristics.
Fourth, for patients with less than 1 year of follow-up, annual costs were extrapolated to 1 year based on available data. Fifth, available work loss-related data did not capture presenteeism. Sixth, results of this study might not be generalizable to patients covered by other types of insurance plans (e.g., Medicare, Medicaid) or the uninsured; results in patients with work loss information available might not be generalizable to all patients with commercial insurance plans.
Seventh, the requirement of at least 1 claim with a diagnosis for physical condition might have resulted in the inclusion of some patients with a rule-out diagnosis on a claim. In this case, the levels of reported HRU and costs in all cohorts might be underestimated. Lastly, as with all claims-based studies, analyses are subject to the possibility of inherent limitations related to inaccuracies due to coding errors and missing data.
Conclusions
In patients with physical conditions, those who additionally had TRD incurred higher HRU and health care costs relative to patients with non-TRD MDD or without MDD. Moreover, patients with TRD incurred higher medical costs related to physical conditions compared with patients without MDD, which suggests that presence of TRD might complicate clinical management of physical conditions or have a negative impact on the course of the disease. TRD was also associated with substantially higher work loss and related costs. Notably, in the TRD cohort, work loss-related costs were more than 2-fold higher versus non-TRD MDD cohort and 3-fold higher versus non-MDD cohort.
ACKNOWLEDGMENTS
Writing assistance was provided by Samuel Rochette, an employee of Analysis Group, which provided paid consulting services to JSA for the conduct of this study.
APPENDIX A. Mean Annual All-Cause Work Loss-Related Costs (2017 USD) During Follow-Up Perioda,b
APPENDIX B. Mean Annual Physical Condition-Related Work Loss Costs (2017 USD) During Follow-Up Perioda,b
REFERENCES
- 1.Substance Abuse and Mental Health Services Administration. Key substance use and mental health indicators in the United States: results from the 2018 National Survey on Drug Use and Health. HHS Publication No. PEP19-5068. NSDUH Series H-54. August 2019. Available at: https://www.samhsa.gov/data/sites/default/files/cbhsq-reports/NSDUHNationalFindingsReport2018/NSDUHNationalFindingsReport2018.pdf. Accessed June 3, 2020.
- 2.National Institute of Mental Health. Major depression. February 2019. Available at: https://www.nimh.nih.gov/health/statistics/major-defrpression.shtml. Accessed June 3, 2020.
- 3.Joshi K, Zhdanava M, Pilon D, Lefebvre P, Sheehan J. Health care use and associated cost among patients with treatment-resistant depression across payers: a comprehensive analysis. Poster presented at: 2019 AMCP Annual Meeting; March 25-28, 2019; San Diego, CA. Available at: https://www.jmcp.org/doi/pdf/10.18553/jmcp.2019.25.issue-3-a. Accessed June 10, 2020. [Google Scholar]
- 4.Gaynes B, Asher G, Gartlehner G, et al. Definition of treatment-resistant depression in the Medicare population. February 9, 2019. Available at: https://www.ncbi.nlm.nih.gov/books/NBK526366/. Accessed June 3, 2020. [PubMed]
- 5.Amos TB, Tandon N, Lefebvre P, et al. Direct and indirect cost burden and change of employment status in treatment-resistant depression: a matched-cohort study using a U.S. commercial claims database. J Clin Psychiatry. 2018;79(2):17m11725. [DOI] [PubMed] [Google Scholar]
- 6.Pilon D, Joshi K, Sheehan JJ, et al. Burden of treatment-resistant depression in Medicare: a retrospective claims database analysis. PLoS One. 2019;14(10):e0223255. [DOI] [PMC free article] [PubMed] [Google Scholar]
- 7.Olfson M, Amos TB, Benson C, McRae J, Marcus SC. Prospective service use and health care costs of Medicaid beneficiaries with treatment-resistant depression. J Manag Care Spec Pharm. 2018;24(3):226-36. Available at: https://www.jmcp.org/doi/10.18553/jmcp.2018.24.3.226. [DOI] [PMC free article] [PubMed] [Google Scholar]
- 8.Pilon D, Sheehan JJ, Szukis H, et al. Medicaid spending burden among beneficiaries with treatment-resistant depression. J Comp Eff Res. 2019;8(6):381-92. [DOI] [PubMed] [Google Scholar]
- 9.Ivanova JI, Birnbaum HG, Kidolezi Y, Subramanian G, Khan SA, Stensland MD. Direct and indirect costs of employees with treatment-resistant and non-treatment-resistant major depressive disorder. Curr Med Res Opin. 2010;26(10):2475-84. [DOI] [PubMed] [Google Scholar]
- 10.Iosifescu DV, Nierenberg AA, Alpert JE, et al. The impact of medical comorbidity on acute treatment in major depressive disorder. Am J Psychiatry. 2003;160(12):2122-27. [DOI] [PubMed] [Google Scholar]
- 11.Trivedi MH, Rush AJ, Wisniewski SR, et al. Evaluation of outcomes with citalopram for depression using measurement-based care in STAR*D: implications for clinical practice. Am J Psychiatry. 2006;163(1):28-40. [DOI] [PubMed] [Google Scholar]
- 12.Pilon D, Szukis H, Joshi K, et al. US integrated delivery networks perspective on economic burden of patients with treatment-resistant depression: a retrospective matched-cohort study. Pharmacoecon Open. 2020;4(1):119-31. [DOI] [PMC free article] [PubMed] [Google Scholar]
- 13.Greenberg P, Corey-Lisle PK, Birnbaum H, Marynchenko M, Claxton A. Economic implications of treatment-resistant depression among employees. Pharmacoeconomics. 2004;22(6):363-73. [DOI] [PubMed] [Google Scholar]
- 14.Kubitz N, Mehra M, Potluri RC, Garg N, Cossrow N. Characterization of treatment resistant depression episodes in a cohort of patients from a U.S. commercial claims database. PLoS One. 2013;8(10):e76882. [DOI] [PMC free article] [PubMed] [Google Scholar]
- 15.Rizvi SJ, Grima E, Tan M, et al. Treatment-resistant depression in primary care across Canada. Can J Psychiatry. 2014;59(7):349-57. [DOI] [PMC free article] [PubMed] [Google Scholar]
- 16.Parikh RM, Lebowitz BD. Current perspectives in the management of treatment-resistant depression. Dialogues Clin Neurosci. 2004;6(1):53-60. [DOI] [PMC free article] [PubMed] [Google Scholar]
- 17.Gaynes BN. Identifying difficult-to-treat depression: differential diagnosis, subtypes, and comorbidities. J Clin Psychiatry. 2009;70(Suppl 6):10-15. [DOI] [PubMed] [Google Scholar]
- 18.U.S. Department of Health and Human Services. 45 CFR 46: pre-2018 requirements. February 16, 2016. Available at: https://www.hhs.gov/ohrp/regulations-and-policy/regulations/45-cfr-46/index.html#46.101. Accessed June 3, 2020.
- 19.Gelenberg AJ, Freeman MP, Markowitz JC; American Psychiatric Association. Practice guidelines for treatment of patients with major depressive disorder. 3rd ed. October 2010. Available at: https://psychiatryonline.org/pb/assets/raw/sitewide/practice_guidelines/guidelines/mdd.pdf. Accessed June 3, 2020.
- 20.Firth J, Siddiqi N, Koyanagi A, et al. The Lancet Psychiatry Commission: a blueprint for protecting physical health in people with mental illness. Lancet Psychiatry. 2019;6(8):675-712. [DOI] [PubMed] [Google Scholar]
- 21.Quan H, Sundararajan V, Halfon P, et al. Coding algorithms for defining comorbidities in ICD-9-CM and ICD-10 administrative data. Med Care. 2005;43:1130-39. [DOI] [PubMed] [Google Scholar]


