

Summary
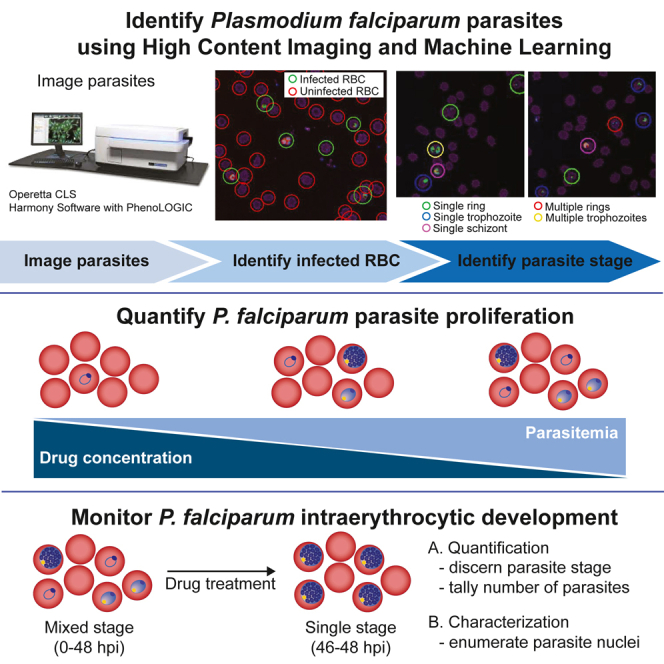
In 2021, Plasmodium falciparum was responsible for 619,000 reported malaria-related deaths. Resistance has been detected to every clinically used antimalarial, urging the development of novel antimalarials with uncompromised mechanisms of actions. High-content imaging allows researchers to collect and quantify numerous phenotypic properties at the single-cell level, and machine learning-based approaches enable automated classification and clustering of cell populations. By combining these technologies, we developed a method capable of robustly differentiating and quantifying P. falciparum asexual blood stages. These phenotypic properties also allow for the quantification of changes in parasite morphology. Here, we demonstrate that our analysis can be used to quantify schizont nuclei, a phenotype that previously had to be enumerated manually. By monitoring stage progression and quantifying parasite phenotypes, our method can discern stage specificity of new compounds, thus providing insight into the compound’s mode of action.
Keywords: Plasmodium falciparum, drug discovery, drug resistance, high-content imaging, machine learning, malaria, parasites
Graphical abstract
Highlights
-
•
Automatic identification of red blood cells infected with Plasmodium falciparum
-
•
High-content imaging paired with ML classification quantifies asexual blood stages
-
•
Drug-response phenotyping and enumeration of nuclei within P. falciparum schizonts
-
•
Improves on labor-intensive light microscope-based manual identification and counts
Motivation
Enumeration of Plasmodium falciparum asexual blood stages is fundamental to determining the potency of antimalarial compounds. Differentiation and quantification of asexual stages sheds light on what parasite processes these antimalarial compounds target. Light microscopy remains the mainstay for differentiating asexual stages, but this process is time consuming, requires extensive training, and can be variable between microscopists. To streamline this process, we developed a high-content imaging- and machine learning-based analysis that builds upon previous reports of parasite quantification.14 Here, our added contribution is to automatically discern and enumerate P. falciparum asexual blood stages and subcellular organelles within malaria parasites. We demonstrate that this method can robustly classify asexual stages and be further utilized to quantify stage-specific phenotypes and can enumerate P. falciparum nuclei.
Many research and clinical-based laboratories manually quantify malaria parasites, which is labor and time intensive. Parasitemia reflects disease severity and efficacy of antimalarial compounds in the drug development pipeline. Rosenthal et al. report a high-content imaging-based approach that incorporates machine learning to automatically identify and characterize malaria parasites.
Introduction
Plasmodium, the causative agent of malaria, is an obligate intracellular parasite that was responsible for a reported 247 million cases and 619,000 deaths in 2021.1 Of the five species of Plasmodium that cause disease in humans, Plasmodium falciparum is both the most prevalent and the deadliest, responsible for over 90% of all malaria-related deaths.1 Asexual red blood cell (RBC) stages of Plasmodium are responsible for clinical disease symptoms such as the hallmark characteristic of periodic fevers and chills. Thus, patients are prompted to seek treatment during this period of infection. Antimalarials that target the asexual RBC stages reduce parasitemia within the patient, leading to alleviation of symptoms. The 48-h parasite replication cycle of intraerythrocytic stages can be subdivided into three stages based on morphology: rings, trophozoites, and schizonts. At the ring stage (0–23 h post-invasion [hpi]), parasite organelles are densely packed in a rim around the parasite’s periphery, forming a ring-like shape with a single nucleus.2 At the trophozoite stage (24–39 hpi), parasites increase in volume, and hemoglobin ingestion increases dramatically, leading to increased hemozoin formation.2 This allows trophozoites to be characterized by their larger size, visualization of hemozoin, and a single nucleus. At the schizont stage (40–48 hpi), parasites continue to increase in size and undergo multiple rounds of DNA replication and nuclear division, resulting in a larger parasite containing multiple nuclei.2 P. falciparum has developed resistance to all clinically used antimalarials, including artemisinin, the cornerstone of WHO-recommended first-line therapies for uncomplicated falciparum malaria.1 Assays capable of rapidly assessing parasitemia, differentiating asexual stages, and quantifying parasite morphology will lend traction to the development of new antimalarials and provide insight into their mode of action to avoid cross-resistance to existing drugs.
To date, light microscopy is the most widely used method to examine parasite morphology and determine the stage of asexual parasites, especially in academic laboratories and in the field. This method is simple and inexpensive but time consuming,3 leading to the development of semi-automated methods for parasitemia quantification including the [3H] hypoxanthine incorporation assay, which measures parasite metabolic activity4; plate reader assays, which use fluorescent indicators to stain for parasite DNA5,6,7,8 or Nitro Blue tetrazolium chloride for plasmodial lactate dehydrogenase (pLDH) activity9; ELISA assays for pLDH10 or histidine-rich protein 2 (HRP2)11; and flow cytometry assays.3,12 The technological simplicity, scalability, and rapid nature of plate reader assays prompted development of high-throughput adaptations that have been used to screen millions of compounds for antimalarial activity.7,9,13 However, these assays are limited in their capacity to monitor parasite phenotypes and quantify the proportion of each asexual stage. High-content imaging provides the best of both worlds, rapidly collecting a multitude of properties that can be used to quantify cells and cell phenotypes.
In P. falciparum, high-content imaging was first used to improve the sensitivity of traditional plate reader assays by quantifying individual parasites by DAPI-stained DNA puncta rather than total fluorescence intensity.14,7 To date, this method has been used to screen millions of compounds for antimalarial activity in high-throughput format.14,15,16,17 The sensitivity of this assay was further improved by using high-content imaging to quantify RBCs and to distinguish viable early ring, ring, trophozoite, and schizont stages in high-throughput format.18 RBCs were identified based on their geometric structure, and asexual stages were differentiated based on the number of DNA signals, number of mitochondrial signals, area between DNA signals, and distance between DNA signals.18
Parasite phenotypes have also been visualized and quantified with high-content screens using calcium-binding stains coupled with imaging flow cytometry-based assays19,20,21 and RNA-binding stains coupled with automated fluorescence microscopy-based assays.22 Fluo-4 has high affinity for Ca2+ in the parasite’s digestive vacuole (DV), and disruption of the DV results in leaking of Ca2+ into the parasite’s cytoplasm. By measuring the area of Fluo-4 staining in infected RBCs (iRBCs), researchers were able to screen 2,885 compounds for their ability to disrupt the parasite DV in a 96-well plate format.21 RNA stains serve as a marker for the parasite’s cytoplasm and can be used to monitor parasite size, shape, and transcriptional activity,22 allowing researchers to screen novel marine-derived compounds for their ability to induce phenotypic defects based on staining intensity and shape.23 RNA staining has also been used in high-throughput format to screen a library of compounds for gametocidal and gamete inhibition activity based on the ability of banana-shaped gametocyte stages to form circular-shaped gametes in the presence of xanthurenic acid.24 In addition, high-content imaging has been utilized in high-throughput format to screen compounds for their gametocidal activity using GFP-luciferase-expressing parasites,25 mitochondrial stains as a viability marker,26,27 and antibodies against the gamete-specific protein Pfs25.28 Further, high-content imaging methods have been utilized in high-throughput format to screen compounds that block liver stage infection, kill liver stage schizonts, and/or kill dormant hypnozoites by identifying liver stages based on size, shape, and intensity using fluorescent and immunofluorescent staining29,30,31,32 and by distinguishing actively replicating schizonts from dormant hypnozoites using alkyne-bearing purine nucleosides.33
Machine learning is a powerful tool to analyze the phenotypic data generated from high-content imaging. Previously, machine learning has been paired with high-content imaging to differentiate drug-sensitive or -resistant HCC4011 cancer cells in a heterologous population34 and to study host-pathogen interactions with Toxoplasma gondii and Salmonella enterica.35 More recently, machine learning has been applied to transgenic P. falciparum parasites expressing cytoplasmic localized GFP in order to differentiate asexual stages and predict the mode of action of new drugs by clustering drug-treated parasites based on morphological phenotypes.36 Here, we report a method using machine learning capabilities on high-content imaging to (1) identify and enumerate P. falciparum-infected RBCs, (2) robustly distinguish and quantify P. falciparum asexual blood stages, and (3) enumerate nuclei within P. falciparum schizonts. Since this method does not require genetically modified parasites, it can be applied to any P. falciparum strain. Leveraging the power of machine learning, we report a method that can determine the stage sensitivity of antimalarials and quantify stage-specific parasite morphological phenotypes.
Results
High-content imaging on the Operetta CLS was paired with Harmony High-Content Imaging and Analysis software with PhenoLOGIC (v.4.9) to quantify parasitemia, differentiate P. falciparum asexual stages, and enumerate nuclei within P. falciparum schizonts. In this work, we use Harmony built-in algorithms (these will be named “method xx,” for example) and software capabilities (e.g., the ability to distinguish properties) as building blocks to create two different analyses: (1) to quantify parasitemia with a 20× air objective and (2) to quantify asexual blood stages and parasite nuclei with a 40× water objective.
Bright field was used for RBC quantification at 20× magnification, while CellMask Orange plasma membrane stain (hereon referred to as Cell Mask) was used for RBC quantification at 40× magnification. Since mature human RBCs lack nuclei and mitochondria,37 the cell-permeable stains Hoechst 33342 (hereon referred to as Hoechst) and MitoTracker Deep Red (hereon referred to as MDR) were used to identify parasites by staining for parasite DNA and mitochondrial membrane potential, respectively. MDR, which stains positively in actively respirating parasites, was included to differentiate live from dead parasites so that only viable parasites were included in quantifications. To identify asexual stages and visualize parasite morphology at 40× magnification, the RNA stain SYTO RNASelect (hereon referred to as SYTO) was utilized to discern parasite cytoplasm.22,23 For 20× imaging, cells can be imaged live or fixed using an aldehyde-based fixative. For 40× imaging, cells should only be imaged live, as fixatives for MDR and SYTO are incompatible.
Selecting RBCs using a 20× air objective
Our first objective was to identify P. falciparum-infected RBCs, which can be singly or multiply infected with ring-stage (Figure 1, panels in rows 1 and 2), trophozoite-stage (Figure 1, panels in rows 3 and 4), or schizont-stage (Figure 1, panels in rows 5 and 6) parasites. To quantify parasitemia, which is the total number of parasites per total number of RBCs, we first sought to identify RBCs. A 20× air objective was used to capture a single plane per channel. The depth of focus for the 20× air objective is 8 μm. This is sufficient to capture the entire parasite and allow for variability in focus height between fields of view. The 20× water objective was not chosen since the depth of focus is only 1.8 μm, the increase in resolution (0.79 μm for 20× air vs. 0.66 μm for 20× water) was not sufficient to differentiate asexual parasite stages, and imaging time as well as data file size would have significantly increased. The workflow for the 20× air analysis is provided (Figure 2A). For the description of the workflow for 20× image acquisition and analyses, “step 1, 2, etc.” refer to the detailed steps, which can be found in method details, Operetta 20× image acquisition and analysis. RBCs were visualized using the bright-field channel (Figure 2B). RBCs are biconcave,38 which resulted in the appearance of two concentric circles, each recognized as an individual cell. Additionally, every spike on an echinocyte was identified as a separate object. To overcome these challenges, a Gaussian filter was first applied with a width of 3.5 pixels (px) (2.1 μm; step 2; Figure 2C) to smooth any biconcave or echinocyte appearances. Then, this image was inverted (step 3; Figure 2D), since the software recognizes light and not dark areas.
Figure 1.

Fluorescent asexual stages
Cells were stained with Hoechst 33342 for parasite nuclei, MitoTracker Deep Red for functional mitochondria, SYTO RNASelect for parasite RNA, and CellMask Orange plasma membrane stain for red blood cell plasma membrane and then imaged on an Operetta CLS with a 40× water objective. Shown are representative images from top to bottom of red blood cells infected with a single ring, multiple rings, a single trophozoite, multiple trophozoites, a single schizont, or multiple schizonts. In the merged panel, Hoechst, MitoTracker Deep Red, SYTO RNASelect, and CellMask Orange plasma membrane stain are false colored and indicated in blue, red, green, and purple, respectively. Scale bar: 5 μm.
Figure 2.

20× image analysis
Parasites were stained with Hoechst, indicated in blue, for parasite nuclei and MitoTracker Deep Red (MDR), indicated in red, for functional mitochondria. Red blood cells (RBCs) were visualized by bright field and stained with CellMask Orange plasma membrane stain, which is false colored in purple. The bright-field channel was used to identify RBCs in this analysis, while CellMask Orange plasma membrane stain was only included to better visualize parasitized RBCs. Cells were imaged with a 20× air objective on an Operetta CLS.
(A–F) Listed is (A) the workflow to quantify parasitemia using Harmony High-Content Imaging and Analysis software with PhenoLOGIC (v.4.9). The (B) bright-field input image was first filtered using a Gaussian smoothing filter with a width of 3.5 pixels (2.1 μm), yielding the output image (C) “Gaussian smoothed.” This image was then (D) inverted so that RBCs would be highlighted, yielding the output image “inverted.” Using the “inverted” output image, (E) RBCs were identified using “method M,” indicated by rainbow circles. Using bright-field intensity and cell morphology properties, (F) background and cells on a different focus height were excluded, indicated by pink circles, and RBCs were selected, filled in green.
(G and H) From the selected RBC population, outlined in white, (G) Hoechst spots and (H) MDR spots were identified, circled in yellow.
(I–K) RBCs with at least one Hoechst spot and at least one MitoTracker spot were classified as “infected RBCs,” indicated by yellow circles. Scale bar: 50 μm. To validate this image analysis, asynchronous GC03 and Dd2 parasites were treated for 72 h over a range of chloroquine (CQ) concentrations. For each replicate, parasitemia was determined by flow cytometry (FC) and high-content imaging (20×). At least 10,000 RBCs were analyzed per treatment concentration by each method. Shown are (J) dose-response curves and (K) mean IC50 values ± standard error of the mean (SEM) from three independent experiments. No significant difference (ns) was detected between FC and high-content imaging using a Student’s t test.
As parasites mature, they remodel the host RBC, allowing iRBCs to adhere to the microvasculature, iRBCs, and RBCs.38 This makes accurate RBC quantification challenging due to clustering of RBCs. Many approaches have been used to segment clustered RBCs to estimate the total number of cells. Region growing,39 morphological image processing,40,41 distance transformation,42 and template matching43 have been used on Giemsa-stained thin blood smears. Osculating circle estimation paired to geometric calculations18 has been used to segment fluorescent stained RBCs. We found that by optimizing our seeding and washing technique, as described in the STAR Methods, we obtain a monolayer with a reduced percentage of overlapping RBCs. Our method, however, can identify distinct RBCs even if there is some overlap or if the RBC membranes are touching.
Using the “inverted” image output, “method M” (step 4; Figure 2E) was used to select cells. A diameter of 8 μm38 was selected, and the splitting sensitivity was set to 0.46 to maximize splitting of cells in close proximity but minimize splitting of individual cells. Splitting sensitivity is a unitless parameter, and this parameter and all other unitless parameters described below were determined empirically. To eliminate selection of background noise, bright-field morphology (step 5) and intensity (step 6) properties were calculated. Using these properties, only objects with cell areas between 15 and 200 μm2, cell roundness >0.6, ratio of width to length >0.35, and bright-field intensity contrast <−0.036 were selected (step 7; Figure 2F). Note that RBCs can be identified at 20× air magnification using a Cell Mask stain, but we chose to use bright field in order to increase the number of available channels for future studies.
Selecting RBCs with viable parasites using the 20× air objective
Hoechst and MDR stains were used to identify iRBCs at 20× air magnification. Using the “find spots” building block, “method C” was chosen to identify parasite nuclei (step 8; Figure 2G) and respirating mitochondria (step 9; Figure 2H). Maximum spot radius and minimum uncorrected spot to region intensity were set to 9.1 px (5.48 μm) and 0.6, respectively, to prevent selection of background staining (e.g. from lint, dust, or a scratched well). For Hoechst, the lower threshold for contrast was set to >0.5 to prevent selection of weaker background staining. Since background staining is higher using MDR, the lower threshold for contrast was set to >0.06. Cells with at least one Hoechst spot, at least one MDR spot, and a relative MDR spot intensity >0.014 were identified as infected with viable parasites (step 10; Figure 2I). Note that relative MDR spot gating intensity may need to be adjusted depending on inter-experiment variability. In order to calculate parasitemia (percentage of iRBCs), the number of infected cells was divided by the total number of RBCs, and this value was multiplied by 100 (step 11).
Validation of 20× analysis
Chloroquine 72-h growth inhibition assays were conducted on asynchronous chloroquine-sensitive GC03 and chloroquine-resistant Dd2 parasites.44 To validate our 20× analysis, parasitemia from cultures in the same experiment was determined simultaneously using high-content imaging and flow cytometry assays. Dose-response curves (Figure 2J) and half-maximal inhibitory concentration (IC50) values (Figure 2K) were similar for both assays. For GC03, we obtained IC50 values of 19.9 and 21.1 nM for flow cytometry and high-content imaging, respectively (Figure 2K). For Dd2, we obtained IC50 values of 320.9 and 326.8 nM for flow cytometry and high-content imaging, respectively (Figure 2K). These values are consistent with previously published reports.45,46,47
Selecting RBCs using a 40× water objective
Our second objective was to discern and differentiate asexual blood-stage P. falciparum parasites. Although our 20× air imaging and analysis method was able to quantify parasitemia, the resolution (at 0.79 μm) was too low to discriminate differences required to identify the various stages. Thus, we set out to differentiate asexual stages using a 40× water objective. A 63× water objective was not chosen since the small gain in resolution (0.33 μm for 40× water vs. 0.28 μm for 63× water) did not enhance stage identification, and the 2-fold reduction in the area per field of view (104,329 μm2 for 40× water vs. 42,025 μm2 for 63× water) would have significantly increased the image acquisition time. Increased image resolution using the 40× water objective (compared with 20× water) came with additional challenges, which were overcome with different imaging channels, smoothing filters, and cell parameters to identify cells and parasites, as described below. The workflow for the 40× water objective analysis is shown (Figure 3A). For the description of the workflow for 40× image acquisition and analyses, “step 1, 2, etc.” refer to the detailed steps, which can be found in method details, Operetta 40× image acquisition and analysis. For 40× imaging, 3D images were acquired by capturing ten planes for each field 0.5 μm apart. Since the depth of focus of the 40× water objective is only 1.2 μm, a z stack was needed to capture the entire parasite and allow for variability between focus heights on different fields of view. A 2D image was then obtained using maximum projection (step 1; Figure 3B). RBCs were selected using the Cell Mask channel since Cell Mask provided fewer details of RBC morphology than bright field, making RBC selection easier. Two smoothing filters were applied for RBC selection. First, median smoothing was applied using a scale of 2 px (600 nm; step 2; Figure 3C), which corresponds to the half-width of the kernel, defined as a 2D matrix of px. The median filtered image was then further filtered using the Gaussian filter with a width of 1 px (300 nm; step 3; Figure 3D), which corresponds to the standard deviation of the Gaussian filter. The median filter smooths the edges of RBCs, and the Gaussian filter smooths the surface of RBCs.
Figure 3.

40× image analysis
Cells were stained with Hoechst, indicated in blue, for parasite nuclei; MDR, indicated in red, for respirating parasite mitochondria; SYTO RNASelect, indicated in green, for parasite cytoplasm; and CellMask Orange plasma membrane stain, indicated in purple, for RBC plasma membranes. Ten planes were captured for each field on an Operetta CLS using a 40× water objective to create a maximum projection.
(A–D) Listed is (A) the workflow used to quantify parasite asexual blood stages with Harmony High-Content Imaging and Analysis software with PhenoLOGIC (v.4.9). To identify RBCs, the (B) input image was first filtered using a (C) median smoothing filter to smooth RBC edges. Then, a (D) Gaussian smoothing filter was applied to smooth RBC faces.
(E) RBCs were identified using “method P,” using the smoothed output image. Identified cells are indicated in rainbow coloring.
(F–H) Using cell morphology and intensity properties, background staining and doublet cells were excluded, circled in pink, allowing single RBCs to be selected, indicated in filled green. To identify RBCs containing viable parasites, (G) Hoechst spots and (H) MDR spots were selected using “method D.” The regions of interest (selected RBCs) are outlined in white, and selected spots are circled in yellow.
(I) RBCs that contained at least one Hoechst spot and at least one MDR spot were classified as infected RBCs, circled in yellow.
(J) Machine learning was used to classify these RBCs as infected with: single rings (SRs), circled in green; multiple rings (MRs), circled in red; single trophozoites (STs), circled in blue; multiple trophozoites (not shown); single schizonts (SSs), circled in pink; or multiple schizonts (not shown). Scale bar: 25 μm.
Using the Gaussian-filtered output image, cells were identified using “method P” (step 4; Figure 3E), which is recommended by PerkinElmer for splitting clustered cells and contains parameters for minimum area, splitting sensitivity, and common threshold. RBCs are approximately 8 μm in diameter,38 which would yield an area of approximately 50 μm2. However, if the “method P” algorithm detects a cell with an area smaller than the defined threshold, then that cell will be grouped with its closest neighbor. Therefore, we used a threshold of >24 μm2 so that overlapping cells would be selected as separate objects. A common threshold of 0.83 was used to identify cells, and a splitting sensitivity of 0.28 was used to maximize separation of overlapping cells and minimize splitting of single cells. To exclude background staining and selection of doublet cells, the following morphology properties of cells were calculated (step 5): width, length, and ratio of width to length. In addition, intensity properties were calculated for Cell Mask (step 6). Based on these calculated morphological and intensity values, we were able to use the size and shape of RBCs to exclude background staining and doublet cells with the following gating properties: width to length ratio >0.35, cell area between 20 and 60 μm2, cell width >3.5 μm, cell length <13.5 μm, and mean intensity >2,500 counts/px (step 7; Figure 3F). Note that intensity gating properties may need to be adjusted depending on inter-experiment variability. To minimize variance, the exposure time and percentage of power of each channel should be adjusted so that relative intensity is approximately 3,500–4,000 for all channels. Though this method allows for good separation of overlapping cells, we do not recommend exceeding 900 cells per field (104,329 μm2).
Selecting iRBCs with viable parasites using a 40× objective
To identify iRBCs, Hoechst and MDR channels were used. “Method D” was chosen to find spots with the Hoechst channel (step 8; Figure 3G) and the MDR channel (step 9; Figure 3H). This method was first used to correct for background staining with a parameter of 0.422 for Hoechst and of 0.8 for MDR. A higher background threshold value is set for the MDR channel to account for higher background with MDR vs. Hoechst stain. The detection sensitivity was set to 0.45 for Hoechst and to 0.4 for MDR. These sensitivity detection parameters are low enough to identify live parasites of the early ring stages but still exclude non-specific background staining. To quantify RBCs with live parasites, cells with ≥1 Hoechst spot and ≥1 MDR spot were selected (step 10; Figure 3I).
Identification of asexual stages
After selecting iRBCs using 40× imaging, we used Harmony’s PhenoLOGIC machine learning plugin to differentiate asexual blood stages (Figure 3J). PhenoLOGIC is a type of linear classifier where a human is initially needed to classify objects into desired outputs. The software learns from this training set and identifies which combination of properties are important for classifying objects. The more properties that are collected that productively aid in stage differentiation, the better the linear classifier script is at distinguishing asexual blood stages. Ring and trophozoite stages each contain one Hoechst and one MDR spot, while multinucleated schizont stages contain multiple Hoechst and MDR spots where each merozoite is developing (Figure 1). The number and organization of these spots has been used to differentiate ring, trophozoite, and schizont stages.18 We collected four spot properties for Hoechst and MDR channels from the “find spot” method (steps 8–9): total spot area, relative spot intensity, number of spots, and number of spots per area of cell. As parasites grow, the intensity and size of parasite nuclei, mitochondria, and cytosol staining increases, corresponding to parasite maturation.20,23 These properties were used to further distinguish asexual stages by collecting the following intensity properties for Hoechst, MDR, and SYTO channels (steps 11–13): mean, standard deviation, coefficient of variance, median, sum, maximum, minimum, and contrast. Texture properties of iRBCs were collected using the spots, edges, and ridges (SER) method for Hoechst (step 14; Figure S1), MDR (step 15; Figure S2), and SYTO (step 16; Figure S3) channels. This method uses eight different filters (spot, hole, edge, ridge, valley, saddle, bright, and dark) that highlight different patterns of staining intensity. Intensity properties are then calculated from the filtered image. Morphology properties of Hoechst, MDR, and SYTO were also calculated using the STAR Methods (steps 17–19). First, five profiles were generated, which define regions from the outermost part of the cell (profile 1) to the innermost part of the cell (profile 5) (Figure S4). Then, symmetry, threshold compactness, axial, radial, and profile properties were calculated for each region of an object for Hoechst, MDR, and SYTO channels. In total, 125 properties were collected and used for the linear classifier script.
To establish an accurate training set, parasites were first enriched for each asexual stage: ring stages (0–23 hpi), trophozoite stages (24–39 hpi), and schizont stages (40–48 hpi). We aimed to capture a broad range of parasites that fall within these three categories (Figure S5). Following stage isolation, purity of stage enrichment was assessed by light microscopy, which is currently the gold standard for stage identification. Purities of 96%–99%, 88%–93%, and 78%–80% were obtained for ring, trophozoite, and schizont stages, respectively (Figure S5). When grown in vitro, RBCs can be infected with multiple parasites, making automated stage identification challenging. For example, intensity of fluorescent staining will be high not only in RBCs containing schizonts but also in RBCs harboring multiple trophozoite stages (Figure 1). Additionally, RBCs containing single rings have very different intensity properties compared with RBCs containing multiple ring stages (Figure 1). Because of this, we defined six populations: single rings, multiple rings, single trophozoites, multiple trophozoites, single schizonts, and multiple schizonts (Figure 1). For the training set in categories of single rings, single trophozoites, or single schizonts, we manually identified at least 400 RBCs that were infected with one parasite using the linear classifier method in the “select population” building block (step 20). We also manually selected at least 100 RBCs that were infected with multiple parasites, which refers to the categories of multiple rings, multiple trophozoites, or multiple schizonts. The manually selected parasites in the training set served as data points that, in combination with emergent properties identified, allowed for the machine learning-based algorithm to identify parasite stages without further human input. The bright-field channel was used to aid in manually differentiating rings from trophozoites as well as singly from multiply iRBCs based on the presence of hemozoin. However, due to the variability of smooth RBCs and echinocytes, bright field did not provide useful SER or STAR properties for stage differentiation and was excluded from the analysis. Note that for accurate stage identification, it was essential to train the linear classifier with images from different samples acquired on different days, to account for variation in staining intensity, as well as a range of different parasite ages for each stage (Figure S5; e.g., early, mid, and late trophozoites), to aid in differentiating borderline stages (such as distinguishing late rings from early trophozoites).
For each population comparison, PhenoLOGIC software generates a scatterplot (Figure 4) and “goodness” score (Figure 4; Table S1) based on data from individual parasites that were manually curated in the training set in addition to parasites automatically identified by the algorithm. The scatterplot provides visualization of the spread and distribution of the two compared populations, as well as spread and distribution between human- and machine-selected parasites. Human-selected parasites are depicted in solid circles, while machine-selected parasites are depicted in open circles (Figure 4). The “goodness” of the separation is the signal-to-noise ratio based on the distance of the training points from the classifier line. In general, the higher the score, the better. This value expresses, to some extent, the quality of the separation, but it does not provide information about the distribution of classification results. The scatterplot is essential to fully understand the quality of the classification, as it shows outliers, separation, and shape of the populations (e.g., focused, splattered, or multiple focus regions). The following population comparisons were performed: single rings vs. multiple rings (Figure 4A); single rings vs. single trophozoites (Figure 4B); single rings vs. multiple trophozoites (Figure 4C); single rings vs. single schizonts (Figure 4D); single rings vs. multiple schizonts (Figure 4E); multiple rings vs. single trophozoites (Figure 4F); multiple rings vs. multiple trophozoites (Figure 4G); multiple rings vs. single schizonts (Figure 4H); multiple rings vs. multiple schizonts (Figure 4I); single trophozoites vs. multiple trophozoites (Figure 4J); single trophozoites vs. single schizonts (Figure 4K); single trophozoites vs. multiple schizonts (Figure 4L); multiple trophozoites vs. single schizonts (Figure 4M); multiple trophozoites vs. multiple schizonts (Figure 4N); and single schizonts vs. multiple schizonts (Figure 4O). Single-ring and single-trophozoite stages were easily differentiated from single-schizont stages as indicated by “goodness” scores of 3.94 (Figures 4D) and 2.83 (Figure 4K), respectively. Multiple rings were well distinguished from single and multiple schizonts, with “goodness” scores of 2.68 (Figures 4H) and 3.38 (Figure 4I), respectively, while multiple trophozoites were distinguished from single and multiple schizonts, with “goodness” scores of 1.66 (Figures 4M) and 1.91 (Figure 4N), respectively. Differentiation of ring and trophozoite stages was the most challenging, with a goodness score of 1.55 (Figure 4B), consistent with a previously published machine learning-based method.36 The closeness in spread between these populations is due to the continuous development cycle of blood stages, with early-ring stages easily differentiated from late-trophozoite stages but late-ring stages poorly differentiated from early-trophozoite stages. The phenotypic differences between late-ring and early-trophozoite stages are slight, as both stages are similar in size, and early-trophozoite stages have little hemozoin (Figure S5). SYTO staining proved to be important for this distinction, accounting for 10 out of the 20 properties used to differentiate single rings from single trophozoites (Data S1). In contrast, the morphology of schizont stages is very distinct from rings and trophozoites, as Hoechst staining is much more pronounced in multinucleate schizont stages (Figure 1). Accordingly, Hoechst staining accounted for 12 of the 20 properties used to differentiate single schizonts from single rings and 12 of the 22 properties (Data S1) used to differentiate single schizonts from single trophozoites.
Figure 4.

Differentiation of asexual stages
After establishing a training set for machine learning, “goodness” scores and scatterplots were generated with Harmony High-Content Imaging and Analysis software with PhenoLOGIC (v.4.9). The “goodness” score is a measure of signal-to-noise ratio, which indicates the separation, but not distribution, between two populations. The scatterplot provides a 2D depiction of the differences between.
(A) Single rings vs. multiple rings; (B) single rings vs. single trophozoites; (C) single rings vs. multiple trophozoites; (D) single rings vs. single schizonts; (E) single rings vs. multiple schizonts; (F) multiple rings vs. single trophozoites; (G) multiple rings vs. multiple trophozoites; (H) multiple rings vs. single schizonts; (I) multiple rings vs. multiple schizonts; (J) single trophozoites vs. multiple trophozoites; (K) single trophozoites vs. single schizonts; (L) single trophozoites vs. multiple schizonts; (M) multiple trophozoites vs. single schizonts; (N) multiple trophozoites vs. multiple schizonts; and (O) single schizonts vs. multiple schizonts. Single rings, multiple rings, single trophozoites, multiple trophozoites, single schizonts, and multiple schizonts are shown in green, dark red, dark blue, yellow, pink, and light blue, respectively. Solid circles indicated manually selected parasites, and open circles indicated machine-selected parasites.
Validating parasite quantification and stage identification
We used two population types to validate our machine learning analysis: stage-enriched cultures (Figure 5A) and asynchronous (mixture of stages) cultures (Figure 5B). Four different parasite strains (Cam3.II K13 WT, Cam3.II K13 R539T, Cam3.II K13C580Y, and 3D7) were used as we did not observe differences in their morphology and, for these verification purposes, were treated as parasite bioreplicates. Cam3.II K13C580Y ring stages, Cam3.II K13 WT trophozoite stages, and Cam3.II K13C580Y schizont stages were used in the stage-enriched cultures. At least 1,000 iRBCs were enumerated for each stage both by high-content imaging and light microscopy, which is considered the gold standard for parasite stage identification. For stage-enriched populations, parasites were enriched for rings, for trophozoites, or for schizonts, as described in the STAR Methods, and then quantified by both methods. To ensure that bursting schizonts would not significantly impact quantification in the schizont-enriched culture, parasites from 36 to 44 hpi were used. Raw stage counts from light microscopy and high-content imaging are listed in Table S2 for both stage-enriched and mixed cultures. The percentage of each stage was quantified by dividing the total number of the stage of interest by the total number of parasites. A Bland-Altman analysis was used to assess agreement between the two quantification methods.48 Statistical limits were calculated based on the mean and standard deviation of the differences between the two assay methods of light microscopy and machine learning. The mean of the differences is also known as the bias. If the bias calculated is close to zero, then this indicates that the two assay methods are systematically producing similar results. For stage-enriched populations, a bias of −2.76 × 10⁻¹⁵ with a standard deviation of ±3.35 was obtained (Figure 5C). For the asynchronous populations, a bias of −2.23 × 10⁻¹⁴ with a standard deviation of ±4.38 was obtained (Figure 5D). If there is good agreement between the two assay methods, 95% of the differences are expected to lie within 1.96 standard deviations of the bias, given that the differences are normally distributed. Our analyses show that the differences were normally distributed, the calculated bias was close to zero, and all comparisons fell on or within 95% limits of agreement of ±1.96 standard deviations (Figures 5C and 5D). The greater variance in the asynchronous comparisons is likely explained by the inherent bias of microscope users to focus on larger and more vibrantly stained trophozoite stages rather than lighter-stained ring stages. No parasites from these validations were used as part of the training set for the linear classifier.
Figure 5.

Machine learning validation
(A–C) Parasite stages were quantified manually by light microscope (solid bars) and automatically by 40× imaging paired with machine learning (dotted bars) in (A) stage-enriched and (B) asynchronous (mixed stage) populations. For stage-enriched quantifications, ring-enriched, trophozoite-enriched, and schizont-enriched populations were counted. For asynchronous quantifications, Cam3.II K13 R539T, Cam3.II K13C580Y, and 3D7 strain parasites were counted. Rings, trophozoites, and schizonts are indicated in green, blue, and pink, respectively. At least 1,000 parasites were counted by each method per individual enrichment or individual parasite strain. The percentage of each stage was calculated by dividing the total number of the stage of interest by the total number of parasites. Percentages from each independent quantification are shown. Raw parasite counts are listed in Table S2. To assess agreement between stage quantification methods, a Bland-Altman analysis was performed for (C) stage-enriched populations and (D) asynchronous populations. Percentages of rings, trophozoites, and schizonts were compared for each individual enriched population or individual parasite strain. Machine learning values were subtracted from the corresponding light microscopy values. A Shapiro-Wilk test was used to confirm that the difference between values was normally distributed. The difference between two values (x axis) was then compared with the average of the two values (y axis) and plotted on the graph shown. For each population, ring (R), trophozoite (T), and schizont (S) comparisons are indicated by green, blue, and pink symbols, respectively. (C) Parasite stages enriched for rings, trophozoites, and schizonts are indicated by circles, triangles, and squares, respectively.
(D) Cam3.II K13 R539T, Cam3.II K13C580Y, and 3D7 comparisons are indicated by circles, triangles, and squares, respectively. The bias, which is the mean difference between each comparison set, was calculated, and 95% limits of agreement (shaded in gray) were determined as ±1.96 standard deviation (SD). The bias and ±95% limits of agreement are indicated by the dotted lines. A bias close to zero indicates that there is good agreement between the two assay methods. The data for both stage-enriched and asynchronous populations show a bias close to zero, and all points fall on or within the 95% limits of agreement. This suggests that the two assay methods of light microscopy and machine learning are in agreement and produce similar results.
Detection of P. falciparum stage sensitivity to chloroquine
Chloroquine, which interferes with parasite-mediated heme detoxification, is known to stall parasites at the late-ring to early-trophozoite stage.49 To determine if we could quantify this phenotype with our 40× imaging and machine learning analysis, we synchronized chloroquine-sensitive GC03 strain parasites to the early-ring stage and then exposed them to 60 nM chloroquine (equivalent of 3× IC50). Relative parasitemia (Figure 6A) and the proportion of each stage (Figures 6B, 6C, and S6) quantified at 0, 24, 48, and 72 h time points are shown. Raw stage counts from four independent biological replicates can be found in Table S3. Differences in stage progression between untreated and chloroquine-treated parasites were first detected at 24 h (Figure 6B), with 22% of untreated parasites and 41% of chloroquine-treated parasites identified as rings (p = 0.0113; Figure 6C). Differences in parasitemia were first detected at 48 h (p = 0.0061; Figure 6A), with untreated parasites converting to new ring stages (78% rings). In contrast, at 48 h, chloroquine-treated parasites remained stalled at the late-ring (46%; p = 0.0008) to early-trophozoite stage (51%; p = 0.0013) (Figure 6C), and parasitemia declined to 35% of the starting value (Figure 6A). At 72 h, parasitemia of chloroquine-treated parasites continued to decline (Figure 6A), and parasites remained unable to progress past the trophozoite stage (Figures 6B and 6C). These differences in stage progression were also reflected by Giemsa-stained parasites visualized by light microscopy (Figure 6D). These data indicate that our machine learning analysis can be used to discern P. falciparum stage susceptibility to antimalarials in a quantitative fashion.
Figure 6.

Discerning stage sensitivity
GC03 parasites were synchronized to the early-ring stage and treated with 60 nM CQ.
(A–C) Parasitemia (A) and stage proportion (B and C) were quantified at 0, 24, 48, and 72 h using the 40× imaging and analysis method. (A) Parasitemia values were normalized to the 0-h time point and plotted as mean ± SEM from four independent experiments. Untreated parasites are indicated by dark gray circles, and CQ-treated parasites are indicated by light gray squares. Stage proportions are shown for a (B) representative single replicate (3 other biological replicates can be found in Figure S6) and (C) mean ± SEM from four independent replicates. Raw parasite counts from each replicate can be found in Table S3. Ring (R), trophozoite (T), and schizont (S) stages are indicated in green, blue, and pink, respectively. At least 500 parasites or 60,000 RBCs were analyzed per treatment at each time point.
(D) Representative images of Giemsa-stained thin blood smears visualized by light microscope are also shown. Scale bar: 2.5 μm.
Statistical significance in (A) and (C) was examined between treated and untreated samples at each time point using a Student’s t test. ∗p < 0.05; ∗∗p < 0.01; ∗∗∗p < 0.001; ns, not significant.
Quantifying and validating number of nuclei within P. falciparum schizonts
To determine if our machine learning analysis could be leveraged to quantify stage-specific phenotypes, we attempted to quantify P. falciparum schizont nuclei. The Hoechst channel (Figure 7A) was first filtered using the SER spot texture filter, which highlights the brightest portion of spots (step 21; Figure 7B). A scale of 0.5 px (150 nm) was used to allow for optimal separation of spots without splitting individual nuclei. Using the SER spot filtered output image, nuclei were then identified in single schizonts using “find spots” “method C” (step 22; Figure 7C). This method allows for identification of small spots with a radius ≤1.1 px (330 nm). To exclude background, contrast and uncorrected spot to region intensity were set to >0.06 and >2.7, respectively. The mean number of schizont nuclei was obtained by dividing the total number of identified nuclei by the total number of single schizonts (step 23e). To validate this method, nuclei in at least 450 schizonts were counted by high-content imaging and light microscopy. 46–48 hpi stages were enriched using a 75% Percoll density gradient, and then schizonts were treated with 50 μM E64 for 2 h to inhibit schizont rupture.50 The average numbers of nuclei and total schizonts counted from three independent experiments are listed in Table S4. Both methods had similar quantifications, with 13.91 mean nuclei per schizont identified by light microscopy and 13.57 mean nuclei per schizont identified by high-content imaging (Figure 7D). No significant difference was found between methods when assessed by a Student’s t test (p = 0.6980).
Figure 7.

Enumeration of schizont nuclei
Cam3.II K13C580Y schizonts were enriched using a 75% Percoll density gradient and then treated with 50 μM E64 for 2 h to reduce schizont rupture. Cultures were then stained and imaged with our 40× imaging analysis.
(A–C) Shown is a representative image of the (A) Hoechst input channel. This image was filtered with the (B) spots, edges, and ridges (SER) spots filter to highlight individual nuclei. Using this output image, (C) nuclei were identified in single schizonts using “method C.” Each different colored dot indicates an identified nuclei spot. To validate this method, the average number of nuclei were quantified in at least 450 single schizonts manually by light microscope and automatically by our 40× machine learning analysis. Scale bar: 10 μm; inset scale bar: 2.5 μm.
(D) Shown are mean nuclei ± SEM from three independent experiments, indicated by circles, triangles, and squares. The mean number of schizont nuclei and the number of schizonts counted for each replicate are shown in Table S4. No significant difference was found between the two methods using a Student’s t test.
Discussion
Here, we describe methods to quantify parasitemia using a 20× air objective and to discern, enumerate, and characterize P. falciparum asexual blood stages using a 40× water objective. Though we chose to use 96-well plates, the 20× method could be adapted to 384-well plate or 1,536-well plate format by adjusting cell seeding as previously described.7,18 Following cell plating, the same imaging and analysis protocols can then be used. Similar to flow cytometry and a previous high-content imaging approach,18 this method improves upon ELISAs and plate reader assays by quantifying individual RBCs and using a viability marker so that only live parasites are counted. Thus, our 20× method is well suited for dose-response assays and ring-stage survival assays (RSAs). RSAs are the gold-standard protocol used to assess artemisinin resistance.51 For assay accuracy, it is critical that pyknotic, non-respirating parasites are excluded. This makes parasite visualization by microscopy extremely helpful compared with fluorescence detection by flow cytometry. Thus, many labs still use light microscopy for RSAs, which is an extremely time-consuming process. We therefore believe that this 20× method could be a valuable tool.
To differentiate asexual stages in our 40× method, a linear classifier was utilized. Previously, another machine learning-based method has been described to differentiate P. falciparum asexual stages in a semi-supervised fashion using deep neural networks.36 Deep neural networks are more complex than linear classifiers and are able to recognize patterns of unstructured data, allowing the authors to classify asexual stages on a continuum instead of discrete outputs and to predict drug mode of action based on clustering of drug-induced parasite morphological phenotypes.36 While this method certainly has advantages, our method described here also demonstrates a robust capacity to differentiate asexual stages and has several unique advantages. First, there is no requirement to use genetically modified parasites expressing a cytosolic fluorescent marker. Thus, any P. falciparum strain can be used, including multidrug-resistant parasites and recently adapted clinical isolates, which are arguably more relevant for compound screens. Second, our method does not require expertise in coding or machine learning, allowing increased accessibility to biologists with limited technological backgrounds. Third, our method can identify and distinguish RBCs infected with single parasites from RBCs infected with multiple parasites, which was not previously shown.18,36 Finally, this method allows flexibility to quantify stage-specific phenotypes of interest. In the future, this method can be expanded to quantify other blood-stage phenotypes of interest by including different fluorescent stains. For example, the calcium stain Fluo-4 has previously been used to screen for compounds that disrupt the parasite’s DV and calcium dynamics.19,20,21 Further, components of this analysis could be implemented outside the malaria field. Since merozoites are similar in size to bacteria, our method to numerate nuclei of daughter merozoites in schizonts could be adapted to enumerate the number of bacteria in infected cells, for example within macrophages. Manual visualization and enumeration of small objects can be challenging and would be facilitated by automated high-content imaging platforms.
The relentless capacity of Plasmodium to acquire drug resistance is a major hurdle for malaria elimination. Accordingly, continual development of antimalarials to overcome the chronic state of drug resistance is essential. High-content imaging paired with machine learning is a valuable tool in this endeavor, capable of rapidly identifying potent compounds and providing clues toward the mode of action of these compounds. The approach described here can aid in the discovery of compounds with uncompromised modes of action by quantifying phenotypes of interest. In addition, determining stage sensitivity of compounds will aid in optimal partner drug pairing. For example, if one drug is less sensitive at a particular stage, an ideal partner drug would be most active at that stage. Such differential stage potency partially underlies the strong synergy seen between dihydroartemisinin and proteasome inhibitors.52 Methods like the one described here will contribute to the collection of assays available to characterize antimalarial candidates.
Limitations of the study
For screening of compounds for antimalarial activity or for determining IC50 values to gauge drug potency, we recommend using the 20× image acquisition and analysis method, which yields nearly identical results to flow cytometry-based assays and has a comparable run time (approximately 20–30 min to image and analyze ≥10,000 cells per well in a 96-well plate). The 20× high-content imaging method requires an increase in staining time (20 vs. 45 min), an additional washing step, and an increase in instrument price, compared with flow cytometry. However, once imaging parameters are obtained (<10 min), no supervision of high-content imaging is required. In contrast, flow cytometry requires continuous monitoring to ensure that data acquisition is not skewed by machine clogging due to the sticky nature of iRBCs.38 If there is clogging, hours can be spent removing the clog within the flow cytometry tubing, and the assay needs to be redone, as the data collected are inaccurate. We do not recommend using our 40× image acquisition and analysis method for initial large-scale screens since imaging time with the 40× objective is significantly increased by the acquisition of z stacks (>10 h unsupervised time to image ≥10,000 cells per well in a 96-well plate). Though the number of fields that are needed per well is dependent on the type of experiment and parasitemia used, for both 20× and 40× methods, a dense monolayer of cells with minimal cell overlap is key to reducing imaging time without interfering with cell segmentation.
Once a compound of interest is identified, our 40× image acquisition and analysis method can be used to quantify alterations in stage progression and phenotypic changes in compound-treated parasites. Here, we demonstrate that our 40× method can be used to quantify stalling of chloroquine-treated parasites at the late-ring to early-trophozoite stage, as well as quantify schizont nuclei in an automated fashion. By determining points in the developmental cycle that are altered, this analysis can be harnessed to determine stage sensitivity of new compounds or determine altered progression in drug-resistant parasites. Simultaneously, phenotypic properties can be quantified to provide insight into the mode of action of new drug candidates. Of note, one limitation to our 40× method is that cells must be imaged live since fixing agents for SYTO and MDR are not compatible.
Previously, several groups have manually enumerated schizont nuclei to monitor growth rates or pinpoint breaks in the development between schizont and ring stages in response to treatment with uncharacterized drugs or mutations in poorly defined parasite genes.53,54,55,56,57,58 Since the method described here is capable of not only identifying schizont stages but also differentiating RBCs infected with single vs. multiple schizonts, a factor that would inflate nuclei counts, this analysis is able to overcome hurdles that have previously inhibited fully automated approaches to nuclei enumeration. Note that since individual nuclei cannot be assigned to a particular schizont, only the mean number of nuclei and the total number of schizonts imaged can be defined with our 40× method.
Although we used Harmony High-Content Imaging and Analysis software with PhenoLOGIC machine learning software for these analyses, several alternative open-source scripts are available including CellProfiler (https://cellprofiler.org),59 Advanced Cell Classifier (http://www.cellclassifier.org),60 and Keras R-CNN.61 Of these, the building blocks in CellProfiler most closely resemble Harmony software, with options to segment and identify cells as well as to measure object size, texture, and intensity properties.59 CellProfiler can also be paired with open-source plugins like ClassifyPixelsUNet, which may aid in RBC segmentation,62 as well as the supervised machine learning classifier CellProfiler Analyst (https://cellprofileranalyst.org) to differentiate asexual stages. A detailed step-by-step protocol along with explanations of parameters used are included to increase transferability of this approach. We recognize that there may be significant differences between instruments and software. Nevertheless, we anticipate that this protocol will be helpful to anchor numerical parameters.
STAR★Methods
Key resources table
| REAGENT or RESOURCE | SOURCE | IDENTIFIER |
|---|---|---|
| Biological samples | ||
| O+ blood from anonymous donors | Interstate Blood Bank | N/A |
| Chemicals, peptides, and recombinant proteins | ||
| Hoechst 33342 | Thermo Fisher Scientific | Catalog# 62249 |
| MitoTracker™ Deep Red FM | Thermo Fisher Scientific | Catalog #M22426 |
| CellMask™ Orange Plasma membrane Stain | Thermo Fisher Scientific | Catalog #C10045 |
| SYTO™ RNASelect™ | Thermo Fisher Scientific | Catalog #S32703 |
| SYBR Green I | Thermo Fisher Scientific | Catalog #S7563 |
| Dihydroartemisinin | Millipore Sigma | Catalog# 1200520 |
| Chloroquine diphosphate | Thermo Scientific Chemicals | Catalog# 455240250 |
| Experimental models: Organisms/strains | ||
| Plasmodium falciparum strain GC03 | BEI Resources | Catalog# MRA-164 |
| Plasmodium falciparum strain Dd2 | BEI Resources | Catalog# MRA-150 |
| Plasmodium falciparum strain Cam3.II K13 R539T | Laboratory of David Fidock | N/A |
| Plasmodium falciparum strain Cam3.II K13C580Y | Laboratory of David Fidock | N/A |
| Plasmodium falciparum strain Cam3.II K13 WT | Laboratory of David Fidock | N/A |
| Plasmodium falciparum strain 3D7 | BEI Resources | Catalog# MRA-102 |
| Software and algorithms | ||
| Harmony® High Content Imaging and Analysis Software with PhenoLOGIC™ Machine Learning (version 4.9) | PerkinElmer | Part# HH17000010 |
| Other | ||
| Operetta CLS | PerkinElmer | Part# HH16000020 |
| Analyses related to identification of P. falciparum asexual blood stages | This paper | N/A |
Resource availability
Lead contact
Requests for further information should be directed to the lead contact, Caroline Ng (caroline.ng@unmc.edu).
Materials availability
No unique reagents were generated in this study.
Experimental model and subject details
Primary cell cultures
O+ blood from anonymous donors was purchased from Interstate Blood Bank (Memphis, TN). Thus, no information about sex, gender, or other demographics regarding blood source is available. Whole blood was passed through a leukocyte-reduction filtration unit (Haemonetics, Braintree, MA). Then, leukocyte-depleted blood was centrifuged at 4000 rpm (3100 × g) for 10 min without brake. The supernatant was removed, and to the packed blood, an equal volume of incomplete media, which consists of RPMI 1640 media supplemented with 2.05 mM L-Glutamine (GE Healthcare, Chicago, IL), was added. This centrifugation and addition of incomplete media was performed twice to remove any residual serum, fats, white blood cells, or other components of whole blood. Pure RBCs were then resuspended at 50% hematocrit in ADSOL (2 mM adenine (Alfa Aesar, Haverhill, MA), 111 mM dextrose (Fisher BioReagents, Pittsburgh, PA), 41.2 mM mannitol (Acros Organics, Fair Lawn, NJ), and 154 mM sodium chloride (Fisher BioReagents)63 for RBC preservation and stored at 4°C.
Cell lines
All P. falciparum parasites were gifts from Prof. David Fidock (Columbia University Irving Medical Center, New York, NY). Parasite cultures were propagated in O+ RBCs at 5% hematocrit in complete media, which consists of RPMI 1640 media supplemented with 0.01 mg/mL gentamicin (Gibco, Billings, MT)), 50 mg/mL hypoxanthine (Acros Organics), and 0.5% Albumax II (Invitrogen, Carlsbad, CA) and maintained at 37°C in a Heracell VIOS 160i Tri-gas Incubator (ThermoFisher Scientific, Waltham, MA) under hypoxic conditions (5% O2, 5% CO2, 90% N2). Gas was purchased from Matheson Gas (Irving, TX).
Method details
Stage-specific enrichments
Ring stage parasites were enriched for by treating cultures with 5% sorbitol (Acros Organics) for 10 min at 37°C followed by centrifugation at 1500 rpm (436 × g) for 3 min. The supernatant was removed, and a volume of complete media equal to the volume of the starting culture was added. Centrifugation, supernatant removal, and addition of complete media were repeated for a total of two washes. Early ring stages used for the chloroquine time course were obtained treating parasites with 5% sorbitol, incubating for 12 h, treating with 5% sorbitol a second time, incubating an additional 36 h, and then treating with 5% sorbitol for a third time.64 Following the third sorbitol treatment, early ring stages were washed twice with media. Trophozoite stages were enriched using a double treatment with 5% sorbitol 10–12 h apart. Following the second treatment, the culture was incubated for 12–15 h at 37°C in hypoxic conditions. Schizont stage parasites were enriched for using a 75% Percoll (GE Healthcare, Chicago, IL) density gradient. Briefly, 500 μL of infected RBCs (iRBCs) was re-suspended in incomplete media supplemented with 14.3 U/mL heparin (Merck, Kenilworth, NJ) and incubated at 37°C for 30 min with intermittent vortexing. Cultures were then carefully layered on top of a 75% Percoll density gradient in a 15 mL conical (Fisher BioReagents) and centrifuged at 4000 rpm (3100 × g) for 15 min. Schizont stages were collected from the layer immediately above the Percoll, transferred to a new 15 mL conical tube, and washed by filling the conical with incomplete media supplemented with 14.3 U/mL heparin. The schizonts were then centrifuged at 1500 rpm (436 × g) for 3 min with no brake, the supernatant was removed, and complete media was added to put the culture at 1% hematocrit. For nuclei counting assays, enriched schizonts were incubated with 50 μM E64 (Alfa Aesar, Ward Hill, MA) for 2 h at 37°C in hypoxic conditions. Following stage isolations, parasite cultures were adjusted to 1% hematocrit in complete media prior to image acquisition.
High content imaging sample preparation
Plate preparation: CellCarrier-96 Ultra Microplates (Perkin Elmer, Waltham, MA) were coated with 50 μL of 0.1 mg/mL poly-L-lysine (MP Biomedicals, Irvine, CA) per well for 20 min at room temperature, then washed three times with 150 μL of autoclaved MilliQ water. The water was aspirated, and plates were allowed to air dry for a minimum of 30 min.
Stain preparation: RBC plasma membranes were stained with 5 μg/mL CellMask Orange Plasma membrane Stain. Nuclei were stained with 2 μg/mL Hoechst 33342 and RNA was stained with 1 μM SYTO RNASelect. Functional mitochondria were labeled with 100 nM MitoTracker Deep Red FM. All fluorescent dyes were obtained from Thermo Fisher Scientific and diluted in 1 × PBS. 40 μL of stain was added per well.
Parasite seeding: 10 μL of parasite culture at 1% hematocrit, equivalent to 10 million RBC, was added per well. Equal cell distribution within the well was ensured by moving the plate while placed on the table from left to right and away from and toward the researcher. Cells were allowed to settle for 45 min at 37°C under hypoxic conditions as described above. Plates were washed three times with 150 μL of 1 × PBS. To remove 1 × PBS, plates are inverted over a waste container. Plates should not be centrifuged, as this causes cells to aggregate to the edge of the well. Following the third removal of 1 × PBS, 150 μL of 1 × PBS was added. Maximum cell density with little to no overlap is ideal for subsequent image analyses. If MDR and SYTO stains are being used together (40x analysis), cells must be imaged within 6 h after staining, since fixing agents for these two stains (aldehyde-based and methanol) are incompatible. If MDR and Hoechst are used alone, then cells may be fixed with an aldehyde-based fixative (e.g., 2% paraformaldehyde and 2% glutaraldehyde) and then imaged later, as long as samples remain moist and do not dry out.
Flow cytometry sample preparation
Stain preparation: Parasite nuclei were stained with 1 × SYBR Green I and respirating parasite mitochondria were stained with 100 nM MitoTracker Deep Red FM, diluted in 1 × PBS, as described in.65,66 40 μL of stain was added per well to a 96-well Clear Round Bottom Polystyrene plate (Corning, Corning, NY).
Parasite seeding: 5 μL of parasite culture at 1% hematocrit was added per well. Plates were incubated for 20 min at 37°C under hypoxic conditions. 150 μL of 1 × PBS was added per well, ensuring that RBCs are resuspended prior to flow cytometry-based parasite detection.
Operetta 20x image acquisition and analysis
Samples were imaged with an Operetta CLS High-Content Analysis System (Perkin Elmer) using the following settings: 20× air objective, non-confocal, binning 2. Selection of non-confocal imaging and binning 2 was made to decreased data file size since increased resolution was unnecessary. Channels were captured in the following order to minimize image capture time: Hoechst (excitation/emission (ex/em) 355–385/430-500), Mitotracker Deep Red (ex/em 615–645/655-760), and brightfield. For each channel, focus height was determined, and exposure time and percent power were adjusted so that the intensity for all channels was approximately 4000–5000 counts/px.
Images were analyzed with Harmony 4.9 software with PhenoLOGIC using the following steps.
-
1.
Input Image: Stack Processing- Individual Planes; Min. Global Binning- Dynamic
-
2.
Filter image: Channel- Brightfield; Method- Smoothing (Filter = Gaussian; Width = 3.5 px); Output Image- Gaussian smoothed
-
3.
Filter Image: Channel- Gaussian smoothed; Method- Invert Image (Cut-off quartile = 100); Output Image- Inverted
-
4.
Find Cells: Channel- Inverted; ROI- None; Method- M (Diameter = 8 μm; Splitting sensitivity = 0.46; Common threshold = 0.35)
-
5.
Calculate Morphology: Population- Cells; Region- Cell; Method- Standard (Area, Roundness, Ratio Width to Length)
-
6.
Calculate Intensity Properties: Channel- Brightfield; Population- Cells; Region- Cells; Method- Standard (Contrast)
-
7.
Select Population: Population- Cells; Method- Filter by Property (Cell Area μm2 > 15; Cell Area μm2 < 200; Cell Roundness >0.6; Cell Ratio Width to Length >0.35; Intensity Cell Brightfield Contrast < −0.036); Output Population- RBCs selected
-
8.
Find Spots: Channel- Hoechst; ROI- RBCs selected; ROI Region- Cell; Method- C (Radius ≤9.1 px; Contrast >0.5; Uncorrected Spot to Region Intensity >0.6; Distance ≥1.04 μm; Spot Peak Radius = 0 μm); Output Population- Nuclei
-
9.
Find Spots: Channel- MitoTracker Deep Red; ROI- RBCs with nuclei; ROI Region- Cell; Method- C (Radius ≤9.1 px; Contrast >0.06; Uncorrected Spot to Region Intensity >0.6; Distance ≥3 px; Spot Peak Radius = 0 px; Calculate Spot Properties); Output Population- MitoTracker Spots
-
10.
Select Population: Population- RBCs; Method- Filter by Property (Number of Hoechst Spots ≥1; Number of MitoTracker Spots ≥1; Relative MitoTracker Deep Red Spot Intensity >0.014); Output Population- Infected RBCs
-
11.Define Results: Method- Formula Output (using Number of Objects)
-
a.Total Parasitemia:
-
a.
Asynchronous drug assays
Asynchronous (mixed stage) GC03 and Dd2 parasites were adjusted to 1% hematocrit and 0.075% or 0.05% parasitemia, respectively. Parasites were treated with a range of chloroquine concentrations, 150 nM DHA as a positive control for complete killing, or no drug. After 72 h, cells were stained as described above, and parasitemia was assessed by high content imaging and flow cytometry. For high content imaging, cells were imaged at 20× magnification and our 20× analysis method was used to determine parasitemia. For flow cytometry, parasitemia was assessed using a NovoCyte Flow Cytometer (Agilent, Santa Clara, California) and analyzed with NovoExpress 1.5.0 Software. At least 10,000 cells were analyzed for each method. In vitro IC50 values were determined using a log(inhibitor) vs. response, variable slope regression analysis with GraphPad Prism version 9. Three independent replicates were performed, and statistical significance was examined using a Student’s t test.
Operetta 40x image acquisition and analysis
Samples were imaged with an Operetta CLS High-Content Analysis System (Perkin Elmer) using the following settings: 40× water objective, confocal, binning 1. Channels were captured in the following order to minimize image capture time: Hoechst (excitation/emission (ex/em) 355–385/430-500), SYTO RNASelect (ex/em 460–490/500-550), CellMask Orange Plasma membrane (ex/em 530–560/570-650), Mitotracker Deep Red (ex/em 615–645/655-760), and brightfield. For each channel, focus height was determined, and exposure time and percent power were adjusted so that the intensity for all channels was approximately 3000–4500 counts/pixels (px). Ten planes were captured for each field 0.5 μm apart.
Images were analyzed with Harmony 4.9 software with PhenoLOGIC using the following steps.
-
1.
Input Image: Stack Processing- Maximum Projection; Min. Global Binning- Dynamic
-
2.
Filter Image: Channel- CellMask Orange Plasma membrane; Method- Smoothing (Filter = Median; Scale = 2 px); Output Image- Median Smoothed
-
3.
Filter Image: Channel- Median Smoothed; Method- Smoothing (Filter = Gaussian; Width = 1 px); Output Image- Gaussian Smoothed
-
4.
Find Cells: Channel- Gaussian Smoothed; Method- P (Area >24 μm2; Splitting Sensitivity = 0.28; Common Threshold = 0.83); Output Population- Cells
-
5.
Calculate Morphology Properties: Population- Cells; Region- Cells; Method- Standard (Width, Length, Ratio Width to Length); Property Prefix- Cell
-
6.
Calculate Intensity Properties: Channel- CellMask Orange Plasma membrane; Method- Standard (Mean, Median, Sum, Maximum, Minimum, Contrast)
-
7.
Select Population: Population- Cells; Method- Standard (Cell Length <13.5 μm; Cell Width >3.5 μm; Cell Ratio Width to Length >0.35; Cell Area <60 μm2; Cell Area >20 μm2; Mean CellMask Orange Plasma membrane Intensity >2500); Output Population- RBCs selected
-
8.
Find Spots: Channel- Hoechst; Region of Interest (ROI)- RBCs Selected; ROI Region- Cell; Method- D (Detection Sensitivity = 0.45; Splitting Sensitivity = 0.5; Background Correction = 0.422; Calculate Spot Properties)
-
9.
Find Spots: Channel- Mitotracker Deep Red; ROI- RBCs Selected; ROI Region- Cell; Method- D (Detection Sensitivity = 0.4; Splitting Sensitivity = 0.75; Background Correction = 0.8; Calculate Spot Properties)
-
10.
Select Population: Population- RBCs selected; Method- Filter by Property (Number of Hoechst spots ≥1; Number of Mitotracker Deep Red Spots ≥1); Output population- Infected RBCs
-
11.
Calculate Intensity Properties: Channel- Hoechst; Population- Infected RBCs; Region- Cell; Method- Standard (Mean, Standard Deviation, Coefficient of Variance, Median, Sum, Maximum, Minimum, Contrast)
-
12.
Calculate Intensity Properties: Channel- Mitotracker Deep Red; Population- Infected RBCs; Method- Standard (Mean, Standard Deviation, Coefficient of Variance, Median, Sum, Maximum, Minimum, Contrast)
-
13.
Calculate Intensity Properties: Channel- SYTO; Population- Infected RBCs; Method- Standard (Mean, Standard Deviation, Coefficient of Variance, Median, Sum, Maximum, Minimum, Contras)
-
14.
Calculate Texture Properties: Channel- Hoechst; Population- Infected RBCs; Method- SER Features (Scale = 0 px; Normalization by Kernel)
-
15.
Calculate Texture Properties: Channel- Mitotracker Deep Red; Population- Infected RBCs; Method- SER Features (Scale = 0 px; Normalization by Kernel)
-
16.
Calculate Texture Properties: Channel- SYTO; Population- Infected RBCs; Method- SER Features (Scale = 0 px; Normalization by Kernel)
-
17.
Calculate Morphology Properties: Population- Infected RBC; Region- Cell; Method- STAR; Channel- Hoechst (Symmetry; Threshold Compactness; Axial; Radial; Profile; Profile Inner Region- Spots; Profile Width = 4 px)
-
18.
Calculate Morphology Properties: Population- Infected RBC; Region- Cell; Method- STAR; Channel- Mitotracker Deep Red (Symmetry; Threshold Compactness; Axial; Radial; Profile; Profile Inner Region- Spots; Profile Width = 4 px)
-
19.
Calculate Morphology Properties: Population- Infected RBC; Region- Cell; Method- STAR; Channel- SYTO (Symmetry; Threshold Compactness; Axial; Radial; Profile; Profile Inner Region- Spots; Profile Width = 4 px)
-
20.Select Population: Population- Infected RBCs; Method- Linear Classifier (Number of Classes- 6)
-
a.Using stage enriched cultures, a training set was established for six populations: single rings, multiple rings, single trophozoites, multiple trophozoites, single schizonts, and multiple schizonts. At least 400 objects were defined for populations of RBCs infected with one parasite and at least 100 objects were defined for populations of RBCs infected with multiple parasites.
-
a.
-
21.
Filter Image: Channel- Hoechst; Method- Texture SER (Filter = SER Spot; Scale = 0.5 px; Normalization = Region Intensity)
-
22.
Find Spots: Channel- SER Spot; ROI- Schizont; ROI Region-cell; Method- C (Radius ≤1.1 px; Contrast >0.06; Uncorrected Spot to Region Intensity >2.7; Distance ≥1.0 px; Spot Peak Radius = 0 px); Output Population- Schizont nuclei
-
23.Define Results: Method- Formula Output (using number of objects for all parameters)
-
a.Total parasitemia calculation:
-
b.Ring parasitemia:
-
c.Trophozoite parasitemia:
-
d.Schizont parasitemia:
-
e.Mean number of nuclei per schizont:
-
a.
Giemsa staining
Thin blood smears were fixed with 100% methanol for 30 s, then incubated in Giemsa stain (Epredia Giemsa stain obtained from Fisher Scientific, diluted 1:10 in distilled water) for 15 min. Stained slides were gently washed under running water and allowed to air dry, and then imaged using an Olympus CX43 (Shinjuku City, Tokyo, Japan) microscope. Representative images were captured using the attached Olympus SC50 camera using Olympus cellSens Entry 2.3 software. For stage validations, at least 1,000 iRBCs were analyzed per smear. The exact numerical counts can be found in Table S2. The percent of each stage was calculated by dividing the number of iRBCs containing the stage of interest by the total number of iRBCs counted and then multiplying by 100. A Bland-Altman analysis was used to compare light microscopy and machine learning methods with GraphPad Prism version 9. For validation of schizont nuclei counting, nuclei in at least 450 schizonts were counted. The exact numerical counts can be found in Table S3. RBCs harboring multiple schizonts, detected by multiple hemozoin spots, were excluded.
Chloroquine time course
Early ring stages were adjusted to approximately 1–2% parasitemia and incubated with 60 nM chloroquine or in the absence of drug. Parasites were imaged at 0 h, 24 h, 48 h, and 72 h timepoints using the 40x imaging and analysis method and by light microscope. At least 500 parasites or 60,000 RBCs were analyzed for the 40x analysis method. The exact numerical count can be found in Table S3. Four independent biological replicates were performed. Every 24 h, media was removed, and fresh drug media was added. Statistical significance between treated and untreated samples was examined using a Student’s t test with GraphPad Prism version 9.
Quantification and statistical analysis
All quantifications for high content imaging were performed using Harmony High Content Imaging and Analysis Software with PhenoLOGIC Machine Learning (version 4.9) using the methods described here. All statistical analyses were performed using GraphPad Prism version 9. To compare stage quantifications and schizont nuclei quantifications with light microscopy and machine learning, Bland-Altman analyses were performed. Briefly, differences between methods were first assessed for normality using a Shapiro-Wilk test. The bias is calculated by determining the average of the differences, and the standard deviation (S.D.) is determined. A bias of close to zero indicates that there is good agreement in results produced by the two assays. The 95% limit of agreement is set at −/+ 1.96 standard deviation. 95% of differences in values should lie within 1.96 S.D. of the bias, given that the differences are normally distributed. More details relating to this analysis can be found in the main text and in the Figure Legends for Figures 5 and 7, and Tables S2 and S3. For all other statistical analyses, a two-tailed Student’s t test was performed. Significance was defined as a p value less than 0.05. Details relating to these statistics can be found in the associated figure legends and method details.
Acknowledgments
We are grateful to Dr. Saint Patrick Reid (UNMC) for use of the Operetta CLS High-Content Imaging and Analysis System and for helpful discussions. We would also like to thank Trinh Nguyen, Michael Wyler, and Serena Cervantes at PerkinElmer for their helpful discussions about these analyses. Funding for this work was provided by NIH NIAID R21 AI137900 to C.L.N. as well as a pilot grant to C.L.N. under NIH NIGMS P20 GM121316 (overall grant awarded to Dr. R.E. Lewis). C.L.N. also gratefully acknowledges her UNMC Start-up Funds and a UNMC Diversity Fund Grant.
Author contributions
Conceptualization, C.L.N.; methodology, M.R.R. and C.L.N.; investigation, formal analysis, validation, and visualization, M.R.R.; writing – original draft, M.R.R.; writing – review & editing, M.R.R. and C.L.N.; supervision, resources, and funding acquisition, C.L.N.
Declaration of interests
The authors declare no competing interests.
Inclusion and diversity
One or more of the authors of this paper self-identifies as an underrepresented ethnic minority in their field of research or within their geographical location. One or more of the authors of this paper self-identifies as a gender minority in their field of research. One or more of the authors of this paper received support from a program designed to increase minority representation in their field of research.
Published: June 23, 2023
Footnotes
Supplemental information can be found online at https://doi.org/10.1016/j.crmeth.2023.100516.
Supplemental information
Listed are the properties used to differentiate a set of two asexual stages, along with the respective linear coefficient for each variable. Properties are ordered by relevance with the most important property for differentiating stages listed first. Hoechst, MitoTracker, and SYTO RNASelect properties are colored in blue, red, and green, respectively.
Data and code availability
-
•
Parasite counts for machine learning validation can be found in the supplemental data. All other data in this study will be shared upon request from the lead contact.
-
•
No original code was generated in this paper.
-
•
Additional information needed to reanalyze the data reported here is available upon request from the lead contact.
References
- 1.WHO . 2022. World Malaria Report. [Google Scholar]
- 2.Bannister L.H., Hopkins J.M., Fowler R.E., Krishna S., Mitchell G.H. A brief illustrated guide to the ultrastructure of Plasmodium falciparum asexual blood stages. Parasitol. Today. 2000;16:427–433. doi: 10.1016/s0169-4758(00)01755-5. [DOI] [PubMed] [Google Scholar]
- 3.Jun G., Lee J.S., Jung Y.J., Park J.W. Quantitative determination of Plasmodium parasitemia by flow cytometry and microscopy. J. Kor. Med. Sci. 2012;27:1137–1142. doi: 10.3346/jkms.2012.27.10.1137. [DOI] [PMC free article] [PubMed] [Google Scholar]
- 4.Desjardins R.E., Canfield C.J., Haynes J.D., Chulay J.D. Quantitative assessment of antimalarial activity in vitro by a semiautomated microdilution technique. Antimicrob. Agents Chemother. 1979;16:710–718. doi: 10.1128/aac.16.6.710. [DOI] [PMC free article] [PubMed] [Google Scholar]
- 5.Smeijsters L.J., Zijlstra N.M., Franssen F.F., Overdulve J.P. Simple, fast, and accurate fluorometric method to determine drug susceptibility of Plasmodium falciparum in 24-well suspension cultures. Antimicrob. Agents Chemother. 1996;40:835–838. doi: 10.1128/AAC.40.4.835. [DOI] [PMC free article] [PubMed] [Google Scholar]
- 6.Quashie N.B., de Koning H.P., Ranford-Cartwright L.C. An improved and highly sensitive microfluorimetric method for assessing susceptibility of Plasmodium falciparum to antimalarial drugs in vitro. Malar. J. 2006;5:95. doi: 10.1186/1475-2875-5-95. [DOI] [PMC free article] [PubMed] [Google Scholar]
- 7.Baniecki M.L., Wirth D.F., Clardy J. High-throughput Plasmodium falciparum growth assay for malaria drug discovery. Antimicrob. Agents Chemother. 2007;51:716–723. doi: 10.1128/AAC.01144-06. [DOI] [PMC free article] [PubMed] [Google Scholar]
- 8.Abiodun O.O., Gbotosho G.O., Ajaiyeoba E.O., Happi C.T., Hofer S., Wittlin S., Sowunmi A., Brun R., Oduola A.M.J. Comparison of SYBR Green I-PicoGreen-and [3H]-hypoxanthine-based assays for in vitro antimalarial screening of plants from Nigerian ethnomedicine. Parasitol. Res. 2010;106:933–939. doi: 10.1007/s00436-010-1743-z. [DOI] [PubMed] [Google Scholar]
- 9.Gamo F.J., Sanz L.M., Vidal J., de Cozar C., Alvarez E., Lavandera J.L., Vanderwall D.E., Green D.V.S., Kumar V., Hasan S., et al. Thousands of chemical starting points for antimalarial lead identification. Nature. 2010;465:305–310. doi: 10.1038/nature09107. [DOI] [PubMed] [Google Scholar]
- 10.Orjuela-Sánchez P., Duggan E., Nolan J., Frangos J.A., Carvalho L.J. A lactate dehydrogenase ELISA-based assay for the in vitro determination of Plasmodium berghei sensitivity to anti-malarial drugs. Malar. J. 2012;11:366. doi: 10.1186/1475-2875-11-366. [DOI] [PMC free article] [PubMed] [Google Scholar]
- 11.Noedl H., Bronnert J., Yingyuen K., Attlmayr B., Kollaritsch H., Fukuda M. Simple histidine-rich protein 2 double-site sandwich enzyme-linked immunosorbent assay for use in malaria drug sensitivity testing. Antimicrob. Agents Chemother. 2005;49:3575–3577. doi: 10.1128/AAC.49.8.3575-3577.2005. [DOI] [PMC free article] [PubMed] [Google Scholar]
- 12.Li Q., Gerena L., Xie L., Zhang J., Kyle D., Milhous W. Development and validation of flow cytometric measurement for parasitemia in cultures of P. falciparum vitally stained with YOYO-1. Cytometry A. 2007;71:297–307. doi: 10.1002/cyto.a.20380. [DOI] [PubMed] [Google Scholar]
- 13.Plouffe D., Brinker A., McNamara C., Henson K., Kato N., Kuhen K., Nagle A., Adrián F., Matzen J.T., Anderson P., et al. In silico activity profiling reveals the mechanism of action of antimalarials discovered in a high-throughput screen. Proc. Natl. Acad. Sci. USA. 2008;105:9059–9064. doi: 10.1073/pnas.0802982105. [DOI] [PMC free article] [PubMed] [Google Scholar]
- 14.Duffy S., Avery V.M. Development and optimization of a novel 384-well anti-malarial imaging assay validated for high-throughput screening. Am. J. Trop. Med. Hyg. 2012;86:84–92. doi: 10.4269/ajtmh.2012.11-0302. [DOI] [PMC free article] [PubMed] [Google Scholar]
- 15.Lotharius J., Gamo-Benito F.J., Angulo-Barturen I., Clark J., Connelly M., Ferrer-Bazaga S., Parkinson T., Viswanath P., Bandodkar B., Rautela N., et al. Repositioning: the fast track to new anti-malarial medicines? Malar. J. 2014;13:143. doi: 10.1186/1475-2875-13-143. [DOI] [PMC free article] [PubMed] [Google Scholar]
- 16.Avery V.M., Bashyam S., Burrows J.N., Duffy S., Papadatos G., Puthukkuti S., Sambandan Y., Singh S., Spangenberg T., Waterson D., Willis P. Screening and hit evaluation of a chemical library against blood-stage Plasmodium falciparum. Malar. J. 2014;13:190. doi: 10.1186/1475-2875-13-190. [DOI] [PMC free article] [PubMed] [Google Scholar]
- 17.Edlin C.D., Morgans G., Winks S., Duffy S., Avery V.M., Wittlin S., Waterson D., Burrows J., Bryans J. Identification and in-vitro ADME assessment of a series of novel anti-malarial agents suitable for hit-to-lead chemistry. ACS Med. Chem. Lett. 2012;3:570–573. doi: 10.1021/ml300091c. [DOI] [PMC free article] [PubMed] [Google Scholar]
- 18.Moon S., Lee S., Kim H., Freitas-Junior L.H., Kang M., Ayong L., Hansen M.A.E. An image analysis algorithm for malaria parasite stage classification and viability quantification. PLoS One. 2013;8:e61812. doi: 10.1371/journal.pone.0061812. [DOI] [PMC free article] [PubMed] [Google Scholar]
- 19.Lee Y.Q., Goh A.S.P., Ch'ng J.H., Nosten F.H., Preiser P.R., Pervaiz S., Yadav S.K., Tan K.S.W. A high-content phenotypic screen reveals the disruptive potency of quinacrine and 3',4'-dichlorobenzamil on the digestive vacuole of Plasmodium falciparum. Antimicrob. Agents Chemother. 2014;58:550–558. doi: 10.1128/AAC.01441-13. [DOI] [PMC free article] [PubMed] [Google Scholar]
- 20.Chia W.N., Lee Y.Q., Tan K.S.W. Imaging flow cytometry for the screening of compounds that disrupt the Plasmodium falciparum digestive vacuole. Methods. 2017;112:211–220. doi: 10.1016/j.ymeth.2016.07.002. [DOI] [PubMed] [Google Scholar]
- 21.Chia W., Gomez-Lorenzo M.G., Castellote I., Tong J.X., Chandramohanadas R., Thu Chu T.T., Shen W., Go M.L., de Cozar C., Crespo B., et al. High-content phenotypic screen of a focused TCAMS drug library identifies novel disruptors of the malaria parasite calcium dynamics. ACS Chem. Biol. 2021;16:2348–2372. doi: 10.1021/acschembio.1c00512. [DOI] [PubMed] [Google Scholar]
- 22.Cervantes S., Prudhomme J., Carter D., Gopi K.G., Li Q., Chang Y.T., Le Roch K.G. High-content live cell imaging with RNA probes: advancements in high-throughput antimalarial drug discovery. BMC Cell Biol. 2009;10:45. doi: 10.1186/1471-2121-10-45. [DOI] [PMC free article] [PubMed] [Google Scholar]
- 23.Cervantes S., Stout P.E., Prudhomme J., Engel S., Bruton M., Cervantes M., Carter D., Tae-Chang Y., Hay M.E., Aalbersberg W., et al. High content live cell imaging for the discovery of new antimalarial marine natural products. BMC Infect. Dis. 2012;12:1. doi: 10.1186/1471-2334-12-1. [DOI] [PMC free article] [PubMed] [Google Scholar]
- 24.Lucantoni L., Silvestrini F., Signore M., Siciliano G., Eldering M., Dechering K.J., Avery V.M., Alano P. A simple and predictive phenotypic High Content Imaging assay for Plasmodium falciparum mature gametocytes to identify malaria transmission blocking compounds. Sci. Rep. 2015;5:16414. doi: 10.1038/srep16414. [DOI] [PMC free article] [PubMed] [Google Scholar]
- 25.Lucantoni L., Duffy S., Adjalley S.H., Fidock D.A., Avery V.M. Identification of MMV malaria box inhibitors of Plasmodium falciparum early-stage gametocytes using a luciferase-based high-throughput assay. Antimicrob. Agents Chemother. 2013;57:6050–6062. doi: 10.1128/AAC.00870-13. [DOI] [PMC free article] [PubMed] [Google Scholar]
- 26.Duffy S., Avery V.M. Identification of inhibitors of Plasmodium falciparum gametocyte development. Malar. J. 2013;12:408. doi: 10.1186/1475-2875-12-408. [DOI] [PMC free article] [PubMed] [Google Scholar]
- 27.Plouffe D.M., Wree M., Du A.Y., Meister S., Li F., Patra K., Lubar A., Okitsu S.L., Flannery E.L., Kato N., et al. High-throughput assay and discovery of small molecules that interrupt malaria transmission. Cell Host Microbe. 2016;19:114–126. doi: 10.1016/j.chom.2015.12.001. [DOI] [PMC free article] [PubMed] [Google Scholar]
- 28.Miguel-Blanco C., Lelièvre J., Delves M.J., Bardera A.I., Presa J.L., López-Barragán M.J., Ruecker A., Marques S., Sinden R.E., Herreros E. Imaging-based high-throughput screening assay to identify new molecules with transmission-blocking potential against Plasmodium falciparum female gamete formation. Antimicrob. Agents Chemother. 2015;59:3298–3305. doi: 10.1128/AAC.04684-14. [DOI] [PMC free article] [PubMed] [Google Scholar]
- 29.Meister S., Plouffe D.M., Kuhen K.L., Bonamy G.M.C., Wu T., Barnes S.W., Bopp S.E., Borboa R., Bright A.T., Che J., et al. Imaging of Plasmodium liver stages to drive next-generation antimalarial drug discovery. Science. 2011;334:1372–1377. doi: 10.1126/science.1211936. [DOI] [PMC free article] [PubMed] [Google Scholar]
- 30.Roth A., Maher S.P., Conway A.J., Ubalee R., Chaumeau V., Andolina C., Kaba S.A., Vantaux A., Bakowski M.A., Thomson-Luque R., et al. A comprehensive model for assessment of liver stage therapies targeting Plasmodium vivax and Plasmodium falciparum. Nat. Commun. 2018;9:1837. doi: 10.1038/s41467-018-04221-9. [DOI] [PMC free article] [PubMed] [Google Scholar]
- 31.Maher S.P., Vantaux A., Chaumeau V., Chua A.C.Y., Cooper C.A., Andolina C., Péneau J., Rouillier M., Rizopoulos Z., Phal S., et al. Probing the distinct chemosensitivity of Plasmodium vivax liver stage parasites and demonstration of 8-aminoquinoline radical cure activity in vitro. Sci. Rep. 2021;11:19905. doi: 10.1038/s41598-021-99152-9. [DOI] [PMC free article] [PubMed] [Google Scholar]
- 32.Maher S.P., Vantaux A., Cooper C.A., Chasen N.M., Cheng W.T., Joyner C.J., Manetsch R., Witkowski B., Kyle D. A phenotypic screen for the liver stages of Plasmodium vivax. Bio. Protoc. 2021;11:e4253. doi: 10.21769/BioProtoc.4253. [DOI] [PMC free article] [PubMed] [Google Scholar]
- 33.Botnar A., Lawrence G., Maher S.P., Vantaux A., Witkowski B., Shiau J.C., Merino E.F., De Vore D., Yang C., Murray C., et al. Alkyne modified purines for assessment of activation of Plasmodium vivax hypnozoites and growth of pre-erythrocytic and erythrocytic stages in Plasmodium spp. Int. J. Parasitol. 2022;52:733–744. doi: 10.1016/j.ijpara.2022.03.003. [DOI] [PMC free article] [PubMed] [Google Scholar]
- 34.Garvey C.M., Spiller E., Lindsay D., Chiang C.T., Choi N.C., Agus D.B., Mallick P., Foo J., Mumenthaler S.M. A high-content image-based method for quantitatively studying context-dependent cell population dynamics. Sci. Rep. 2016;6:29752. doi: 10.1038/srep29752. [DOI] [PMC free article] [PubMed] [Google Scholar]
- 35.Fisch D., Yakimovich A., Clough B., Wright J., Bunyan M., Howell M., Mercer J., Frickel E. Defining host-pathogen interactions employing an artificial intelligence workflow. Elife. 2019;8:e40560. doi: 10.7554/eLife.40560. [DOI] [PMC free article] [PubMed] [Google Scholar]
- 36.Ashdown G.W., Dimon M., Fan M., Sánchez-Román Terán F., Witmer K., Gaboriau D.C.A., Armstrong Z., Ando D.M., Baum J. A machine learning approach to define antimalarial drug action from heterogeneous cell-based screens. Sci. Adv. 2020;6:eaba9338. doi: 10.1126/sciadv.aba9338. [DOI] [PMC free article] [PubMed] [Google Scholar]
- 37.Moras M., Lefevre S.D., Ostuni M.A. From erythroblasts to mature red blood cells: organelle clearance in mammals. Front. Physiol. 2017;8:1076. doi: 10.3389/fphys.2017.01076. [DOI] [PMC free article] [PubMed] [Google Scholar]
- 38.Diez-Silva M., Dao M., Han J., Lim C.T., Suresh S. Shape and biomechanical characteristics of human red blood cells in health and disease. MRS Bull. 2010;35:382–388. doi: 10.1557/mrs2010.571. [DOI] [PMC free article] [PubMed] [Google Scholar]
- 39.Tek F., Dempster A., Kale I. Computational Imaging and Vision. Springer; 2005. Blood cell segmentation using minimum area watershed and circle radon transformations; pp. 441–454. [Google Scholar]
- 40.Di Ruberto C., Dempster A., Khan S., Jarra B. Lecture Notes in Computer Science. 2001. Morphological image processing for evaluating malaria disease; pp. 739–748. [DOI] [Google Scholar]
- 41.Ross N.E., Pritchard C.J., Rubin D.M., Dusé A.G. Automated image processing method for the diagnosis and classification of malaria on thin blood smears. Med. Biol. Eng. Comput. 2006;44:427–436. doi: 10.1007/s11517-006-0044-2. [DOI] [PubMed] [Google Scholar]
- 42.Le M.T., Bretschneider T.R., Kuss C., Preiser P.R. A novel semi-automatic image processing approach to determine Plasmodium falciparum parasitemia in Giemsa-stained thin blood smears. BMC Cell Biol. 2008;9:15. doi: 10.1186/1471-2121-9-15. [DOI] [PMC free article] [PubMed] [Google Scholar]
- 43.Díaz G., González F.A., Romero E. A semi-automatic method for quantification and classification of erythrocytes infected with malaria parasites in microscopic images. J. Biomed. Inf. 2009;42:296–307. doi: 10.1016/j.jbi.2008.11.005. [DOI] [PubMed] [Google Scholar]
- 44.Wellems T.E., Panton L.J., Gluzman I.Y., do Rosario V.E., Gwadz R.W., Walker-Jonah A., Krogstad D.J. Chloroquine resistance not linked to mdr-like genes in a Plasmodium falciparum cross. Nature. 1990;345:253–255. doi: 10.1038/345253a0. [DOI] [PubMed] [Google Scholar]
- 45.Sidhu A.B.S., Verdier-Pinard D., Fidock D.A. Chloroquine resistance in Plasmodium falciparum malaria parasites conferred by pfcrt mutations. Science. 2002;298:210–213. doi: 10.1126/science.1074045. [DOI] [PMC free article] [PubMed] [Google Scholar]
- 46.Valderramos S.G., Valderramos J.C., Musset L., Purcell L.A., Mercereau-Puijalon O., Legrand E., Fidock D.A. Identification of a mutant PfCRT-mediated chloroquine tolerance phenotype in Plasmodium falciparum. PLoS Pathog. 2010;6:e1000887. doi: 10.1371/journal.ppat.1000887. [DOI] [PMC free article] [PubMed] [Google Scholar]
- 47.Patel J.J., Thacker D., Tan J.C., Pleeter P., Checkley L., Gonzales J.M., Deng B., Roepe P.D., Cooper R.A., Ferdig M.T. Chloroquine susceptibility and reversibility in a Plasmodium falciparum genetic cross. Mol. Microbiol. 2010;78:770–787. doi: 10.1111/j.1365-2958.2010.07366.x. [DOI] [PMC free article] [PubMed] [Google Scholar]
- 48.Giavarina D. Understanding Bland altman analysis. Biochem. Med. 2015;25:141–151. doi: 10.11613/BM.2015.015. [DOI] [PMC free article] [PubMed] [Google Scholar]
- 49.Zhang Y., Asante K.S., Jung A. Stage-dependent inhibition of chloroquine on Plasmodium falciparum in vitro. J. Parasitol. 1986;72:830–836. [PubMed] [Google Scholar]
- 50.Soni S., Dhawan S., Rosen K.M., Chafel M., Chishti A.H., Hanspal M. Characterization of events preceding the release of malaria parasite from the host red blood cell. Blood Cells Mol. Dis. 2005;35:201–211. doi: 10.1016/j.bcmd.2005.05.006. [DOI] [PubMed] [Google Scholar]
- 51.Witkowski B., Amaratunga C., Khim N., Sreng S., Chim P., Kim S., Lim P., Mao S., Sopha C., Sam B., et al. Novel phenotypic assays for the detection of artemisinin-resistant Plasmodium falciparum malaria in Cambodia: in-vitro and ex-vivo drug-response studies. Lancet Infect. Dis. 2013;13:1043–1049. doi: 10.1016/S1473-3099(13)70252-4. [DOI] [PMC free article] [PubMed] [Google Scholar]
- 52.Stokes B.H., Yoo E., Murithi J.M., Luth M.R., Afanasyev P., da Fonseca P.C.A., Winzeler E.A., Ng C.L., Bogyo M., Fidock D.A. Covalent Plasmodium falciparum-selective proteasome inhibitors exhibit a low propensity for generating resistance in vitro and synergize with multiple antimalarial agents. PLoS Pathog. 2019;15:e1007722–e1107750. doi: 10.1371/journal.ppat.1007722. [DOI] [PMC free article] [PubMed] [Google Scholar]
- 53.Reilly H.B., Wang H., Steuter J.A., Marx A.M., Ferdig M.T. Quantitative dissection of clone-specific growth rates in cultured malaria parasites. Int. J. Parasitol. 2007;37:1599–1607. doi: 10.1016/j.ijpara.2007.05.003. [DOI] [PMC free article] [PubMed] [Google Scholar]
- 54.Dorin-Semblat D., Sicard A., Doerig C., Ranford-Cartwright L., Doerig C. Disruption of the PfPK7 gene impairs schizogony and sporogony in the human malaria parasite Plasmodium falciparum. Eukaryot. Cell. 2008;7:279–285. doi: 10.1128/EC.00245-07. [DOI] [PMC free article] [PubMed] [Google Scholar]
- 55.Rovira-Graells N., Aguilera-Simón S., Tintó-Font E., Cortés A. New assays to characterise growth-related phenotypes of Plasmodium falciparum reveal variation in density-dependent growth inhibition between parasite lines. PLoS One. 2016;11:e0165358. doi: 10.1371/journal.pone.0165358. [DOI] [PMC free article] [PubMed] [Google Scholar]
- 56.Jankowska-Döllken M., Sanchez C.P., Cyrklaff M., Lanzer M. Overexpression of the HECT ubiquitin ligase PfUT prolongs the intraerythrocytic cycle and reduces invasion efficiency of Plasmodium falciparum. Sci. Rep. 2019;9:18333. doi: 10.1038/s41598-019-54854-z. [DOI] [PMC free article] [PubMed] [Google Scholar]
- 57.Tintó-Font E., Michel-Todó L., Russell T.J., Casas-Vila N., Conway D.J., Bozdech Z., Llinás M., Cortés A. A heat-shock response regulated by the PfAP2-HS transcription factor protects human malaria parasites from febrile temperatures. Nat. Microbiol. 2021;6:1163–1174. doi: 10.1038/s41564-021-00940-w. [DOI] [PMC free article] [PubMed] [Google Scholar]
- 58.Perrin A.J., Bisson C., Faull P.A., Renshaw M.J., Lees R.A., Fleck R.A., Saibil H.R., Snijders A.P., Baker D.A., Blackman M.J. Malaria parasite schizont egress antigen-1 plays an essential role in nuclear segregation during schizogony. mBio. 2021;12 doi: 10.1128/mBio.03377-20. 033777-e3420. [DOI] [PMC free article] [PubMed] [Google Scholar]
- 59.Stirling D.R., Swain-Bowden M.J., Lucas A.M., Carpenter A.E., Cimini B.A., Goodman A. CellProfiler 4: improvements in speed, utility and usability. BMC Bioinf. 2021;22:433. doi: 10.1186/s12859-021-04344-9. [DOI] [PMC free article] [PubMed] [Google Scholar]
- 60.Piccinini F., Balassa T., Szkalisity A., Molnar C., Paavolainen L., Kujala K., Buzas K., Sarazova M., Pietiainen V., Kutay U., et al. Advanced Cell Classifier: user-friendly machine-learning-based software for discovering phenotypes in high-content imaging data. Cell Syst. 2017;4:651–655.e5. doi: 10.1016/j.cels.2017.05.012. [DOI] [PubMed] [Google Scholar]
- 61.Hung J., Goodman A., Ravel D., Lopes S.C.P., Rangel G.W., Nery O.A., Malleret B., Nosten F., Lacerda M.V.G., Ferreira M.U., et al. Keras R-CNN: library for cell detection in biological images using deep neural networks. BMC Bioinf. 2020;21:300. doi: 10.1186/s12859-020-03635-x. [DOI] [PMC free article] [PubMed] [Google Scholar]
- 62.Caicedo J.C., Roth J., Goodman A., Becker T., Karhohs K.W., Broisin M., Molnar C., McQuin C., Singh S., Theis F.J., Carpenter A.E. Evaluation of deep learning strategies for nucleus segmentation in fluorescence images. Cytometry A. 2019;95:952–965. doi: 10.1002/cyto.a.23863. [DOI] [PMC free article] [PubMed] [Google Scholar]
- 63.Heaton A., Miripol J., Aster R., Hartman P., Dehart D., Rzad L., Grapka B., Davisson W., Buchholz D.H. Use of Adsol preservation solution for prolonged storage of low viscosity AS-1 red blood cells. Br. J. Haematol. 1984;57:467–478. doi: 10.1111/j.1365-2141.1984.tb02921.x. [DOI] [PubMed] [Google Scholar]
- 64.Kite W.A., Melendez-Muniz V.A., Moraes Barros R.R., Wellems T.E., Sá J.M. Alternative methods for the Plasmodium falciparum artemisinin ring-stage survival assay with increased simplicity and parasite stage-specificity. Malar. J. 2016;15:94. doi: 10.1186/s12936-016-1148-2. [DOI] [PMC free article] [PubMed] [Google Scholar]
- 65.Sonoiki E., Ng C.L., Lee M.C.S., Guo D., Zhang Y.K., Zhou Y., Alley M.R.K., Ahyong V., Sanz L.M., Lafuente-Monasterio M.J., et al. A potent antimalarial benzoxaborole targets a Plasmodium falciparum cleavage and polyadenylation specificity factor homologue. Nat. Commun. 2017;8:14574. doi: 10.1038/ncomms14574. [DOI] [PMC free article] [PubMed] [Google Scholar]
- 66.Ng C.L., Siciliano G., Lee M.C.S., de Almeida M.J., Corey V.C., Bopp S.E., Bertuccini L., Wittlin S., Kasdin R.G., Le Bihan A., et al. CRISPR-Cas9-modified pfmdr1 protects Plasmodium falciparum asexual blood stages and gametocytes against a class of piperazine-containing compounds but potentiates artemisinin-based combination therapy partner drugs. Mol. Microbiol. 2016;101:381–393. doi: 10.1111/mmi.13397. [DOI] [PMC free article] [PubMed] [Google Scholar]
Associated Data
This section collects any data citations, data availability statements, or supplementary materials included in this article.
Supplementary Materials
Listed are the properties used to differentiate a set of two asexual stages, along with the respective linear coefficient for each variable. Properties are ordered by relevance with the most important property for differentiating stages listed first. Hoechst, MitoTracker, and SYTO RNASelect properties are colored in blue, red, and green, respectively.
Data Availability Statement
-
•
Parasite counts for machine learning validation can be found in the supplemental data. All other data in this study will be shared upon request from the lead contact.
-
•
No original code was generated in this paper.
-
•
Additional information needed to reanalyze the data reported here is available upon request from the lead contact.