

Abstract
In 2020, the global prevalence of glaucoma was estimated to be 76 million and it was projected to increase to 111.8 million by 2040. Accurate intraocular pressure (IOP) measurement is imperative in glaucoma management since it is the only modifiable risk factor. Numerous studies have compared the reliability of IOP measured using transpalpebral tonometers and Goldmann applanation tonometry (GAT). This systematic review and meta-analysis aims to update the existing literature with a reliability and agreement comparison of transpalpebral tonometers against the gold standard GAT for IOP measurement among individuals presenting for ophthalmic examinations. The data collection will be performed using a predefined search strategy through electronic databases. Prospective methods-comparison studies published between January 2000 and September 2022 will be included. Studies will be deemed eligible if they report empirical findings on the agreement between transpalpebral tonometry and Goldmann applanation tonometry. The standard deviation and limits of agreement between each study and their pooled estimate along with weights and percentage of error will be reported using a forest plot. Cochrane’s Q test and the I2 statistic will be used to assess heterogeneity, and the publication bias will be investigated using a funnel plot, Begg’s and Egger’s tests. The review results will provide additional evidence on the reliability of transpalpebral tonometers that, in turn, could possibly assist practitioners to make informed decision about using it as a screening or diagnostic device for clinical practice, outreach camps, or home-based screening. Institutional Ethics Committee registration number: RET202200390. PROSPERO Registration Number: CRD42022321693.
Keywords: Agreement and reliability, Goldmann applanation tonometry, methods-comparison studies, systematic review and meta-analysis, transpalpebral tonometers
Glaucoma can be defined in the public health context as a progressive optic neuropathy with characteristic optic nerve head structural changes and functional visual dysfunction often accompanied by typical visual field defects. It is a multifactorial disease and is most often, though not always, associated with increased intraocular pressure (IOP).[1] It is the second leading cause of preventable global blindness among those who are 50 years and older[2] and the third leading cause of blindness globally.[3] The global prevalence of glaucoma in individuals with age between 40 and 80 years is 3.54%. The number of people affected by glaucoma has increased from 64.3 million in 2013 to 76 million in 2020, and it is projected to increase to 111.8 million by 2040.[4] The global distribution of glaucoma is disproportionate, and Asia houses 60% of all patients with glaucoma and 76.7% of those with primary angle-closure glaucoma (PACG).[5]
Elevated IOP is recognized as the most important risk factor for the development and progression of glaucoma.[6] Even though age and family history are considered risk factors, IOP continues to be the only disease-modifying factor that is tractable and predisposed to modulation.[7] A reliable and authentic IOP measurement is imperative since its assessment constitutes the principal screening, diagnosis, and management strategy for patients with glaucoma.[8] Furthermore, there is a 10%–18% increased risk of developing glaucoma for a 1 mmHg increase in IOP, and similarly, an IOP decrease of 1 mmHg curtails the advancement of glaucoma by 10%.[9] This singularly accentuates the importance of accurate IOP measurement for the successful management of glaucoma.
Diverse and distinctive methods of tonometry are in practice for measuring IOP. Since its inception in 1948, Goldmann applanation tonometer (GAT) acquired recognition for its accuracy and reliability in measuring a wide range of IOPs.[10] GAT is still regarded as the “gold standard” that employs a noninvasive measurement technique operating on the Imbert–Fick principle (P = F/A), which states that “the pressure (P) inside an ideal thin-walled sphere is directly related to the force (F) applied to applanate its surface, divided by the flattened area (A).”[11] The precision and repeatability of the device are contingent, assuming a standard central corneal thickness (CCT) of 520 mm (changed to ~ 545 mm for ultrasound optical pachymetry) and a regular corneal composition.[12] GAT measurement is susceptible to discrepancies in CCT[13] and pathological conditions such as corneal curvature, axial length, irregular corneal surface, corneal edema, abnormal corneal curvature, scleral thickness, and rigidity.[14] Besides these deficits, GAT requires anesthesia and is not ideal for resistive patients who are bedridden, in the pediatric setting, as well as for patients who have undergone refractive surgery.[15] Perkins applanation tonometer (PAT) is a portable handheld adaptation of GAT and was proven to provide clinically accepted comparability with that of GAT.[16,17]
Therefore new, portable, noninvasive transpalpebral/eyelid/digital tonometers such as TGDc-01, Diaton, and EASYTON (ET) were introduced to mitigate the measurement error induced by the corneal thickness and other biomechanical properties.[6,18] Numerous research publications have assessed the extent of reliability and applicability of transpalpebral tonometers (TTs) such as TGDc-01,[19] Diaton,[20,21] and EASYTON[22] in clinical practice with variable results. Several publications[15,23] discuss various tonometers in general, and Chakraborty et al.,[6] in their review which compared TT with GAT, concluded that the former overestimated IOP in the lower ranges and underestimated in the higher IOP ranges. In 2012, Cook et al.[18] conducted a meta-analysis which compared the agreement of various tonometers that are in routine use in clinical practice with that of GAT. The study determined a pooled estimate with a mean difference (MD) of − 0.5 mmHg and a 95% limits of agreement (LoA) from − 6.9 to 5.9 mmHg for TTs and 46% of the measurements were estimated to be within the range of 2 mmHg. However, to the best of our knowledge, no meta-analysis has been published recently comparing the reliability of TTs with GAT. Therefore, this systematic review and meta-analysis aims to update the meta-analysis published by Cook et al.[18] by focusing primarily on comparing the reliability and agreement of TTs against the gold standard GAT among individuals presenting for ophthalmic examinations. The current paper describes the methodology employed for conducting the systematic review and meta-analysis.
Methods
Design and registration
A systematic review and meta-analysis study design will be employed to summarize the methods-comparison studies published, which compared TTs with GAT. The development, conduct, design, and reporting of this study protocol are in congruence with the Preferred Reporting Items for Systematic Reviews and Meta-analyses Protocol (PRISMA-P)[24,25] statement and the Guidelines for Reporting Reliability and Agreement Studies (GRRAS).[26] Supplement 1 show the PRISMA-P checklist. This protocol is registered with the International Prospective Register of Systematic Reviews (registration number - CRD42022321693). Even though the current study will use retrospective data, as mandated by our institutional policy, the study with the project code RET202200390 was presented to our Institutional Ethics Committee and was approved on May 30, 2022.
Eligibility criteria
Studies that compare the accuracy of TTs with that of GAT or its equivalent will be considered. A customized search will be conducted to include studies done on human subjects and original research articles published (full text and abstract) in English. When an article is deemed relevant based on the review of its abstract and if the full text is in another language, an attempt will be made to translate the same into English before incorporating it into the review. Studies that used adult participants with normal eyes or with ocular conditions such as glaucoma, ocular hypertension (OHT), and keratoconus will only be included. We will exclude studies that involve children and adolescents (below 18 years). Review articles, case reports, conference abstracts, guidelines, editorials, commentaries, and opinion articles will be excluded. Those studies that compare TTs with other types of tonometers and studies that have used TTs alone without a GAT or PAT comparison will also be excluded.
Search strategy
The data will be gathered employing an electronic search using PubMed, Cochrane Library, and Google Scholar. The search will include a group of terms related to transpalpebral tonometry and IOP measurement. The literature search will include articles published from January 2000 to September 2022. Keywords that will be used in all search engines are (“Tonometer” OR “tonometry” OR “Goldmann Applanation tonometer” OR “contact tonometer” AND “Transpalpebral Tonometer” OR “Digital Eyelid Tonometer” OR “TGDc-01” OR “Diaton” OR “EASYTON”) AND (“Diagnostic accuracy”). Further, in order to ensure the most recent studies are not overlooked, the exact search will be repeated before the final data analysis.
Study selection
The citations ascertained through the search strategy will be exported to Zotero; bibliographic management software and the duplicates will be removed. Two reviewers (NB and JS) will scrutinize the title and abstracts based on predetermined selection criteria, and an inventory of all the selected articles will be created. Any disagreement will be resolved through deliberation and mutual consensus. Full text of all the selected articles will be retrieved and will be read thoroughly to authenticate their appropriateness to be considered for data extraction. The reference lists of all the studies that will be included for analysis will be reviewed to search for any articles that may have been missed during the search. The process of study selection procedure is presented through the PRISMA[27] flow chart [Fig. 1].
Figure 1.
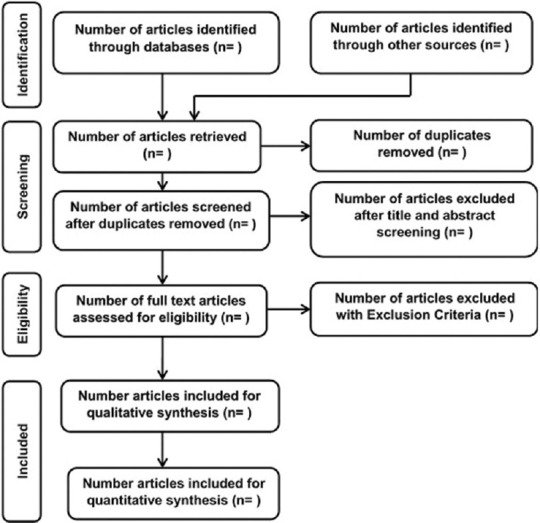
Process of study selection
Data extraction
Data extraction will be performed by two reviewers (JS and VS) using a standard data extraction form that will incorporate essential variables that need to be synthesized from the primary studies. Inconsistency in data extraction between JS and VS will be finalized by the third reviewer BS. To establish whether the agreement between two autonomous reviewers is at random or by chance, Kappa statistics[28] will be used to identify the degree of agreement between the two reviewers.
The following available data will be extracted from the eligible studies using an Excel sheet: the name of the first author and the year of publication, the country in which the study was carried out, study design (retrospective or prospective), the number of eyes included in the study (sample size), mean and standard deviation (SD) of age, mean and SD of IOP measurements for TT and GAT, MD (μ diff), the SD of MD (SD μ diff), LoA (low and high), posture used for obtaining IOP using TT (sitting or supine), and patient preference between the two instruments.
In studies where a single outcome is not reported and where different groups of patients are involved, each group will be considered a separate study. Similarly, in studies that used pre- and post-procedure, each will be considered an independent study. Data will be extracted separately for each of the aforesaid scenarios. Also, if a study has two measurements taken with the same device using two separate enumerators, the measurement taken by the first enumerator will be considered for data extraction.
Statistical analysis
The statistical analysis will be conducted using ReviewManager (RevMan) 5.4 (The Cochrane Collaboration) and StataBE 17 (StataCorp). The risk of bias analysis will be performed using RevMan and the rest of the meta-analysis will be carried out using StataBE 17. The forest plot will be generated to show the individual and pooled SD and 95% LoA, along with the author name, year of publication, study weights, and mean percentage error. Earlier publications on meta-analysis using methods-comparison studies[29,30] have used the framework suggested by Williamson et al.[31] But the current review will attempt to apply a recent framework published by Tipton and Shuster[32] for the meta-analysis of Bland–Altman studies based on the LoA approach.
Assessment of risk of bias
Quality Assessment of Diagnostic Accuracy Studies (QUADAS-2)[33] tool will be used for the assessment of the risk of bias. Quality assessment of bias and applicability has become an indispensable component of the systematic review process which ascertains whether the results of individual studies are valid. The focus is to evaluate the introduction of possible systematic error (i.e., bias) based on the methods adopted, not by the comprehensive assessment of methodological quality. The QUADAS-2 risk of bias evaluation is effected in four major domains, namely, participant selection, index test, reference standard, and flow and timing, which incorporates signaling questions to facilitate risk of bias judgment. Assessment will also be performed to identify applicability concerns that pertain to the first three domains. For each domain and concerns regarding the applicability, studies are rated as “low,” “high,” or “unclear.”[34]
Due to the lack of established guidelines for the quality assessment of method-comparison studies,[31] the assessment question in the QUADAS-2 guidelines will be modified analogously to the approach elaborated by Joosten et al.[30] JS and BS will tailor the quality assessment form to achieve relevance and to make it compatible with the current review comparing the agreement and reliability between TT and GAT. A pilot will be administered to ensure both reviewers achieve consistency in their assessment.
Missing data
The general principles recommended by the Cochrane collaboration will be followed in dealing with the missing data. The corresponding authors of the selected articles will be contacted to request for missing outcome data or, where applicable, for the entire data set to perform further statistical analysis. Pursuant to nonresponse or rejection of data request, data will be imputed based on standardized statistical models. Further, sensitivity analysis will be performed to investigate the robustness and stability of the results, and the potential effect of missing data on review findings will also be discussed.[35]
Testing for heterogeneity
Meta-analysis reporting on heterogeneity has become a standard, and this test explores to ascertain whether the differences between the study findings are due to genuine underlying factors (clinical, methodological or statistical) or due to chance alone.[36] Investigating the existence of coherence among study effects across the included studies in the meta-analysis is imperative since it directly affects the precision with which we can generalize the results of the meta-analysis. The current meta-analysis will use Cochran’s Q test and the I2 statistic to assess heterogeneity among individual studies. It will be considered to have statistically significant heterogeneity when the probability value is less than 0.1 (P < 0.1). A low, moderate, or high heterogeneity will be concluded when the value is less than 25%, between 25% and 75%, and more than 75%, respectively.[37]
Assessment of publication bias
The evidence generated by systematic review and meta-analysis, which explains the best available risks and benefits of medical interventions, has the possibility to facilitate better decision-making in the domain of clinical medicine and public health. However, caution must be applied in interpreting the findings which may be influenced by publication bias that can influence the results drastically. Publication bias refers to the tendency or inclination toward the preparation, submission, and publication of study results that are positive or statistically significant findings.[38] The risk of publication bias will be investigated using a funnel plot, which plots bias against the standard error, and further analysis will be performed using Begg’s rank test[39] and Egger’s weighted regression test.[40]
Subgroup analysis
Subgroup analysis and meta-regression will be used to explain possible sources of statistical heterogeneity when there were differences. The following subgroup analyses will be performed based on the availability of relevant data: (i) devices type, (ii) CCT, (iii) time taken between IOP measurement of TT and GAT, (iv) posture used for the IOP measurement with TT, and (v) patient preference between IOP measured using TT and GAT. The MD will be compared with the listed subgroups to draw appropriate conclusions.
Ethics and dissemination
Systematic review deals with secondary data, and therefore, no primary data will be collected directly from human subject participants. Hence, obtaining informed consent is not necessary. The findings of the review will be promulgated in preeminent peer-reviewed journals and will be disseminated in pertinent forums such as conferences and journal clubs.
Review status
The review team has commenced searching for relevant literature in databases based on the inclusion and exclusion criteria mentioned above. We anticipate to complete the review by January 2023.
Conclusion
The available results on the agreement of transpalpebral tonometers compared with GAT show mixed results. No recently published meta-analysis has exclusively compared the agreement and reliability of transpalpebral tonometers with GAT. Therefore, we envisage that our review results might provide additional evidence on the reliability of transpalpebral tonometers. This, in turn, could potentially assist practitioners in making an informed decision about using it as a screening or diagnostic device for clinical practice, outreach camps, or home-based screening. This, we believe, will contribute towards the efforts to enhance early detection and management of glaucoma so that vision loss due to the condition can be prevented to a great extent.
Financial support and sponsorship
Nil.
Conflicts of interest
There are no conflicts of interest.
Supplement 1: PRISMA-P Checklist
PRISMA-P Checklist.
| Section/Topic | # | Checklist item | Information Reported | Line number(s) | |
|---|---|---|---|---|---|
| Yes | No | ||||
| Administrative Information | |||||
| Title | |||||
| Identification | la | Identify the report as a protocol of a systematic review | ⊠ | □ | 87 |
| Update | lb | If the protocol is for an update of a previous systematic review, identify as such | ⊠ | □ | 80 |
| Registration | 2 | If registered, provide the name of the registry (e.g., PROSPERO) and registration number in the Abstract | ⊠ | □ | 24,25 |
| Authors | |||||
| Contact | 3a | Provide name, institutional affiliation and e-mail address of all protocol authors; provide physical mailing address of corresponding author | ⊠ | □ | Title Page |
| Contributions | 3b | Describe contributions of protocol authors and identify the guarantor of the review | ⊠ | □ | 224-229 |
| Amendments | 4 | If the protocol represents an amendment of a previously completed or published protocol, identify as such and list changes; otherwise, state plan for documenting important protocol amendments | □ | ⊠ | |
| Support | |||||
| Sources | 5a | Indicate sources of financial or other support for the review | □ | ⊠ | NA |
| Sponsor | 5b | Provide name for the review funder and/or sponsor | □ | ⊠ | NA |
| Role of sponsor/funder | 5c | Describe roles of funder(s), sponsor(s), and/or institution(s), if any, in developing the protocol | □ | ⊠ | NA |
| Introduction | |||||
| Rationale | 6 | Describe the rationale for the review in the context of what is already known | ⊠ | □ | 67-82 |
| Objectives | 7 | Provide an explicit statement of the question(s) the review will address with reference to participants, interventions, comparators, and outcomes (PICO) | ⊠ | □ | 79-82 |
| Methods | |||||
| Eligibility criteria | 8 | Specify the study characteristics (e.g., PICO, study design setting, time frame) and report characteristics (e.g., years considered, language, publication status) to be used as criteria for eligibility for the review | ⊠ | □ | 96-107 |
| Information sources | 9 | Describe all intended information sources (e.g., electronic databases, contact with study authors, trial registers, or other grey literature sources) with planned dates of coverage | ⊠ | □ | 109-116 |
| Search strategy | 10 | Present draft of search strategy to be used for at least one electronic database, including planned limits, such that it could be repeated | ⊠ | □ | 112-115 |
| Study Records | |||||
| Data management | 11a | Describe the mechanism(s) that will be used to manage records and data throughout the review | ⊠ | □ | 118,119 |
| Selection process | lib | State the process that will be used for selecting studies (e.g., two independent reviewers) through each phase of the review (i.e., screening, eligibility, and inclusion in meta-analysis) | ⊠ | □ | 119-126 |
| Data collection process | 11c | Describe planned method of extracting data from reports (e.g., piloting forms, done independently, in duplicate), any processes for obtaining and confirming data from investigators | ⊠ | □ | 128-133 |
| Data items | 12 | List and define all variables for which data will be sought (e.g., PICO items, funding sources), any pre-planned data assumptions and simplifications | ⊠ | □ | 134-140 |
| Outcomes and prioritization | 13 | List and define all outcomes for which data will be sought, including prioritization of main and additional outcomes, with rationale | ⊠ | □ | 151-152 |
| Risk of bias in individual studies | 14 | Describe anticipated methods for assessing risk of bias of individual studies, including whether this will be done at the outcome or study level, or both; state how this information will be used in data synthesis | ⊠ | □ | 169-174 |
| Data | |||||
| Synthesis | 15a | Describe criteria under which study data will be quantitatively synthesized | ⊠ | □ | 134-140 |
| 15b | If data are appropriate for quantitative synthesis, describe planned summary measures, methods of handling data, and methods of combining data from studies, including any planned exploration of consistency (e.g., 12, Kendall’s tau) | ⊠ | □ | 176-193 | |
| 15c | Describe any proposed additional analyses (e.g., sensitivity or subgroup analyses, meta-regression) | ⊠ | □ | 227-229 | |
| 15d | If quantitative synthesis is not appropriate, describe the type of summary planned | □ | ⊠ | ||
| Meta-bias(es) | 16 | Specify any planned assessment of meta-bias(es) (e.g., publication bias across studies, selective reporting within studies) | ⊠ | □ | 206-211 |
| Confidence in cumulative evidence | 17 | Describe how the strength of the body of evidence will be assessed (e.g., GRADE) | □ | ⊠ | |
References
- 1.Foster PJ, Buhrmann R, Quigley HA, Johnson GJ. The definition and classification of glaucoma in prevalence surveys. Br J Ophthalmol. 2002;86:238–43. doi: 10.1136/bjo.86.2.238. [DOI] [PMC free article] [PubMed] [Google Scholar]
- 2.Bourne RRA, Steinmetz JD, Saylan M, Mersha AM, Weldemariam AH, Wondmeneh TG, et al. Causes of blindness and vision impairment in 2020 and trends over 30 years, and prevalence of avoidable blindness in relation to VISION 2020:The Right to Sight:An analysis for the Global Burden of Disease Study. Lancet Glob Health. 2021;9:e144–60. doi: 10.1016/S2214-109X(20)30489-7. [DOI] [PMC free article] [PubMed] [Google Scholar]
- 3.Burton MJ, Ramke J, Marques AP, Bourne RRA, Congdon N, Jones I, et al. The Lancet global health commission on global eye health:Vision beyond 2020. Lancet Glob Health. 2021;9:e489–551. doi: 10.1016/S2214-109X(20)30488-5. [DOI] [PMC free article] [PubMed] [Google Scholar]
- 4.Tham Y, Li X, Wong TY, Quigley HA, Aung T, Ed F, et al. Global prevalence of glaucoma and projections of glaucoma burden through 2040:A systematic review and meta-analysis. Ophthalmology. 2014;121:2081–90. doi: 10.1016/j.ophtha.2014.05.013. [DOI] [PubMed] [Google Scholar]
- 5.Wang W. Epidemiological variations and trends in health burden of glaucoma worldwide. Acta Ophthalmol. 2019;97:e349–55. doi: 10.1111/aos.14044. [DOI] [PubMed] [Google Scholar]
- 6.Chakraborty AK, Majumder M, Sen S. Comparison of transpalpebral tonometer with Goldmann applanation tonometer. Taiwan J Ophthalmol. 2014;4:110–5. [Google Scholar]
- 7.Sharma H, Nainiwal SK, Sarraf A, Porwal R, Sharma V. Intraocular pressure measurement techniques :Current concepts and a review. Indian J Clin Exp Ophthalmol. 2020;6:315–23. [Google Scholar]
- 8.Araujo HA, de Araujo JPV, de Medeiros FB, Rebelo PBF, de Medeiros HAG. Comparative study between ocular pressure measurements made by rebot tonometer, pneumatic tonometer, Goldmann tonometry. Rev Bras Oftalmol. 2019;78:162–5. [Google Scholar]
- 9.Nakakura S, Asaoka R, Terao E, Nagata Y, Fukuma Y, Oogi S, et al. Evaluation of rebound tonometer iCare IC200 as compared with IcarePRO and Goldmann applanation tonometer in patients with glaucoma. Eye Vis. 2021;8:1–9. doi: 10.1186/s40662-021-00249-z. [DOI] [PMC free article] [PubMed] [Google Scholar]
- 10.Li Y, Shi J, Duan X, Fan F. Transpalpebral measurement of intraocular pressure using the Diaton tonometer versus standard Goldmann applanation tonometry. Graefe's Arch Clin Exp Ophthalmol. 2010;248:1765–70. doi: 10.1007/s00417-009-1243-y. [DOI] [PubMed] [Google Scholar]
- 11.Goldmann H, Schmidt T. Applanation tonometry. Ophthalmologica. 1957;134:221–42. doi: 10.1159/000303213. [DOI] [PubMed] [Google Scholar]
- 12.Waisbourd M, Shemesh G, Top LB, Lazar M, Loewenstein A. Comparison of the transpalpebral tonometer TGDc-01 with Goldmann applanation tonometry. Eur J Ophthalmol. 2010;20:902–6. doi: 10.1177/112067211002000514. [DOI] [PubMed] [Google Scholar]
- 13.Gordon MO, Beiser JA, Brandt JD, Heuer DK, Higginbotham EJ, Johnson CA, et al. The ocular hypertension treatment study. Arch Ophthalmol. 2002;120:714–20. doi: 10.1001/archopht.120.6.714. [DOI] [PubMed] [Google Scholar]
- 14.Toker MI, Vural A, Erdogan H, Topalkara A, Arici MK. Central corneal thickness and Diaton transpalpebral tonometry. Graefe's Arch Clin Exp Ophthalmol. 2008;246:881–9. doi: 10.1007/s00417-008-0769-8. [DOI] [PubMed] [Google Scholar]
- 15.Okafor KC, Brandt JD. Measuring intraocular pressure. Curr Opin Ophthalmol. 2015;26:103–9. doi: 10.1097/ICU.0000000000000129. [DOI] [PubMed] [Google Scholar]
- 16.Eriksson E, Davidsson L, Brautaset R. A comparative study of the tonometers:Goldmann applanation, Perkins, Tono-Pen XL and Reichert 7CR. Int J Ophthalmic Pract. 2012;2:246–51. [Google Scholar]
- 17.Arora R, Bellamy H, Austin MW. Applanation tonometry:A comparison of the perkins handheld and goldmann slit lamp-mounted methods. Clin Ophthalmol. 2014;8:605–10. doi: 10.2147/OPTH.S53544. [DOI] [PMC free article] [PubMed] [Google Scholar]
- 18.Cook JA, Botello AP, Elders A, Fathi Ali A, Azuara-Blanco A, Fraser C, et al. Systematic review of the agreement of tonometers with Goldmann applanation tonometry. Ophthalmology. 2012;119:1552–7. doi: 10.1016/j.ophtha.2012.02.030. [DOI] [PubMed] [Google Scholar]
- 19.Sandner D, Böhm A, Kostov S, Pillunat L. Measurement of the intraocular pressure with the “transpalpebral tonometer”TGDc-01 in comparison with applanation tonometry. Graefes Arch Clin Exp Ophthalmol. 2005;243:563–9. doi: 10.1007/s00417-004-1037-1. [DOI] [PubMed] [Google Scholar]
- 20.Bali SJ, Bhartiya S, Sobti A, Dada T, Panda A. Comparative evaluation of Diaton and Goldmann applanation tonometers. Ophthalmologica. 2012;228:42–6. doi: 10.1159/000336047. [DOI] [PubMed] [Google Scholar]
- 21.Nadeem S, Naeem BA, Tahira R, Khalid S, Hannan A. Comparison of Goldmann applanation, Diaton transpalpebral and air puff tonometers. Pak J Ophthalmol. 2015;31:33–9. [Google Scholar]
- 22.Karlova EV, Zolotarev AV, Milyudin ES, Pershakova AE. Transpalpebral tonometry in patients after penetrating keratoplasty. Clin Ophthalmol. 2020;20:175–9. [Google Scholar]
- 23.Garcia-Feijoo J, Martinez-de-la-Casa JM, Morales-Fernandez L, Frances FS, Santos-Bueso E, Garcia-Saenz S, et al. New technologies for measuring intraocular pressure. In: Bagetta G, Nucci C, editors. New Trends in Basic and Clinical Research of Glaucoma:A Neurodegenerative Disease of the Visual System, Part B. Oxford: Elsevier B. V; 2015. pp. 67–79. [Google Scholar]
- 24.Moher D, Shamseer L, Clarke M, Ghersi D, Liberati A, Petticrew M, et al. Preferred reporting items for systematic review and meta-analysis protocols (PRISMA-P) 2015 statement. Syst Rev. 2015;4:1. doi: 10.1186/2046-4053-4-1. [DOI] [PMC free article] [PubMed] [Google Scholar]
- 25.Shamseer L, Moher D, Clarke M, Ghersi D, Liberati A, Petticrew M, et al. Preferred reporting items for systematic review and meta-analysis protocols (prisma-p) 2015:Elaboration and explanation. BMJ. 2015;349:g7647. doi: 10.1136/bmj.g7647. doi:10.1136/bmj.g7647. [DOI] [PubMed] [Google Scholar]
- 26.Kottner J, Audigé L, Brorson S, Donner A, Gajewski BJ, Hróbjartsson A, et al. Guidelines for reporting reliability and agreement studies (GRRAS) were proposed. J Clin Epidemiol. 2011;64:96–106. doi: 10.1016/j.jclinepi.2010.03.002. [DOI] [PubMed] [Google Scholar]
- 27.Page MJ, McKenzie JE, Bossuyt PM, Boutron I, Hoffmann TC, Mulrow CD, et al. The PRISMA 2020 statement:An updated guideline for reporting systematic reviews. BMJ. 2021;372:n71. doi: 10.1136/bmj.n71. doi:10.1136/bmj.n71. [DOI] [PMC free article] [PubMed] [Google Scholar]
- 28.Viera AJ, Garrett JM. Understanding interobserver agreement:The Kappa statistic. Fam Med. 2005;37:360–3. [PubMed] [Google Scholar]
- 29.Suehiro K, Joosten A, Murphy LSL, Desebbe O, Alexander B, Kim SH, et al. Accuracy and precision of minimally-invasive cardiac output monitoring in children:A systematic review and meta-analysis. J Clin Monit Comput. 2016;30:603–20. doi: 10.1007/s10877-015-9757-9. [DOI] [PubMed] [Google Scholar]
- 30.Joosten A, Desebbe O, Suehiro K, Murphy LSL, Essiet M, Alexander B, et al. Accuracy and precision of non-invasive cardiac output monitoring devices in perioperative medicine:A systematic review and meta-analysis. Br J Anaesth. 2017;118:298–310. doi: 10.1093/bja/aew461. [DOI] [PubMed] [Google Scholar]
- 31.Williamson PR, Lancaster GA, Craig JV, Smyth RL. Meta-analysis of method comparison studies. Stat Med. 2002;21:2013–25. doi: 10.1002/sim.1158. [DOI] [PubMed] [Google Scholar]
- 32.Tipton E, Shuster J. A framework for the meta-analysis of Bland–Altman studies based on a limits of agreement approach. Stat Med. 2017;36:3621–35. doi: 10.1002/sim.7352. [DOI] [PMC free article] [PubMed] [Google Scholar]
- 33.Reitsma JB, Leeflang MMG, Sterne JAC, Bossuyt PMM, Whiting PF, Rutjes AWSS, et al. QUADAS-2:A revised tool for the quality assessment of diagnostic accuracy studies. Ann Intern Med. 2011;155:529–36. doi: 10.7326/0003-4819-155-8-201110180-00009. [DOI] [PubMed] [Google Scholar]
- 34.Deeks JJ, Bossuyt PMM, Leeflang MM, Takwoingi Y, Flemyng E. Cochrane Handbook for Systematic Reviews of Diagnostic Test Accuracy Version 2. London: Cochrane; 2022. Available from:https://training.cochrane.org/handbook-diagnostic-test-accuracy . [DOI] [PMC free article] [PubMed] [Google Scholar]
- 35.Mavridis D, Chaimani A, Efthimiou O, Leucht S, Salanti G. Addressing missing outcome data in meta-analysis. Evid Based Ment Health. 2014;17:85–9. doi: 10.1136/eb-2014-101900. [DOI] [PubMed] [Google Scholar]
- 36.Deeks J, Higgins JP, Altman DG. Higgins J, Thomas J, Chandler J, Cumpston M, Li T, Page M, et al., editors. Analysing data and undertaking meta-analyses. Cochrane Handbook for Systematic Reviews of Interventions version 62. Chapter 10. Cochrane. 2021. Available from:https://training.cochrane.org/handbook/current/chapter-10 .
- 37.Higgins JPT, Thompson SG, Deeks JJ, Altman DG. Measuring inconsistency in meta-analyses. BMJ. 2003;327:557–60. doi: 10.1136/bmj.327.7414.557. [DOI] [PMC free article] [PubMed] [Google Scholar]
- 38.Rothstein HR, Sutton AJ, Borenstein M. Publication Bias in Meta-Analysis:Prevention, Assessment and Adjustments. Chichester: John Wiley &Sons Ltd; 2005. pp. 1–356. [Google Scholar]
- 39.Begg CB, Mazumdar M. Operating characteristics of a rank correlation test for publication bias. Biometrics. 1994;50:1088–101. [PubMed] [Google Scholar]
- 40.Peters JL, Sutton AJ, Jones DR, Abrams KR, Rushton L. Comparison of two methods to detect publication bias in meta-analysis. JAMA. 2006;295:676–80. doi: 10.1001/jama.295.6.676. [DOI] [PubMed] [Google Scholar]