Abstract
Objective
The study aimed to evaluate the prognostic value of relative wall thickness (RWT) in the patients with ST-segment elevation myocardial infarction (STEMI).
Methods
A total of 866 patients with STEMI admitted in Nanjing Drum Tower Hospital, The Affiliated Hospital of Nanjing University Medical School from November 2010 to December 2018 were enrolled in the current study retrospectively. Three methods were used to calculate RWT: RWTPW, RWTIVS+PW and RWTIVS. The included patients were divided according to the median values of RWTPW, RWTIVS+PW, and RWTIVS, respectively. Survival analysis were performed with Kaplan–Meier plot and multivariate Cox proportional hazard model was established to evaluate the adjusted hazard ratio of the three kinds of RWT for all cause death, cardiac death and MACE (major adverse cardiac death).
Results
There was no significance for the survival analysis between the low and high groups of RWTPW, RWTIVS+PW and RWTIVS at 30 days and 12 months. Nonetheless, the cumulative incidence of all cause death and cardiac death in the low group of RWTPW and RWTIVS+PW was higher than those in the high group at 60 months. The cumulative incidence of MACE in the low group of RWTPW was higher than the high group at 60 months. Multivariate Cox regression model showed that RWTPW were inversely associated with long-term cardiac death and MACE in STEMI patients. In the subgroup analysis, three calculations of RWT had no predictive value for the patients with anterior myocardial infarction. By contrast, RWTPW was the most stable independent predictor for the long-term outcomes of the patients with non-anterior myocardial infarction.
Conclusion
RWTPW, RWTIVS+PW and RWTIVS had no predictive value for the long-term clinical outcomes of patients with anterior myocardial infarction, whereas RWTPW was a reliable predictor for all cause death, cardiac death and MACE in patients with non-anterior myocardial infarction.
Keywords: Relative wall thickness, ST-segment elevation myocardial infarction, Primary percutaneous coronary intervention, Prognosis, Echocardiography
Key message
RWT is an index which can quantified the concentricity or eccentricity of the left ventricular using a simple formula.
There are three methods to calculate RWT: RWTPW = 2 × PWth/LVDd; RWTIVS+PW = (IVSth + PWth)/LVDd; RWTIVS = 2 × IVSth/LVDd(IVSth: intraventricular septal thickness; LVDd: LV diameter at the end of diastole; PWth: posterior wall thickness).
From our study we concluded that RWTPW, RWTIVS+PW and RWTIVS had no predictive value for the long-term clinical outcomes of patients with anterior myocardial infarction, whereas RWTPW was the most effective predictor of patients with non-anterior myocardial infarction.
Introduction
The primary percutaneous coronary intervention (pPCI) has been the first line therapy for ST-segment elevation myocardial infarction (STEMI) for decades, which has remarkably reduced the in-hospital mortality of the patients with STEMI. However, the patients still face an elevated risk of subsequent cardiovascular events [1, 2]. The risk stratification of these patients remains a challenge and is important to the subsequent treatment and health management [3]. After acute myocardial infarction (MI), ventricular remodeling occurs promptly, such as change of the structure, morphology and ventricular function, which is a manifestation of left ventricular enlargement, decreased left ventricle ejection fraction (LVEF) and abnormal regional wall motion [4]. Previous studies have identified various predictors for the clinical outcomes of STEMI, including LVEF, brain natriuretic peptide (BNP), estimated glomerular filtration rate (eGFR) and high-sensitive C-reactive protein [5–8]. However, these indices are unable to reflect the pattern of the ventricular remodeling. Relative wall thickness (RWT) is an index which can quantify the concentricity or eccentricity of the left ventricular using a simple formula. There are three methods to calculate RWT: RWTPW = 2 × PWth/LVDd; RWTIVS+PW = (IVSth + PWth)/LVDd; RWTIVS = 2 × IVSth/LVDd (IVSth: intraventricular septal thickness; LVDd: LV diameter at the end of diastole; PWth: posterior wall thickness; PW refers to LVPW) [9]. Previous studies have found that a higher RWT was associated with a poorer prognosis of patients with acute decompensated heart failure (including heart failure with preserved or reduced ejection fraction). Besides, a lower RWT was also related to a higher incidence of ventricular arrhythmia in patients with left ventricular dysfunction [9, 10]. So far, RWTPW is the most widely used method in the clinical practice. Nevertheless, the predictive value of RWT as calculated by different methods has not been reported for the clinical outcomes of the patients with STEMI. Thus, we carried out the current study to evaluate the prognostic value of RWT in a cohort of STEMI patients.
Methods
Study population
The diagnosis of STEMI was based on the criteria of American College of Cardiology/American Heart Association (ACC/AHA) and the European Society of Cardiology (ESC) [3, 11]. This is a single-center observational study. The data of the study population were obtained from the databases in our institution. The ethics has been approved by the Medical Ethics Committee of Nanjing Drum Tower Hospital, Medical School of Nanjing University (2019–190-01). The relevant data were published with the verbal consent by the participants and has been approved by the ethics committee.
The including criteria were as follows: (1) patients between 18 and 90 years; (2) all patients presented acute chest pain in the emergency department of our hospital; (3) STEMI was diagnosed by electrocardiography (ECG) in emergency department; (4) the patients were eligible for pPCI and willing to accept the procedure.
The exclusion criteria were as follows: (1) the patients did not undergo the emergency angiography; (2) the patients did not undergo the emergency revascularization after angiography; (3) the patients were suitable for the emergency coronary artery bypass graft surgery (CABG); (4) the patients were lost to follow-up [12].
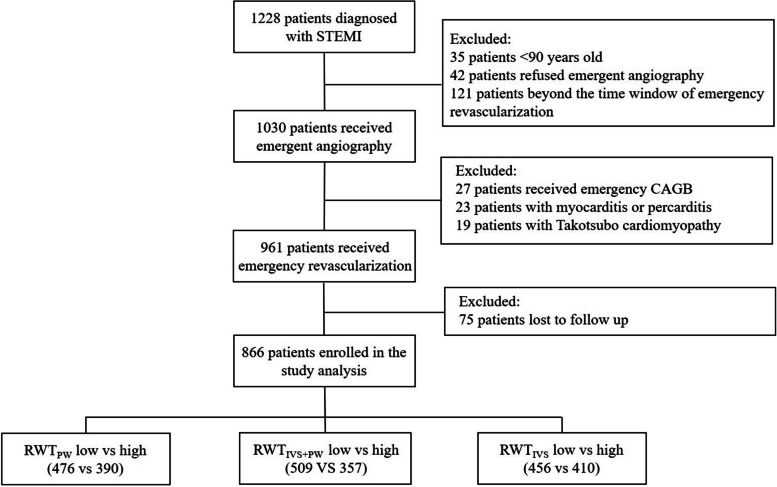
Consequently, 866 patients with STEMI admitted in Nanjing Drum Tower Hospital, The Affiliated Hospital of Nanjing University Medical School from November 2010 to January 2018 were enrolled in the current study analysis. The included patients were divided according to the median values of RWTPW, RWTIVS+PW, and RWTIVS, respectively. The enrollment flow chart was shown in the Fig. 1.
Fig. 1.
Flowchart of patients inclusion. The data was divided into ‘low’ and ‘high’ according to the median. STEMI: ST-segment elevation myocardial infraction; CABG: coronary artery bypass grafting; RWT: relative wall thickness
Study protocol
ECG was performed within 10 min for all patients with acute chest pain. STEMI was defined as ST segment elevation at the J point in at least 2 contiguous leads of above 2 mm in men or above1.5 mm in women at V2 and V3 lead and/or of above 1 mm in other leads. The new onset of left bundle branch block on the ECG was considered as STEMI [13]. The patients were taken to catheterization laboratory immediately after taking 300 mg aspirin and 180 mg ticagrelor/600 mg clopidogrel. Revascularization strategy was individualized according to the angiography results and interventionists’ decisions. Standardized treatments of STEMI during and after hospitalization were in accordance to the guidelines. All patients received cardiac function assessment within 48 h after admission. Philips IE33 ultrasound machine was used for echocardiography examination and Simpson algorithm was used to identify the left ventricular ejection fraction. All the procedures were accomplished by experienced and qualified doctors.
Follow up
The study population was followed up via telephone or outpatient department. The follow-up was carried out until 1st March, 2022. Endpoints include all cause death, cardiac death, and major adverse cardiac events (MACE) at 30 days, 12 months and 60 months. All cause death was defined as death to any causes. Cardiac death was defined as the death due to any cardiac diseases, such as myocardial infarction, cardiac rupture, arrhythmia, heart failure and so on. MACE was defined as a composite of cardiac death, recurrent angina or MI, exacerbation of heart failure and non-fatal ischemic stroke.
Statistical analysis
The continuous variables were presented as the mean ± standard deviations (SD) or median and interquartile range (IQR) according to the data distribution. The categorical variables were presented as frequency and percentages. In two-group comparisons, Student’s t-test and the Mann–Whitney U test were used to compare normally distributed and non-normally distributed continuous variables, respectively. χ2 test or Fisher’s exact test was used for categorical variables. Survival analysis was performed by Kaplan–Meier plot and Log rank test. Cox proportional hazard models were established to estimate the adjusted hazard ratio (HR) of RWT for different endpoints. The restricted cubic spline models with 3 knots placed at 10th, 50th and 90th percentile of RWT were used to evaluate the association between RWT (as a continuous term) and the endpoints. There were total 25 variables including 14 continuous variables (age, systolic bleed pressure, heart rate, shock index, creatinine, LDL-C, LVEF, LVDd, IVSth, PWth, LA, RWTPW, RWTIVS+PW and RWTIVS) and 11 categorical variables (male sex, shock, hypertension, diabetes, hyperlipidemia, prior stroke, smoking, family history, anterior wall, multivessel lesions, Killip classification). After univariate analysis, the covariates with P < 0.1 and the covariates with P > 0.1 but with clinical significance were extracted for multivariate regression analysis. An interaction analysis model was established to study whether there is interaction between variables. A two-tailed P value < 0.05 is considered as statistically significant. The statistical analysis was performed by SPSS 25.0 (SPSS Inc., Chicago, Ill., USA) and R 4.0 (R core team 2020, R Foundation for statistical computing, Vienna, Austria).
Results
Basic characteristics of study cohort
The median age of the patients was 65 years (IOR: 54-74 years) and 80.3% were male. The median value of the RWTPW, RWTIVS+PW and RWTIVS for the three different calculation methods was 0.32, 0.33 and 0.33, respectively. According to the three median values, the patients were divided into low group and high group, respectively. No matter which calculation method was used, the patients in the low group had lower LVEF, IVSth, PWth and higher LVDd value than those in the high group. In addition, less patients had hypertension and more patients had anterior myocardial infarction in the low group as compared to the high group. The patients in low group of RWTPW had lower systolic blood pressure, higher value of left atrium (LA), low density lipoprotein cholesterol (LDL-C) and shock index than high group. The patients in low group of RWTIVS+PW had less patients with diabetes than high group. The patients in low group of RWTIVS had less patients with diabetes, higher LA value and older than high group (Table 1).
Table 1.
Comparison of baseline characteristics of patient cohort in the three calculation methods
| RWTPW | RWTIVS+PW | RWTIVS | |||||||
|---|---|---|---|---|---|---|---|---|---|
| Low Group (≤ 0.32,n = 476) | High Group (> 0.32,n = 390) | P value | Low Group (≤ 0.33,n = 509) | High Group (> 0.33,n = 357) | P Value | Low Group (≤ 0.33,n = 456) | High Group (> 0.33,n = 410) | P Value | |
| Age(years) | 64.71(55–74) | 63.1(53–74) | 0.114 | 64.3(54–74) | 63.37(54–73) | 0.285 | 64.71(54–75) | 63.07(53.5–72.5) | 0.039 |
| Male sex,n(%) | 353(79.9) | 337(81.0) | 0.673 | 372(80.0) | 318(80.9) | 0.736 | 337(79.5) | 353(81.3) | 0.494 |
| Shock,n(%) | 29(6.6) | 18(4.3) | 0.151 | 29(6.2) | 18(4.6) | 0.288 | 27(6.4) | 20(4.6) | 0.257 |
| Bleeding,n(%) | 15(3.7) | 7(1.8) | 0.089 | 11(2.6) | 11(2.9) | 0.790 | 11(2.8) | 11(2.6) | 0.873 |
| History of cancer,n(%) | 11(2.7) | 4(1.0) | 0.073 | 10(2.3) | 5(1.3) | 0.281 | 9(2.3) | 6(1.4) | 0.361 |
| Hypertension,n(%) | 254(57.5) | 274(65.9) | 0.011 | 263(56.6) | 265(67.4) | 0.001 | 235(55.4) | 293(67.5) | < 0.001 |
| Diabetes,n(%) | 116(26.2) | 111(26.7) | 0.884 | 101(21.7) | 126(32.1) | 0.001 | 92(21.7) | 135(31.1) | 0.002 |
| Hyperlipidemia,n(%) | 64(14.5) | 69(16.6) | 0.394 | 67(14.4) | 66(16.8) | 0.336 | 59(13.9) | 74(17.1) | 0.205 |
| Prior stroke,n(%) | 60(13.6) | 53(12.7) | 0.718 | 64(13.8) | 49(12.5) | 0.576 | 56(13.2) | 57(13.1) | 0.974 |
| Smoking,n(%) | 256(57.9) | 226(54.3) | 0.289 | 272(58.5) | 210(53.4) | 0.137 | 240(56.6) | 242(55.8) | 0.803 |
| Family history,n(%) | 18(5.6) | 8(2.7) | 0.069 | 17(5.0) | 9(3.2) | 0.283 | 14(4.6) | 12(3.8) | 0.616 |
| Systolic blood pressure(mmHg) | 120.09(105–132) | 124.67(110–139) | 0.001 | 120.65(106–132) | 124.28(110–139) | 0.012 | 120.71(106–132) | 123.87(109–138) | 0.035 |
| Heart rate(bpm) | 81.31(71–90) | 81.48(70–92) | 0.721 | 81.25(71–90) | 81.56(70–91) | 0.558 | 81.09(71–90) | 81.68(70–91) | 0.389 |
| Shock index | 0.70(0.57–0.79) | 0.67(0.55–0.76) | 0.030 | 0.69(0.57–0.78) | 0.68(0.55–0.78) | 0.147 | 0.69(0.56–0.78) | 0.68(0.55–0.78) | 0.500 |
| Creatinine(umol/L) | 80.37(62–86) | 78.17(61–86) | 0.430 | 79.37(62–86) | 79.07(61–85) | 0.371 | 79.80(62.5–86) | 78.67(61–85) | 0.378 |
| LDL-C(mmol/L) | 3.09(1.87–2.84) | 2.49(1.95–2.97) | 0.019 | 3.09(1.91–2.90) | 2.46(1.91–2.94) | 0.316 | 3.15(1.91–2.89) | 2.45(1.91–2.94) | 0.385 |
| LVEF(%) | 44.53(40–49) | 46.47(42–50) | < 0.001 | 44.06(40–48) | 47.15(44–50) | < 0.001 | 43.59(39–48) | 47.34(45–50) | < 0.001 |
| LVDd(cm) | 5.54(5.26–5.72) | 5.18(3.7–4.1) | < 0.001 | 5.53(5.25–5.70) | 5.16(4.90–5.40) | < 0.001 | 5.55(5.3–5.74) | 5.17(4.91–5.4) | < 0.001 |
| IVSth(cm) | 0.83(0.75–0.9) | 0.97(0.85–1.05) | < 0.001 | 0.81(0.75–0.86) | 1.00(0.90–1.05) | < 0.001 | 0.80(0.75–0.85) | 1.0(0.90–1.05) | < 0.001 |
| PWth(cm) | 0.81(0.8–0.85) | 0.95(0.89–1) | < 0.001 | 0.82(0.80–0.85) | 0.95(0.85–1.0) | < 0.001 | 0.83(0.80–0.88) | 0.92(0.82–1.0) | < 0.001 |
| LA(cm) | 4.09(3.75–4.2) | 3.95(3.7–4.1) | 0.020 | 4.07(3.75–4.2) | 3.96(3.75–4.14) | 0.237 | 4.09(3.77–4.2) | 3.96(3.74–4.15) | 0.048 |
| Anterior wall,n(%) | 216(51.9) | 188(42.5) | 0.006 | 242(52.0) | 162(41.2) | 0.002 | 250(59.0) | 154(35.5) | < 0.001 |
| Multivessel lesions,n(%) | 164(37.1) | 140(33.7) | 0.291 | 166(35.7) | 138(35.1) | 0.858 | 146(34.4) | 158(36.4) | 0.546 |
The continous variables were presented as mean ± SD or median(IQR)
LDL-C Low density lipoprotein cholesterol, LVEF Left ventricular ejection fraction, LVDd Left ventricular diameter at the end of diastole, IVSth Intraventricular septal thickness, PWth Posterior wall thickness, LA Left atrium
Survival analysis
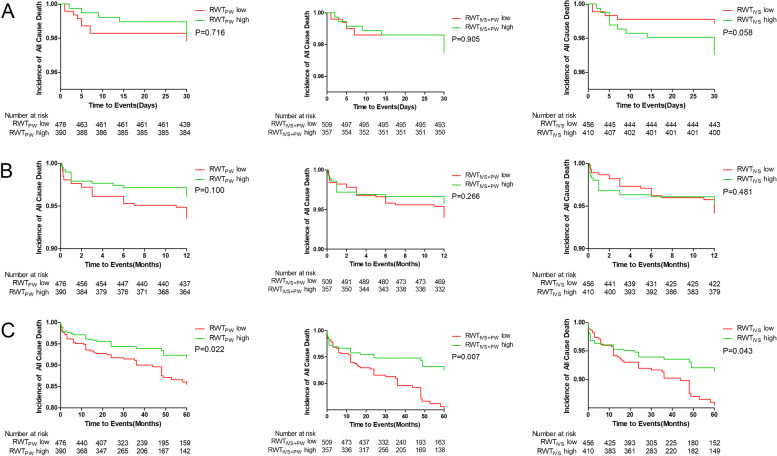
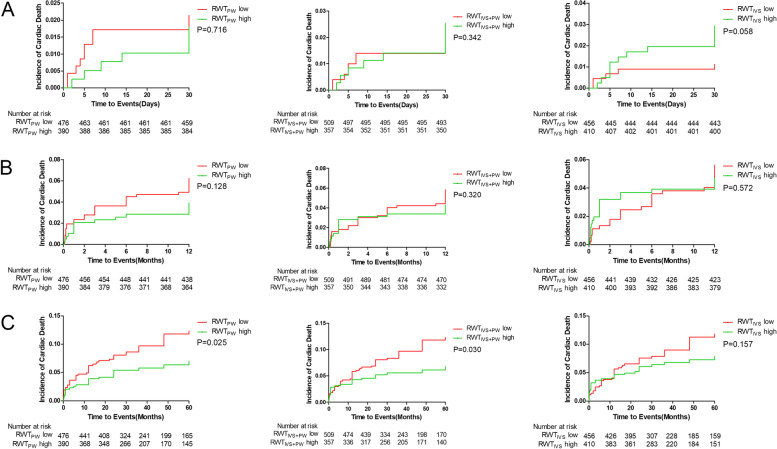
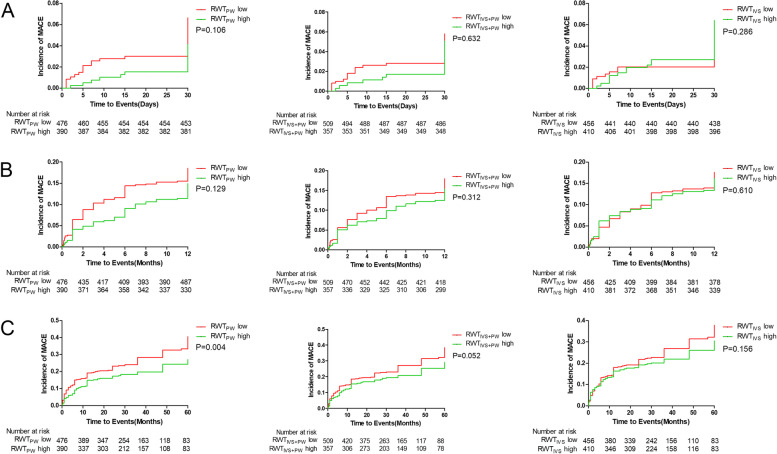
The median follow-up period was 54.3 months (22.0–78.7 months). During follow-up, 83(9.6%) patients died. Comparing low and high group of RWTPW, RWTIVS+PW and RWTIVS, there was no significant difference in the incidence of all cause death, cardiac death and MACE at 30 days and 12 months (Fig. 2, 3 and 4). The incidence of the all cause death in 60 months was significantly higher in the low groups as compared to the high groups (RWTPW:11.5% vs 6.9%, P = 0.022; RWTIVS+PW:11.6% vs 6.4%, P = 0.007; RWTIVS:11.4% vs 7.3%, P = 0.043) (Fig. 2). The incidence of the cardiac death in 60 months was significantly different when RWTPW and RWTIVS+PW were used (RWTPW: 10.5% vs 6.2%, P = 0.025; RWTIVS+PW:10.2% vs 6.2%, P = 0.030) (Fig. 3). The incidence of MACE in 60 months was significantly different between the low groups and high group of RWTPW (RWTPW:29.7% vs 21.3%, P = 0.004) (Fig. 4).
Fig. 2.
Survival analysis curve of all cause death at 30 days(A), 12 months(B) and 60 months(C)
Fig. 3.
Survival analysis curve of cardiac death at 30 days(A), 12 months(B) and 60 months(C)
Fig. 4.
Survival analysis curve of MACE at 30 days(A), 12 months(B) and 60 months(C)
Cox proportional hazard models for the endpoints
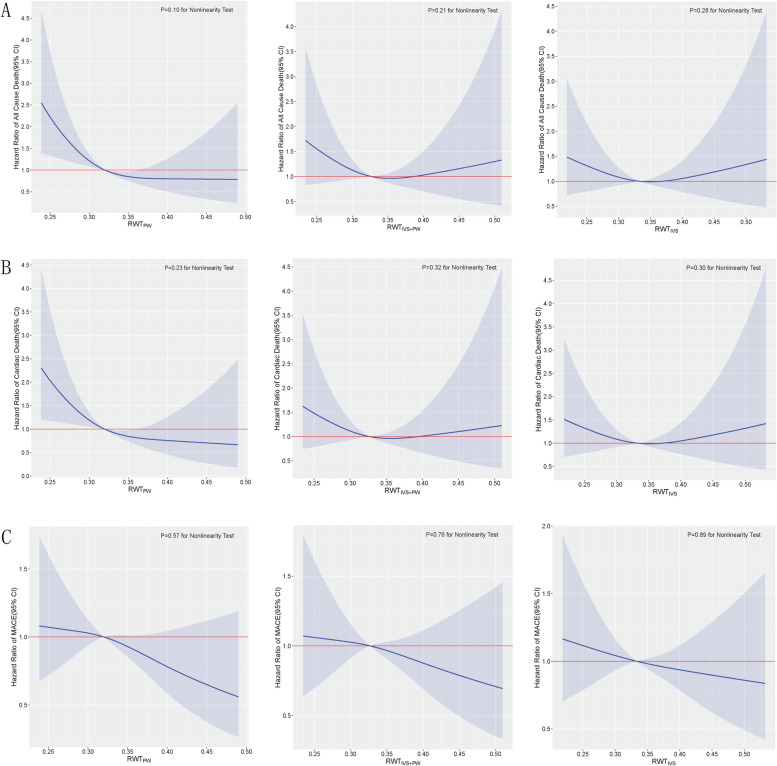
The restricted cubic spline models were illustrated in Fig. 5, and no evidence of non-linearity was observed.
Fig. 5.
Multivariable adjusted hazrad ratios for all cause death(A), cardiac death(B) and MACE(C) according to three calculation methods of RWT on a continuous scale. Reference lines for no association are indicated by solid red lines at a hazard ratio of 1.0. Solid blue lines are multivariable adjusted hazrad ratios, with blue shadow showing 95% confidence intervals derived from restricted cubic spliners regression with three knots
The crude and adjusted association of RWTPW, RWTIVS+PW and RWTIVS with all cause death, cardiac death, and MACE are presented in Table 2. Two models were used to adjust the covariates for evaluating the stability of the model. Model 1 included male sex, age, hypertension, diabetes, smoking, prior stroke and hyperlipidemia. Model 2 included sex, age, hypertension, diabetes, smoking, prior stroke, hyperlipidemia, creatinine, LVEF, shock index, Killip classification and multivessel lesions. Higher levels of RTWPW were independently associated with a lower incidence of the cardiac death and MACE. The adjusted HR per 0.1 increase of RTWPW for cardiac death and MACE were 0.38 and 0.68, respectively.
Table 2.
Multivariate Cox regression analysis of the overall cohort
| RWTPW (per 0.1 increased) | RWTIVS+PW (per 0.1 increased) | RWTIVS (per 0.1 increased) | |||||||
|---|---|---|---|---|---|---|---|---|---|
| HR | 95%CI | P Value | HR | 95%CI | P Value | HR | 95%CI | P Value | |
| All cause death | |||||||||
| Unadjusted | 0.38 | 0.23–0.65 | < 0.001 | 0.37 | 0.28–0.61 | < 0.001 | 0.46 | 0.31–0.69 | < 0.001 |
| Adjusted with Model1 | 0.47 | 0.29–0.78 | 0.003 | 0.46 | 0.29–0.74 | 0.001 | 0.56 | 0.38–0.81 | 0.002 |
| Adjusted with Model2 | 0.62 | 0.38–1.02 | 0.057 | 0.70 | 0.44–1.11 | 0.130 | 0.8 | 0.55–1.17 | 0.260 |
| Cardiac death | |||||||||
| Unadjusted | 0.38 | 0.22–0.66 | 0.001 | 0.36 | 0.21–0.61 | < 0.001 | 0.45 | 0.29–0.68 | < 0.001 |
| Adjusted with Model1 | 0.47 | 0.28–0.80 | 0.005 | 0.45 | 0.27–0.74 | 0.002 | 0.54 | 0.36–0.81 | 0.003 |
| Adjusted with Model2 | 0.55 | 0.33–0.89 | 0.016 | 0.70 | 0.44–1.11 | 0.130 | 0.81 | 0.54–1.21 | 0.310 |
| MACE | |||||||||
| Unadjusted | 0.68 | 0.53–0.91 | 0.008 | 0.68 | 0.53–0.89 | 0.004 | 0.73 | 0.59–0.91 | 0.005 |
| Adjusted with Model1 | 0.73 | 0.56–0.95 | 0.027 | 0.74 | 0.57–0.95 | 0.019 | 0.78 | 0.64–0.97 | 0.024 |
| Adjusted with Model2 | 0.74 | 0.57–0.98 | 0.030 | 0.82 | 0.63–1.06 | 0.130 | 0.86 | 0.69–1.07 | 0.180 |
Model 1: sex, age, hypertension, diabetes, smoking, prior stroke, hyperlipidemia
Model 2: sex, age, hypertension, diabetes, smoking, prior stroke, hyperlipidemia, creatinine, left ventricular ejection fraction (LVEF), shock index, killips classification, multivessel lesion
The patients were divided into anterior wall infarction subgroup and non-anterior wall infarction subgroup according to whether the anterior wall was involved. In the anterior wall subgroup, RWTPW, RWTIVS+PW and RWTIVS were all inversely associated with the incidence of the all cause death and cardiac death before adjustment. After adjusted by model 1 and model 2, there was no significant difference in the incidence of the all cause death, cardiac death and MACE (Table 3).
Table 3.
Multivariate Cox regression analysis for the anterior infarction group
| RWTPW (per 0.1 increased) | RWTIVS+PW (per 0.1 increased) | RWTIVS (per 0.1 increased) | |||||||
|---|---|---|---|---|---|---|---|---|---|
| HR | 95%CI | P Value | HR | 95%CI | P Value | HR | 95%CI | P Value | |
| All cause death | |||||||||
| Unadjusted | 0.46 | 0.23–0.92 | 0.029 | 0.41 | 0.21–0.81 | 0.010 | 0.46 | 0.26–0.82 | 0.008 |
| Adjusted with Model1 | 0.68 | 0.35–1.32 | 0.260 | 0.57 | 0.31–1.08 | 0.080 | 0.63 | 0.37–1.08 | 0.090 |
| Adjusted with Model2 | 0.94 | 0.47–1.88 | 0.860 | 0.86 | 0.45–1.63 | 0.650 | 0.82 | 0.48–1.40 | 0.470 |
| Cardiac death | |||||||||
| Unadjusted | 0.49 | 0.24–1.00 | 0.050 | 0.44 | 0.22–0.88 | 0.020 | 0.49 | 0.30–0.87 | 0.020 |
| Adjusted with Model1 | 0.64 | 0.33–1.24 | 0.180 | 0.61 | 0.32–1.16 | 0.130 | 0.66 | 0.38–1.14 | 0.140 |
| Adjusted with Model2 | 1.07 | 0.56–2.07 | 0.830 | 0.79 | 0.41–1.52 | 0.470 | 0.80 | 0.46–1.39 | 0.420 |
| MACE | |||||||||
| Unadjusted | 0.89 | 0.63–1.27 | 0.510 | 0.83 | 0.60–1.17 | 0.300 | 0.84 | 0.63–1.11 | 0.230 |
| Adjusted with Model1 | 0.96 | 0.66–1.38 | 0.870 | 0.99 | 0.71–1.38 | 0.970 | 0.97 | 0.73–1.30 | 0.860 |
| Adjusted with Model2 | 0.97 | 0.68–1.38 | 0.850 | 1.01 | 0.72–1.41 | 0.970 | 0.99 | 0.73–1.32 | 0.930 |
Model 1: sex, age, hypertension, diabetes, smoking, prior stroke, hyperlipidemia
Model 2: sex, age, hypertension, diabetes, smoking, prior stroke, hyperlipidemia, creatinine, left ventricular ejection fraction (LVEF), shock index, Killips classification, multivessel lesion
In non-anterior wall subgroup, all three calculations of RWT were significantly associated with the incidence of the all cause death, cardiac death and MACE before adjusted. After adjusted by model 1 and model 2, only RWTPW (HR:0.30, 95%CI:0.12–0.75, P = 0.010) was inversely associated with the all-cause death and cardiac death, while RWTPW (HR:0.55, 95%CI:0.36–0.84, P = 0.006) and RWTIVS+PW (HR:0.61, 95%CI:0.41–0.91, P = 0.014) were inversely associated with incidence of MACE (Table 4).
Table 4.
Multivariate Cox regression analysis of the non-anterior infarction group
| RWTPW (per 0.1 increased) | RWTIVS+PW (per 0.1 increased) | RWTIVS (per 0.1 increased) | |||||||
|---|---|---|---|---|---|---|---|---|---|
| HR | 95%CI | P Value | HR | 95%CI | P Value | HR | 95%CI | P Value | |
| All cause death | |||||||||
| Unadjusted | 0.29 | 0.13–0.65 | 0.002 | 0.34 | 0.16–0.71 | 0.004 | 0.47 | 0.26–0.86 | 0.015 |
| Adjusted with Model1 | 0.35 | 0.16–0.76 | 0.009 | 0.41 | 0.20–0.83 | 0.014 | 0.53 | 0.30–0.93 | 0.034 |
| Adjusted with Model2 | 0.45 | 0.21–0.97 | 0.042 | 0.56 | 0.27–1.15 | 0.120 | 0.71 | 0.39–1.28 | 0.250 |
| Cardiac death | |||||||||
| Unadjusted | 0.26 | 0.11–0.62 | 0.003 | 0.30 | 0.13–0.69 | 0.004 | 0.44 | 0.23–0.85 | 0.014 |
| Adjusted with Model1 | 0.27 | 0.11–0.67 | 0.004 | 0.32 | 0.14–0.73 | 0.007 | 0.48 | 0.25–0.93 | 0.028 |
| Adjusted with Model2 | 0.30 | 0.12–0.75 | 0.010 | 0.44 | 0.19–1.02 | 0.054 | 0.54 | 0.19–1.02 | 0.054 |
| MACE | |||||||||
| Unadjusted | 0.50 | 0.32–0.78 | 0.003 | 0.56 | 0.37–0.84 | 0.005 | 0.68 | 0.48–0.96 | 0.027 |
| Adjusted with Model1 | 0.52 | 0.34–0.81 | 0.003 | 0.58 | 0.39–0.86 | 0.007 | 0.69 | 0.49–0.96 | 0.029 |
| Adjusted with Model2 | 0.55 | 0.36–0.84 | 0.006 | 0.61 | 0.41–0.91 | 0.014 | 0.72 | 0.51–1.01 | 0.052 |
Model 1: sex, age, hypertension, diabetes, smoking, prior stroke, hyperlipidemia
Model 2: sex, age, hypertension, diabetes, smoking, prior stroke, hyperlipidemia, creatinine, left ventricular ejection fraction (LVEF), shock index, Killips classification, multivessel lesion
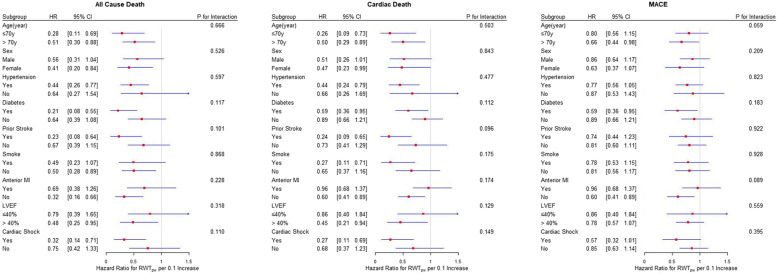
The interaction analysis of RWTPW was analysed by age, gender, hypertension, diabetes, stroke history, smoking, anterior myocardial infraction, LVEF and cardiogenic shock. The endpoint events were all cause death, cardiac death and MACE in 60 months. Consequently, there were no interaction of RWTPW with the above variates (Fig. 6).
Fig. 6.
Subgroups analysis of all cause death, cardiac death and MACE for RWTPW
Discussion
The present study shows that RWTPW is an independent and effective predictor of long-term cardiac death and MACE in patients with STEMI after pPCI. The patients with STEMI usually face substantial risks of long-term MACE although the cardiovascular events mainly occur within 1 months after pPCI [5]. Moreover, the occurrence of STEMI has been more prevalent during young people in recent years [2, 14]. Therefore, it is worthy to find the indicators which can predict the prognosis of patients with STEMI.
The rationale for investigating RWT as a prognosis marker is that RWT can reflect ventricular remodeling to a certain degree. When STEMI occurs, the heart does not change homogeneously, but changes according to the myocardium involved by the infarct-related vessels. The Framingham Heart Study firstly assessed the relationship between left ventricular geometry and clinical outcomes and demonstrated that patients with concentric hypertrophy had a poorest prognosis, followed by eccentric hypertrophy, concentric remodeling and normal morphology [15]. Yitschak Biton, et al. had described the relationship between the remodeling morphologies and the risk of ventricular tachyarrhythmia (VA) in patients with mild heart failure and RWT was found to be inversely associated with the risk of VA in patients with eccentric hypertrophy. Li L, et al. showed that RWT was an independent predictor of left ventricular systolic and diastolic dysfunctions in essential hypertension [16].
There are three methods to calculating RWT and the American Society of Echocardiography recommends RWTPW for calculating RWT in clinical practice but several studies have found RWTIVS+PW also had clinical significance [17, 18]. In the current study, we revealed that only RWTPW had predictive value for all-cause death, cardiac death and MACE at 60 months in patients with non-anterior STEMI. None of the three calculations of RWT had the predictive value in the anterior STEMI cohort. This may be attributed to the fact that none of the three methods involved the index of the anterior wall and IVSD is only intraventricular septal thickness, which cannot fully reflect the degree of myocardial remodeling after anterior myocardial infarction. Survival analysis demonstrated that patients with lower RWTPW or RWTIVS+PW had significantly higher incidence of the all-cause death, cardiac death and MACE at 60 months as compared to those with higher RWTPW or RWTIVS+PW. However, no significance was observed at 30 days and 12 months. This indicates that RWT has predictive value for long-term rather than short-term outcomes. Structural changes such as ventricular remodeling after myocardial infarction usually lasts for a long period and the adverse events accumulate as the time goes by. This could probably explain why RWT is a long-term independent predictor rather than short-term predictor.
The magnitude of RWT might mirror the extent of LV fibrosis and remodeling. The lower RWT is related to the thinner LV wall, the larger cardiac cavity, and the more severe necrosis of the involved myocardium. Cardiac remodeling can induce fibrosis, scar formation and subsequently lead to apoptosis of healthy cardiomyocytes, increased cardiac stiffness, decreased cardiac function and increased incidence of malignant arrhythmia [19]. Thus, the long-term clinical prognosis of patients with lower RWT value could be much worse.
Limitations
The present study had several limitations. (1) The sample size was a bit small and the results may be biased to some degree. (2) It was an observational study, which had the intrinsic shortcomings. The biases were unable to be avoided completely despite of the adjustment of confounding factors using regression models. (3) There were many factors affecting the prognosis of STEMI patients, which need to be comprehensively evaluated.
Conclusion
RWTPW, RWTIVS+PW and RWTIVS had no predictive value for the long-term clinical outcomes of patients with anterior myocardial infarction. On the contrary, RWTPW had predictive value for long-term all cause death, cardiac death and MACE in patients with non-anterior myocardial infarction, which suggested that RWTPW, rather than RWTIVS+PW or RWTIVS, was a reliable independent predictor.
Acknowledgements
Not applicable.
Disclosure
All authors have and declare that: (i) no support, financial or otherwise, has been received from any organization that may have an interest in the submitted work; and (ii) there are no other relationships or activities that could appear to have influenced the submitted work.
Authors’ contributions
Ying Zhang collected the data, made the follow-up and wrote the paper. Shuaihua Qiao and Han Hao collected data and wrote the paper. Qiaoling Li and Guannan Li made the charts. Kun Wang and Rong Gu revised it critically for intellectual content. Xue Bao and Lina Kang revised the analysis resultes of the data. Han Wu designed the study and made the follow-up. Zhonghai Wei put forward research ideas, designed the study and revised the paper.
Funding
This study was supported by the following funding:
1. Key Project Supported by Medical Science and Technology Development Foundation, Nanjing Department of Health (No. YKK19063) hosted by Zhonghai Wei
2. The National Natural Science Foundation of China (No. 81700392) hosted by Zhonghai Wei
3. Key Project Supported by Medical Science and Technology Development Foundation, Nanjing Department of Health (No. ZKX20018) hosted by Lina Kang
4. The National Natural Science Foundation of China (No.81900330), hosted by Qiaoling Li
5. The National Natural Science Foundation of China (No.81870291), hosted by Rong Gu
6. The National Natural Science Foundation of China (No. 81600285 and No. 81970296) hosted by Han Wu
7. Funded by Jiangsu Provincial Key Research and Development (BE2022665) hosted by Zhonghai Wei.
Availability of data and materials
The datasets used and analysed during the current study available from the corresponding author on reasonable request.
Declarations
Ethics approval and consent to participate
The study has been approved by the Medical Ethics Committee of Nanjing Drum Tower Hospital, Medical School of Nanjing University (2019–190-01). Along with this the relevant data were published with the verbal consent by the participants and has been approved by the ethics committee of Nanjing Drum Tower Hospital, Medical School of Nanjing University (2019–190-01). All methods were carried out in accordance with the ethical guidelines of the 1975 Declaration of Helsinki. Verbal Informed consent was taken by all the participants. Because the study was a observational study, which did not affect the intervention treatment of patients and did not harm the interests of patients.
Consent for publication
Not applicable.
Competing interests
The authors declare no competing interests.
Footnotes
Publisher’s Note
Springer Nature remains neutral with regard to jurisdictional claims in published maps and institutional affiliations.
Ying Zhang, Shuaihua Qiao and Han Hao contributed equally to this work.
Contributor Information
Lina Kang, Email: kanglina@njglyy.com.
Han Wu, Email: njumed@163.com.
Zhonghai Wei, Email: weizhonghai@njglyy.com.
References
- 1.Hu SS, et al. The writing committee of the report on cardiovascular health diseases in China. Chin Circ J. 2020;35(09):833–54.
- 2.Johansson S, Rosengren A, Young K, Jennings E. Mortality and morbidity trends after the first year in survivors of acute myocardial infarction: a systematic review. BMC Cardiovasc Disor. 2017;17:1–8. doi: 10.1186/s12872-017-0482-9. [DOI] [PMC free article] [PubMed] [Google Scholar]
- 3.Ibanez B, James S, Agewall S, Antunes MJ, Bucciarelli-Ducci C, Bueno H, Caforio ALP, Crea F, Goudevenos JA, Halvorsen S, et al. 2017 ESC Guidelines for the management of acute myocardial infarction in patients presenting with ST-segment elevation The Task Force for the management of acute myocardial infarction in patients presenting with ST-segment elevation of the European Society of Cardiology (ESC) Eur Heart J. 2018;39(2):119–177. doi: 10.1093/eurheartj/ehx393. [DOI] [PubMed] [Google Scholar]
- 4.Cohn JN, Ferrari R, Sharpe N, Remodeling IFC. Cardiac remodeling-concepts and clinical implications: a consensus paper from an international forum on cardiac remodeling. J Am Coll Cardiol. 2000;35(3):569–582. doi: 10.1016/S0735-1097(99)00630-0. [DOI] [PubMed] [Google Scholar]
- 5.Chew DS, Heikki H, Schmidt G, Kavanagh KM, Dommasch M, Thomsen PEB, Sinnecker D, Raatikainen P, Exner DV. Change in left ventricular ejection fraction following first myocardial infarction and outcome. JACC Clin Electrophy. 2018;4(5):672–682. doi: 10.1016/j.jacep.2017.12.015. [DOI] [PubMed] [Google Scholar]
- 6.Shindo K, Fukuda H, Hitsumoto T, Ito S, Kim J, Washio T, Kitakaze M. Plasma BNP levels and diuretics use as predictors of cardiovascular events in patients with myocardial infarction and impaired glucose tolerance. Cardiovasc Drug Ther. 2020;34(1):79–88. doi: 10.1007/s10557-019-06922-9. [DOI] [PubMed] [Google Scholar]
- 7.de Chickera SN, Bota SE, Kuwornu JP, Wijeysundera HC, Molnar AO, Lam NN, Silver SA, Clark EG, Sood MM. Albuminuria, reduced kidney function, and the risk of ST- and non-ST-segment-elevation myocardial infarction. J Am Heart Assoc. 2018;7(20):e009995. doi: 10.1161/JAHA.118.009995. [DOI] [PMC free article] [PubMed] [Google Scholar]
- 8.Reinstadler SJ, Feistritzer HJ, Klug G, Mair J, Tu AMD, Kofler M, Henninger B, Franz WM, Metzler B. High-sensitivity troponin T for prediction of left ventricular function and infarct size one year following ST-elevation myocardial infarction. Int J Cardiol. 2016;202:188–193. doi: 10.1016/j.ijcard.2015.09.001. [DOI] [PubMed] [Google Scholar]
- 9.Yamaguchi S, Shimabukuro M, Abe M, Arakaki T, Arasaki O, Ueda S. Comparison of the prognostic values of three calculation methods for echocardiographic relative wall thickness in acute decompensated heart failure. Cardiovasc Ultrasound. 2019;17(1):30. doi: 10.1186/s12947-019-0179-6. [DOI] [PMC free article] [PubMed] [Google Scholar]
- 10.Biton Y, Goldenberg I, Kutyifa V, Baman JR, Solomon S, Moss AJ, Szepietowska B, McNitt S, Polonsky B, Zareba W, et al. relative wall thickness and the risk for ventricular tachyarrhythmias in patients with left ventricular dysfunction. J Am Coll Cardiol. 2016;67(3):303–312. doi: 10.1016/j.jacc.2015.10.076. [DOI] [PubMed] [Google Scholar]
- 11.O'Gara PT, Kushner FG, Ascheim DD, Casey DE, Jr, Chung MK, de Lemos JA, Ettinger SM, Fang JC, Fesmire FM, Franklin BA, et al. 2013 ACCF/AHA guideline for the management of ST-elevation myocardial infarction: executive summary: a report of the American College of Cardiology Foundation/American Heart Association Task Force on Practice Guidelines: developed in collaboration with the American College of Emergency Physicians and Society for Cardiovascular Angiography and Interventions. Catheter Cardiovasc Interv. 2013;82(1):E1–27. doi: 10.1002/ccd.24776. [DOI] [PubMed] [Google Scholar]
- 12.Qiao S, Zhang J, Kong Z, Wu H, Gu R, Zheng H, Xu B, Wei Z. Comparison of the prognosis for different onset stage of cardiogenic shock secondary to ST-segment elevation myocardial infarction. BMC Cardiovasc Disord. 2020;20(1):302. doi: 10.1186/s12872-020-01583-1. [DOI] [PMC free article] [PubMed] [Google Scholar]
- 13.Thygesen K, Alpert JS, Jaffe AS, Simoons ML, Chaitman BR, White HD, Katus HA, Apple FS, Lindahl B, Morrow DA, et al. Third universal definition of myocardial infarction. Circulation. 2012;126(16):2020-+. doi: 10.1161/CIR.0b013e31826e1058. [DOI] [PubMed] [Google Scholar]
- 14.Pedersen F, Butrymovich V, Kelbaek H, Wachtell K, Helqvist S, Kastrup J, Holmvang L, Clemmensen P, Engstrom T, Grande P, et al. Short- and long-term cause of death in patients treated with primary PCI for STEMI. J Am Coll Cardiol. 2014;64(20):2101–2108. doi: 10.1016/j.jacc.2014.08.037. [DOI] [PubMed] [Google Scholar]
- 15.Krumholz HM, Larson M, Levy D. Prognosis of left-ventricular geometric patterns in the Framingham heart-study. J Am Coll Cardiol. 1995;25(4):879–884. doi: 10.1016/0735-1097(94)00473-4. [DOI] [PubMed] [Google Scholar]
- 16.Li LQ, Shigematsu Y, Hamada M, Hiwada K. Relative wall thickness is an independent predictor of left ventricular systolic and diastolic dysfunctions in essential hypertension. Hypertens Res. 2001;24(5):493–499. doi: 10.1291/hypres.24.493. [DOI] [PubMed] [Google Scholar]
- 17.Wang SX, Song KX, Guo XY, Xue H, Wang N, Chen JZ, Zou YB, Sun K, Wang H, He JG, et al. The association of metabolic syndrome with left ventricular mass and geometry in community-based hypertensive patients among Han Chinese. J Res Med Sci. 2015;20(10):963–968. doi: 10.4103/1735-1995.172785. [DOI] [PMC free article] [PubMed] [Google Scholar]
- 18.Chahal NS, Lim TK, Jain P, Chambers JC, Kooner JS, Senior R. New insights into the relationship of left ventricular geometry and left ventricular mass with cardiac function: a population study of hypertensive subjects. Eur Heart J. 2010;31(5):588–594. doi: 10.1093/eurheartj/ehp490. [DOI] [PubMed] [Google Scholar]
- 19.Yang SL. Pathophysiological mechanism of acute coronary syndrome. Chin J Hemorheol. 2003;01:88–92. [Google Scholar]
Associated Data
This section collects any data citations, data availability statements, or supplementary materials included in this article.
Data Availability Statement
The datasets used and analysed during the current study available from the corresponding author on reasonable request.


