

ABSTRACT
Despite growing evidence that has declared the importance of circRNAs in neurodegenerative diseases, the clinical significance of circRNAs in dopaminergic (DA) neuronal degeneration in the pathogenesis of Parkinson disease (PD) remains unclear. Here, we performed rRNA-depleted RNA sequencing and detected more than 10,000 circRNAs in the plasma samples of PD patients. In consideration of ROC and the correlation between Hohen-Yahr stage (H-Y stage) and Unified Parkinson Disease Rating Scale-motor score (UPDRS) of 40 PD patients, circEPS15 was selected for further research. Low expression of circEPS15 was found in PD patients and there was a negative positive correlation between the circEPS15 level and severity of PD motor symptoms, while overexpression of circEPS15 protected DA neurons against neurotoxin-induced PD-like neurodegeneration in vitro and in vivo. Mechanistically, circEPS15 acted as a MIR24-3p sponge to promote the stable expression of target gene PINK1, thus enhancing PINK1-PRKN-dependent mitophagy to eliminate damaged mitochondria and maintain mitochondrial homeostasis. Thus, circEPS15 rescued DA neuronal degeneration through the MIR24-3p-PINK1 axis-mediated improvement of mitochondrial function. This study reveals that circEPS15 exerts a critical role in participating in PD pathogenesis, and may give us an insight into the novel avenue to develop potential biomarkers and therapeutic targets for PD.
Abbreviations: AAV: adeno-associated virus; DA: dopaminergic; FISH: fluorescence in situ hybridizations; HPLC: high-performance liquid chromatography; H-Y stage: Hohen-Yahr stage; LDH: lactate dehydrogenase; MMP: mitochondrial membrane potential; MPTP/p: 1-methyl-4-phenyl-1,2,3,6-tetrahydropyridine/probenecid; NC: negative control; PD: Parkinson disease; PINK1: PTEN induced kinase 1; PBS: phosphate-buffered saline; ROS: reactive oxygen species; SNpc: substantia nigra pars compacta; TEM: transmission electron microscopy; UPDRS: Unified Parkinson’s Disease Rating Scale-motor score
KEYWORDS: CircEPS15, MIR24-3p, mitophagy, Parkinson disease, PINK1
Introduction
Parkinson disease (PD) is a common progressive neurodegenerative disease characterized by selective loss of dopaminergic (DA) neurons and intracellular accumulation of Lewy bodies in the SNpc. Clinically, PD patients manifest motor symptoms including bradykinesia, rigidity, resting tremor, and disordered gait, which appear when more than 50% of DA neurons are lost [1]. At present, dopamine replacement therapies for PD only improve the motor symptoms for specific populations but are useless to prevent progressive neurodegeneration of DA neurons. Exploring new biomarkers and therapeutic targets in the early stage of PD is essential for the development of PD diagnosis and treatment.
Although differential expression of circRNAs in PD patients has been reported, the findings are diversified and the exact role needs to be further elucidated [2,3]. It was shown that a number of circRNAs including 129 upregulated and 282 downregulated circRNAs were significantly expressed between PD patients and normal controls in peripheral blood samples by RNA sequencing [4]. Therefore, circRNAs in peripheral blood were potentially recognized as biomarkers for PD [5]. CircRNAs with markedly higher expression in aging brains were enriched with neural signaling and pathogenic processes [6]. Some analysis of the expression profile of circRNA showed that there are differences in the expression of circular RNA in different brain regions in the PD model [7]. The circSNCA-MIR7-SNCA axis has been considered as a potential ceRNET (competing endogenous RNAs network) in PD [8]. CircSLC8A1 was performed to control neuronal excitability and motor behavior through binding for MIR128, which is an abundant and brain-restricted miRNA [9]. Of course, some research also reported that circDLGAP4 and circzip-2 have protective effects in the pathological process of PD [10,11].
However, the pathogenesis of PD had not yet been clarified, and the theory of mitochondrial dysfunction was widely regarded as one of the most important pathogenesis. Mutations in certain genes such as PRKN [12], SNCA/α-synuclein [13], PARK7 [14], PINK1, and HTRA2 may cause mitochondrial dysfunction and play a pivotal role in the process of PD [15]. These pathogenic mutations support the idea that mitochondrial dysfunction is implicated in neurodegenerative diseases [16]. PINK1 is a serine/threonine kinase that leads to autosomal recessive early-onset PD [17]. Studies have shown that overexpression of PINK1 has neuroprotective effects against apoptosis induced by mitochondrial toxins while depletion induces mitochondrial dysfunction and makes dopaminergic cells more vulnerable to oxidative stress [18]. PRKN, an E3 ubiquitin ligase, clears damaged mitochondria by ubiquitinating multiple mitochondrial proteins selectively [19]. When the mitochondria are damaged, PINK1 phosphorylates PRKN at Ser65, which activates PRKN and recruits its translocation from the cytosol to dysfunctional mitochondria [20]. Increasing research shows that PINK1-PRKN signaling is strongly associated with mitochondrial function [21]. Therefore, targeting circRNA to promote mitophagy and maintain the steady state of mitochondrial function to delay the pathological process of PD is potential and attractive for the development of PD therapies.
In this study, we performed RNA sequencing of plasma from PD patients and the corresponding healthy adults and identified abnormally downregulated expression of circEPS15 in PD patients. Most importantly, the low expression of circEPS15 was strongly associated with the H-Y stage and UPDRS-III of PD patients. We further found that circEPS15 could act as a MIR24-3p sponge and prevent it from decreasing the level of PINK1, which improved damaged mitochondrial function and consequently alleviated DA neuron degeneration in vitro and in vivo. In brief, these findings highlight the scientific significance and clinical value of circRNA in the pathogenesis of PD, which may give us an insight into the novel avenue to develop potential biomarkers and therapeutic targets for PD.
Results
CircEPS15 is downregulated in PD patients and the mouse model
To investigate the role of circRNAs in PD, we performed rRNA-depleted RNA sequencing and detected more than 10,000 circRNAs in 4 pairs of PD patients and matched normal controls. After excluding extremely low abundance and screening for the fold change of their differential expression, the top 30 upregulated and 30 downregulated circRNAs were selected for further research (Figure 1A). Pathway enrichment analysis showed that circRNAs were highly correlated with cell adhesion molecules, thyroid hormone signaling pathway, and phagosome (P < 0.05) (Figure 1B). Among these pathways, circRNAs that enriched in phagosome had the largest proportion. By screening circRNAs that were coded by exons, the lengths ranging from 200 to 2000 bp, and a high abundance of expression, we further focused on 11 candidate circRNAs. Then we successfully validated that 6 of 11 circRNAs were significantly changed (P < 0.01) in the plasma of PD patients (N = 40) compared with those in normal control (Figure 1C). And the details of all enrolled patients and normal controls were performed in Table S1. Next, we analyzed the correlation between these 6 circRNAs and PD motor symptoms (Figure 1D,E and Figure S1A-O). ROC curve showed that the expression level of circEPS15 was significantly correlated with the H-Y stage and UPDRS score (AUC = 0.9612, P < 0.0001; UPDRS score: R2 = 0.1932, P = 0.0004; H-Y stage: R2 = 0.1359, P = 0.0038). H-Y stage and UPDRS score were two kinds of Parkinson disease rating scales widely used in the world. The higher the grade, the more severe symptoms were performed in PD patients [22,23]. PD patients in the H-Y II stage exhibited low expression levels of circEPS15. Besides, there was a negative correlation between the expression of circEPS15 and the UPDRS score (Figure 1E). Consistently, the expression of circEPS15 declined in both midbrain and plasma samples of MPTP-induced chronic and subacute mice models of PD (Figure 1F). For the replication cohort, the copy numbers per microliter of plasma were calculated. We also detected the absolute copy number of per microgram RNA in the SH-SY5Y cell. CircEPS15 showed significantly decreased expression levels in PD patients and mice models compared with controls (Figure S1P-R).
Figure 1.
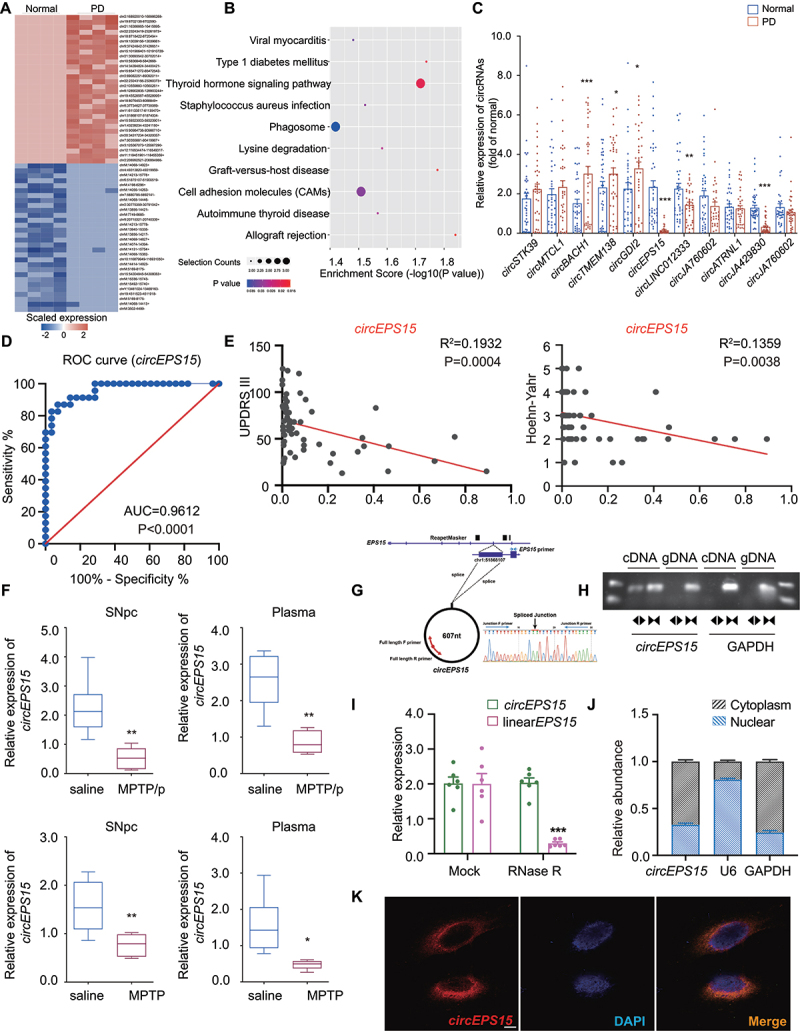
CircEPS15 was downregulated in plasma of PD patients and low circEPS15 was associated with H-Y staging and UPDRS score of PD patients. (A) Heat map representing distinct circRNA expression values in PD patients compared with normal controls. Red scale: higher expression. Blue scale: lower expression. n = 4 samples/group. Statistical significance was evaluated by using ANOVA. (B) Pathway enrichment of circRNA expression. (C) Eleven circRnas expression levels in the plasma of PD patients (40 individuals/group) compared with those in normal controls (40 individuals/group). (D) ROC curve and (E) correlation analysis (UPDRS and Hoehn-Yahr) for individual circEPS15 to separate PD patients from normal controls. (F) Relative circEPS15 levels in midbrain and plasma in chronic and subacute MPTP model, n = 6 male mice/group. (G) the schematic illustration showed the circularization of EPS15 exons 15–18 to form circEPS15. The back-splicing junction of circEPS15 was verified by RT-PCR and Sanger sequencing. (H) CircEPS15 expression in SH-SY5Y cells was detected by RT-PCR. Agarose gel electrophoresis showed that divergent primers amplified circEPS15 in cDNA but not genomic DNA (gDNA). (I) Relative expression levels of circEPS15 and linear EPS15 after treatment with RNase R. n = 6/group. (J) CircEPS15 abundance in nuclear and cytoplasmic fractions of SH-SY5Y cells was evaluated by qPCR. GAPDH acted as a positive control of RNA distributed in the cytoplasm, and U6 RNA acted as a positive control of RNA distributed in the nucleus. n = 6/group. (K) Localization of circEPS15 in SH-SY5Y cells was detected by FISH. Nuclei were stained with DAPI and circEPS15 probes were labeled with Cy3 (red). Scale bar: 10 μm. Statistically significant by Student t-test; *P < 0.05; **P < 0.01; ***P < 0.001.
By searching the database (circBase, http://www.circbase.org/), we found that circEPS15 was spliced from exons of EPS15 gene on chromosome 1, resulting from back-splicing of exons 15, 16, 17, and 18 (607 bp). Sanger sequencing confirmed head-to-tail splicing in the RT-PCR product of circEPS15 (Figure 1G). To validate the existence of circEPS15, junction primers were designed (Table S2) to amplify the circEPS15 expression in cDNA and gDNA of SH-SY5Y cells by PCR. Nucleic acid electrophoresis showed that circEPS15 is circular rather than linear (Figure 1H). Furthermore, the stability of circEPS15 was confirmed with RNase-R treatment, showing that circEPS15 had a longer half-life than that of the linear EPS15 mRNA (Figure 1I). These data demonstrated that circEPS15 has essential features of circRNAs. In addition, we investigated the intracellular distribution of circEPS15. The results of RT-PCR (Figure 1J) and FISH (Figure 1K) showed that circEPS15 was predominantly distributed in the cytoplasm. Collectively, these findings indicate that decline of circEPS15 is closely related to the progression of PD.
Overexpression of CircEPS15 protects against DA neuronal damage through accelerating mitophagy in the MPP+ model
To investigate the biological functions of circEPS15 in PD, we analyzed the expression of circEPS15 in primary cultures (neuron, astrocyte, microglia) and corresponding cell lines (SH-SY5Y, C8, and BV2 cells) by RT-PCR. The results showed that the expression of circEPS15 was significantly higher in primary neurons and SH-SY5Y cells than in other cells (Figure S2A). Meanwhile, it was found that the expression of circEPS15 was notably reduced by MPP+ stimulation in neurons and SH-SY5Y cells (Figure 2A). So, primary neurons were overexpressed with circEPS15 and then we explored the effect of circEPS15 on MPP+-induced neuronal damage (Figure S2B). TH is a specific marker of DA neurons, and the typical pathological feature of Parkinson disease is the irreversible progressive loss of DA neurons in the SNpc. Therefore, the TH staining represented DA neuron damage. 3D Morphological analysis displayed that the branch number, axon length, and soma volume of TH neurons were remarkably decreased by MPP+ exposure, and this reduction can be reversed by overexpression of circEPS15 (Figure 2B–G). In addition, MAP2 immunofluorescence demonstrated that overexpression of circEPS15 ameliorated MPP+-induced shortened protrusions and bead-like changes of primary neurons (Figure 2H), while Hoechst staining showed overexpression of circEPS15 ameliorated apoptosis of primary neurons induced by MPP+ (Figure 2I, red arrow). In the MPP+-treated groups, overexpression of circEPS15 significantly increased cell viability and reduced LDH release of primary neurons (Figure 2J,K). These data indicate that overexpression of circEPS15 protects DA neurons against neurotoxin MPP+ challenge.
Figure 2.
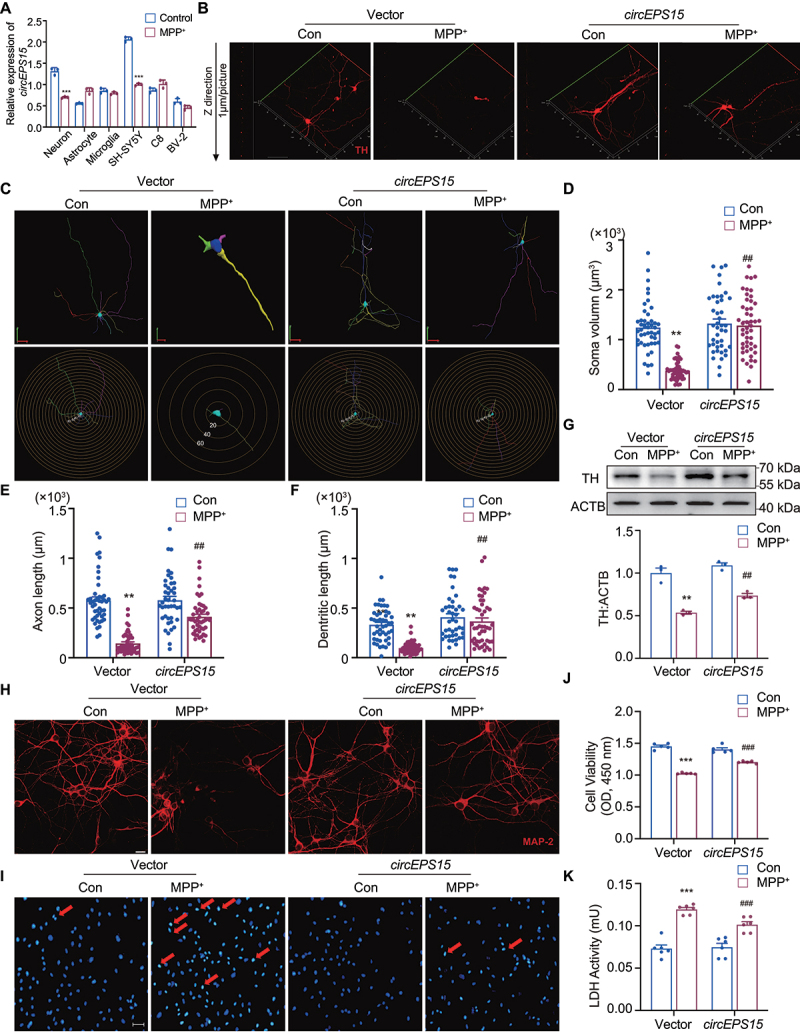
Overexpression of CircEPS15 promoted dopaminergic neuron recovery in vitro. (A) Relative mRNA expression of circEPS15 in various types of cells (primary neuron, astrocytes microglia, SH-SY5Y, C8 and BV2) after treatment with MPP+. Primary neuron: MPP+ 30 μM. Other cells: MPP+ 500 μM. n = 3/group. Cells were transduced with Vector/circEPS15-GFP lentivirus. Vector: empty control lentivirus corresponding to overexpression lentivirus. Representative images of neuron immunostaining for TH (B) and MAP2 (H) in the midbrain, followed by 3D reconstruction and Sholl analysis (C). Scale bar: 20 μm. Average soma size (D), axon length (E), and total dentritic length (F). All data were presented as mean ± SEM. n = 50 cells/group. (Average soma size, circEPS15: F (1,76) = 13.6, P < 0.001; MPP+: F (1, 76) = 9.139, P < 0.001; interaction: F (1, 76) = 8.426, P < 0.001. Axon length, circEPS15: F (1,71) = 31.15, P < 0.01; MPP+: F (1, 71) = 5.270, P = 0.0247; interaction: F (1, 71) = 4.892, P = 0.0302. Dentritic length, circEPS15: F (1, 73) = 15.44, P < 0.01; MPP+: F (1, 73) = 22.40, P < 0.01; interaction: F (1, 73) = 0.3187, P = 0.5741. (G) Expression of TH in Vector vs circEPS15 after treated with MPP+ in neurons. n = 3/group. (I) Representative image of DNA damage of Vector vs circEPS15 after treatment with MPP+. Arrow: apoptosis cells. Scale bar: 100 μm. Relative cell viability (J) and LDH release (K) of Vector vs circEPS15 after treatment with MPP+. n = 5–6/group. (A) ***P < 0.001 vs Control using Student’s t-test. (D-G, J-K) Data were presented as mean ± S.E.M. Two-way ANOVA with Dunnett’s multiple comparisons test. ***P < 0.001 vs Vector-con group; ##P < 0.01, ###P < 0.001 vs Vector-MPP+ group.
Next, SH-SY5Y cells were used to explore the potential mechanism involved in circEPS15-mediated neuroprotection. It was found that overexpression of circEPS15 exerted an anti-apoptotic effect on the MPP+ cell model (Figure 3A–C, Figure S2C, D). As mitochondrial dysfunction is primarily implicated in the pathogenesis of PD [24], the ultrastructure of mitochondria in SH-SY5Y cells was observed by transmission electron microscopy (TEM). We found that in the control group the boundary of every sub-cellular was clear and the double-membrane structure of mitochondria was integrated. The inner membrane was folded toward the center to form many normal mitochondrial cristae including lamellar, tubular and vesicular cristae. Besides, the autophagosome was also observed in normal control. However, MPP+ treatment led to the accumulation of damaged mitochondria harboring morphologies including the enlarged size, the disappeared double-membrane structure, and mitochondrial cristae, and the blurred edges (Figure 3D upper panel). Strikingly, overexpression of circEPS15 triggered autophagosome formation, which enclosed damaged mitochondria for degradation in lysosome (Figure 3D lower panel). These results implied a regulatory effect of circEPS15 on the clearance of damaged mitochondria (Figure 3E). Since inoperative mitophagy will cause dysfunctional mitochondria accumulation and ROS generation [25], it is essential to determine whether circEPS15 could impact mitophagy or not. The JC-1 assay demonstrated that mitochondrial membrane potential (MMP) of SH-SY5Y cells was decreased sharply after MPP+ treatment, while overexpression of circEPS15 inhibited the diminished MMP (Figure 3F, H and Figure S2E, F, K). In addition, ROS production was measured by flow cytometry and immunofluorescence staining shown in Figures 3G,I and Figure S2G-J. The ROS production in the Vector-MPP+ group was up to 21.3% but it was reduced to 7.36% in the overexpression of circEPS15 (OE)-MPP+ group. Proteins related to apoptosis, mitophagy and mitochondrial function were then examined by western blotting (Figure 3J). Besides, total ubiquitination levels in the mitochondria were markedly elevated in the overexpression of circEPS15 cells. Overexpression of circEPS15 alleviated MPP+-induced apoptosis reflected by upregulation of BCL2, and downregulation of BAX and cleaved CASP9. Meanwhile, autophagic flux was enhanced by overexpression of circEPS15 showing the increased expression of LC3 and decreased SQSTM1/p62 level. Mitochondrial function was also improved in the OE-MPP+ group with reduced levels of AIFM1/AIF and CYCS/cyt C and increased TOMM20 expression. Taken together, our data suggest that circEPS15 protects against MPP+-induced neuronal damage through accelerating mitophagy to maintain mitochondrial function.
Figure 3.
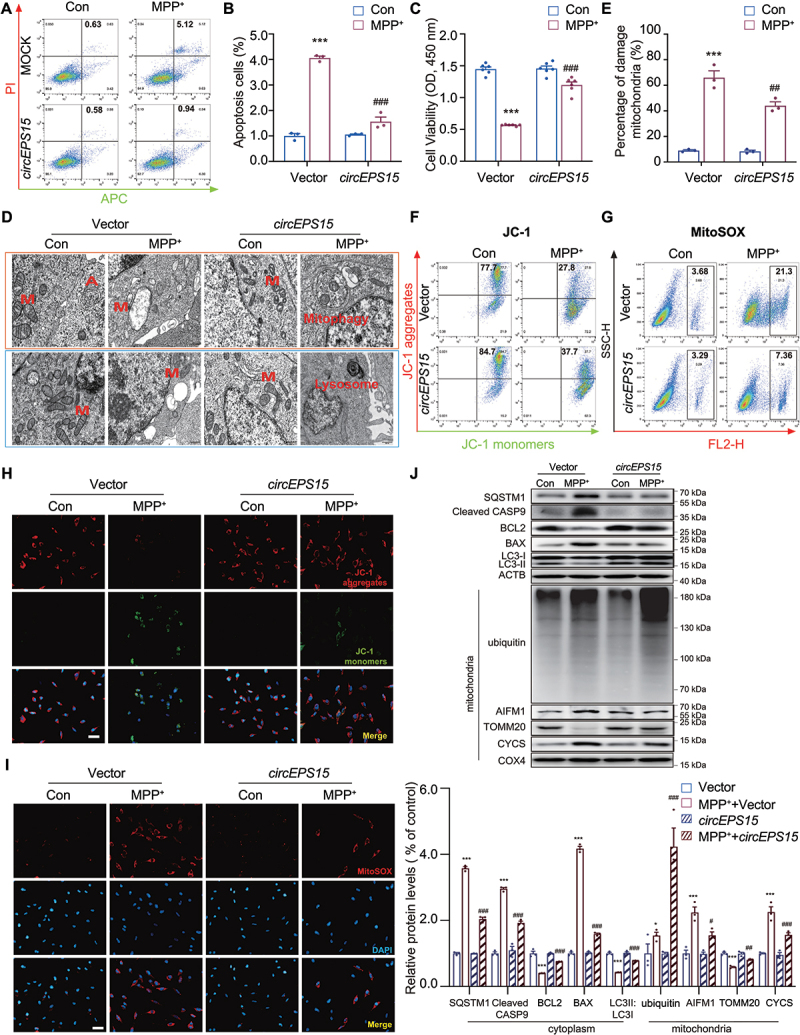
Overexpression of CircEPS15 promoted mitophagy in SH-SY5Y cells. (A) SH-SY5Y cells were stably transfected with circEPS15-GFP lentivirus. Cells were stained with Annexin V-APC and PI, and the percentage of apoptotic cells was detected by flow cytometry. (B) Data are presented as the mean ± S.E.M of three independent experiments. (C) Relative cell viability of Vector vs circEPS15 was detected after treatment with MPP+ in SH-SY5Y cells. n = 6/group. (D) Representative TEM images of mitochondrial mitophagosomes and lysosomes (M: mitochondrial, A: autophagosome). Scale bar: upper panel: 500 nm; lower panel: 1 μm. (E) Percentage analysis of damage mitochondrial. Cells were stained with JC-1(F, H) and MitoSOX (G, I), the percentage of cells which changed mitochondrial membrane potential and mitochondrial ROS were detected by flow cytometry. Scale bar: 50 μm. (J) Expression and quantitation of BCL2, BAX, cleaved CASP 9, SQSTM1, AIFM1, CYCS, TOMM20, COX4 and ubiquitin in Vector vs circEPS15 after being treated with MPP+ were detected. n = 3/group. (B and C) Data were presented as mean ± S.E.M. Two-way ANOVA with Dunnett’s multiple comparisons test. ***P < 0.001 vs Vector-con group; ##P < 0.01, ###P < 0.001 vs Vector-MPP+ group.
PINK1 is required for CircEPS15-induced mitophagy
To further explore the regulatory role of circEPS15 in mitophagy, transcriptomics was performed to analyze the differentially expressed transcripts in response to circEPS15 overexpression between the OE-MPP+ group and Vector-MPP+ group (Figure 4A,B). Through pathway enrichment analysis, we found that pathways of both autophagy and mitophagy responded significantly in the OE-MPP+ group (Figure 4C). As Kalia and Blauwendraat described [1,26], we picked 11 genes closely related to PD. Two of the 11 genes (PLA2G6/PARK14 and PINK1) were significantly upregulated in circEPS15 overexpression stimulated with MPP+ (Figure 4D). Mutations in PLA2G6 cause neurodegenerative disorders in humans, including autosomal recessive neuroaxonal dystrophy and early-onset parkinsonism [27–30]. It was found that knockdown of PLA2G6 could not rescue the apoptosis and mitochondrial dysfunction on the MPP+ cell model while circEPS15 overexpression (Fig. S3A-H). Therefore, PINK1 was selected as the candidate for further study due to the obvious change and its essential role in maintaining mitochondrial function (Figure 4B,D). During mitochondrial membrane depolarization, cytosolic PRKN is recruited to interact with PINK1 which triggers mitophagy for the removal of damaged mitochondria [31,32]. In our study, MPP+ stimulation led to the decreased expression of PRKN in cytoplasm and overexpression of circEPS15 could accelerate the change. Interestingly, as shown in Figure 4E,G, we found that the colocalization of PINK1 and COX4/COXIV increased in Vector-MPP+ group which was consistent with previous reports [33,34]. It can be observed the fewer colocalization in the circEPS15 OE-MPP+ group. We speculated that MPP+ may inhibit the autophagic flux leading to decreased clearance of damaged mitochondria. However, overexpression of circEPS15 enhanced autophagic flux to promote the clearance of dysfunctional mitochondria in the OE-MPP+-treated SH-SY5Y cells (Figure 4F,H). This circEPS15-accelerated mitophagy was further validated by Western blot analysis (Figure 4I). Next, we conducted the PINK1 knockdown experiment on stably transfected cell lines overexpressing circEPS15 (Figure S3I). Knockdown of PINK1 significantly inhibited cell viability and increased LDH release in the MPP+-treated SH-SY5Y cells (Figure 4J). Intriguingly, overexpression of circEPS15 failed to protect against MPP+-induced mitochondrial dysfunction in the PINK1 knockdown cells (Figure 4K,L). Moreover, the knockdown of PINK1 blocked the beneficial effects of circEPS15 on apoptosis and mitophagy (Figure 4M and Figure S3J-P). Reversely, overexpression of PINK1 in SH-SY5Y cells (Figure S4A) improved mitochondrial function and mitophagy in the MPP+ model (Figure S4B-E). Overall, these results imply that circEPS15-boosted mitophagy is PINK1-dependent.
Figure 4.
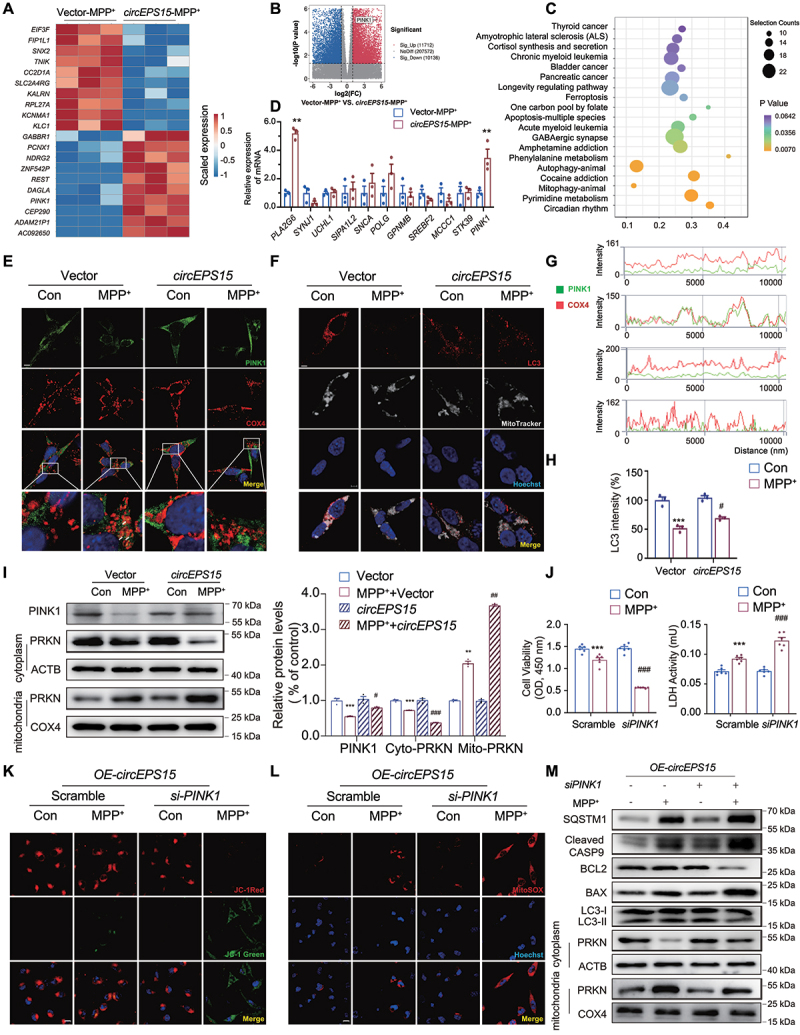
CircEPS15 contributed to the mitophagy of SH-SY5Y cells by regulating the expression of PINK1. Heatmap (A) and volcano map (B) of relative expression (compared with circEPS15 OE-MPP+ group and Vector-MPP+ group) for each transcript was generated. (C) Pathway enrichment analysis (KEGG) for genes expressed preferentially is shown. (D) Differentially expressed genes closely related to PD and mitophagy were selected and validated with RT-PCR. n = 3/group. **P < 0.01 vs Control using ANOVA. (E) Representative images of immunofluorescence double-labeling PINK1 (green), COX4 (red). Scale bar: 10 μm. (F) Representative images of immunofluorescence double-labeling MitoTracker (white) and LC3 (red). Scale bar: 10 μm. (G) the intensity of PINK1 and COX4 after treatment with MPP+. (H) the intensity of LC3 after treatment with MPP+. (I) Expression and quantitation of PINK1 and PRKN in Vector vs circEPS15 after being treated with MPP+ were detected. n = 3/group. Relative cell viability and LDH release (J) of scramble vs siPINK1 after treatment with MPP+. n = 6/group. Scramble: which was almost identical in chemical structure but do not target the target gene (PINK1) in sequence design. Relative images of immunofluorescence staining with JC-1(K) and MitoSOX (L) after PINK1 was knocked down. Scale bar: 50 μm. (M) in circEPS15 overexpressing cells, immunoblot analysis of BCL2, BAX, cleaved CASP9, LC3, SQSTM1, PRKN and COX4 after treatment with MPP+ while PINK1 was knocked down. n = 3/group. Data were presented as mean ± S.E.M. Two-way ANOVA with Dunnett’s multiple comparisons test. ***P < 0.001 vs Vector-con group; ##P < 0.01, ###P < 0.001 vs Vector-MPP+ group.
CircEPS15 functions as a MIR24-3p sponge to upregulate PINK1 in the MPP+ model
Since circRNAs can act as miRNA sponges to regulate gene expression, we then screened potential miRNAs involved in circEPS15-mediated PINK1-dependent mitophagy by using three databases: Circbank (http://www.circbank.cn/help.html), TargetScan (http://www.targetscan.org) and miRbase (http://www.mirbase.org). Five miRNAs, including MIR30, MIR29a-5p, MIR24-3p, MIR138, and MIR145 were identified as potential targets (Figure 5A). Among the 5 candidates, MIR24-3p was significantly increased in the MPP+ model (Figure 5B and Figure S5A). After co-transfecting these miRNAs mimics and circEPS15 luciferase reporters into 293T cells, MIR24-3p mimic remarkably reduced luciferase activity by almost 70% when compared with other miRNAs mimics and negative control (Figure 5C), while this effect was blocked by transfecting mutant circEPS15 sequence (Figure 5D,E). The interaction between circEPS15 and MIR24-3p was further investigated. In the anti-Ago2 immunoprecipitation assay, endogenous circEPS15 but not linear EPS15 were specifically enriched in the Ago2-precipitated fraction (Figure 5F). In addition, we also found that there is colocalization between circEPS15 and MIR24-3p (Figure 5G,H). Combined with dual-luciferase reporter assay and RIP experiments, our results provided evidence that circEPS15 can directly bind to MIR24-3p and functions as a MIR24-3p sponge in SH-SY5Y. In the circEPS15-overexpressed cells, the neuroprotection and enhanced mitophagy were blocked by MIR24-3p mimic (Figure 5I,J and Figure S5B-I). Meanwhile, overexpression of circEPS15 failed to perform an anti-apoptotic effect and maintain mitochondrial function in the presence of MIR24-3p mimic in the MPP+ model (Figure 5K–M and Figure S5J-N). The above results unveil that circEPS15, acting as a MIR24-3p sponge, regulates the downstream events to accelerate mitophagy and provide neuroprotection.
Figure 5.
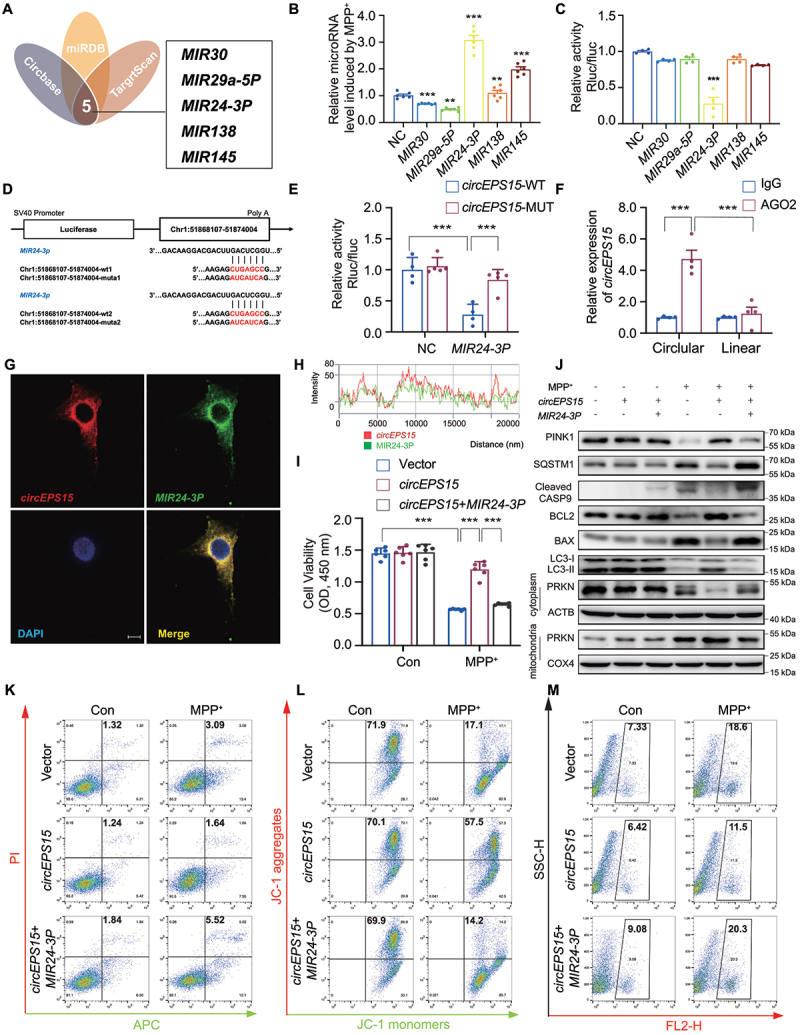
CircEPS15 acted as a sponge for miR-24-3p in SH-SY5Y cells. (A) Combined analysis of bioinformatics prediction to screen 5 for circEPS15-binding miRnas. NC: Negative Control as the control of miRNA. (B) Relative mRNA expression induced by MPP+ was detected after being transfected with these five miRnas (MIR30, Mir29a-5p, MIR24-3p, MIR138 and MIR145). n = 6/group. (C) Relative luciferase activity of wild-type and 3’-UTR mutant constructs of co-transfected with these 5 miRnas and miRNA negative control. (D) the two sites of circEPS15 binding with MIR24-3p wild-type and mutant. (E) HEK293T cells were transfected with wild-type or mutant circEPS15 luciferase reporter vector, and luciferase reporter activity was detected. n = 4–6/group. (F) RIP assays were performed using AGO2 antibody in SH-SY5Y cells, then the enrichment of circEPS15 was detected by qPCR. n = 4–6/group. (G) Colocalization of circEPS15 and MIR24-3p in the cytoplasm of SH-SY5Y cell by FISH analysis. Green, MIR24-3p; Red, circEPS15; Blue, DAPI. Scale bar: 10 μm. (H) the intensity of circEPS15 and MIR24-3p. (I) Cell viability was detected after being transfected with circEPS15 or co-transfected with circEPS15 and MIR24-3p. n = 6/group. (J) Immunoblot analysis of BCL2, BAX, cleaved CASP9, LC3, SQSTM1, PINK1 and PRKN. Cells were stained with Annexin V-APC and PI (K), JC-1(L) and MitoSOX (M), the percentage of apoptotic cells and cells which changed mitochondrial membrane potential and mitochondrial ROS were detected by flow cytometry. n = 3/group. (B, C, I) the data were presented as mean ± S.E.M. ***P < 0.001 using the Student’s t-test. (E, F) the data were presented as mean ± S.E.M. ***P < 0.001 using two-way ANOVA with Dunnett’s multiple comparisons tests.
Anti-MIR24-3p is neuroprotective for experimental models of PD
We further investigated whether PINK1 is the target gene of MIR24-3p. As shown in Figure 6A, PINK1 exhibits a conserved MIR24-3p binding site within its 3′-UTR (254–266) in most species. By using dual-luciferase reporter assays, we confirmed that MIR24-3p mimic significantly inhibited the luciferase activity in the cells transfected with WT 3′-untranslated region of PINK1, but not in those transfected with the mutant 3′-untranslated region of PINK1 (Figure 6B). Administration of MIR24-3p mimic significantly inhibited the expression of PINK1 in SH-SY5Y cells while MIR24-3p inhibitor exerted opposite effects (Figure 6C). These results indicate that PINK1 is a direct target of MIR24-3p. The efficiency of transfection was explained in Figure S6A. As expected, MIR24-3p mimic aggravated MPP+-induced neuronal damage reflected by the increased apoptosis in the MIR24-3p mimic-treated groups compared to that in the NC groups (Figure 6D–G and Figure S6B). While MIR24-3p inhibitor provided a neuroprotective effect in SH-SY5Y cells (Figure S6C-G). Furthermore, the results showed that MIR24-3p inhibitor reversed the decrease in membrane potential (Figure 6H and Figure S6H) and attenuated mitochondrial ROS accumulation (Figure 6I and Figure S6I) caused by MPP+. In addition, the results of fluorescence and WB indicated that MIR24-3p inhibitor alleviated apoptosis and enhanced mitophagy (Figure 6J,K). As we know, MIR24-3p has many other roles and targets. To further support that MIR24-3p mediated its effect through regulating PINK1, we prepared the pink1-/- mice microinjected with Mir24-3p antagomir (Figure 6L and Figure S7A-C). Results showed TH+ and Nissl+ neurons in the midbrain were markedly improved given Mir24-3p antagomir, while these effects were abolished in pink1-/- mice (Figure 6M). Immunoblot analysis and quantification of TH, BCL2 and BAX in the midbrain also confirmed the conclusion (Figure 6N and Figure S7D-H). Damage of TH neurons deceased by MPP+ exposure can be reversed by Mir24-3p inhibitor antagomir, while the neuroprotective effect was abolished in pink1-/- primary neurons (Figure S7I-L).
Figure 6.
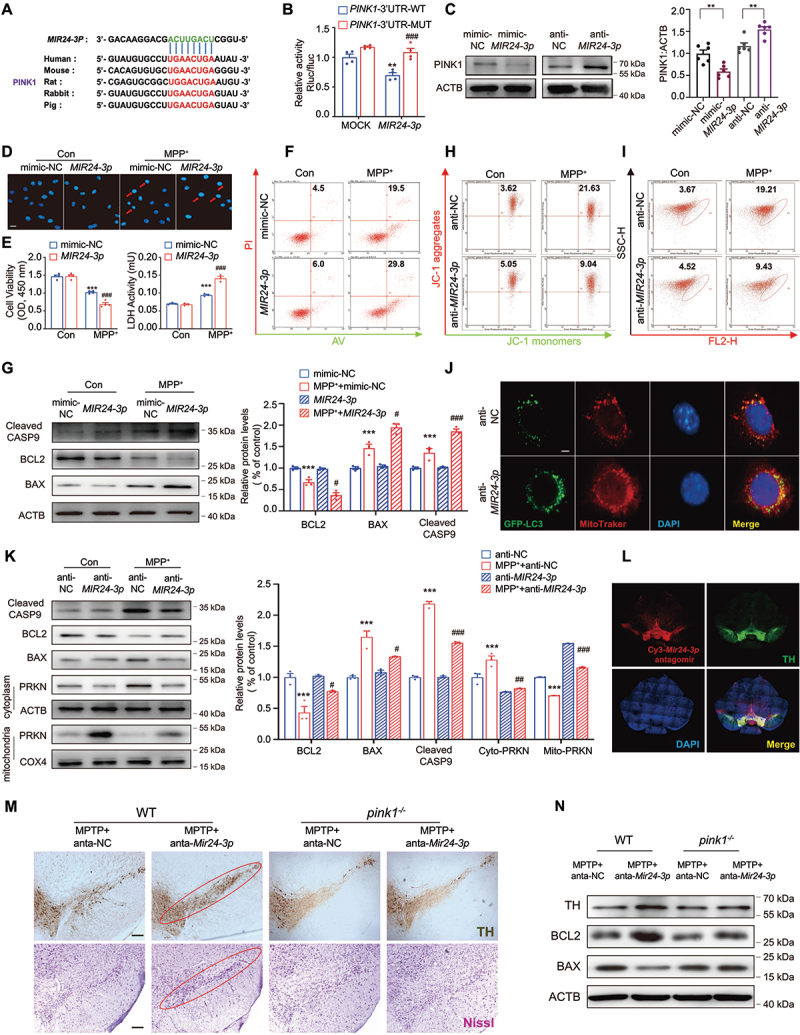
PINK1 was a direct target gene of MIR24-3p, and anti-MIR24-3p had a neuroprotective effect in vitro. (A) Putative MIR24-3p binding sites in PINK1 (PINK1 gene) in different species. (B) Relative luciferase activity of wild-type and 3’-UTR mutant constructs of PINK1 co-transfected with MIR24-3p mimics and miRNA negative control. n = 4/group. (C) Western blot was used to detect the expression level of PINK1 when transfected with MIR24-3p mimics or inhibitors. n = 6/group. Minic-NC: minic negative control, anti-NC: inhibitor negative control. Cell viability, LDH release and representative images of DNA damage using Hoechst staining (D-E) were detected after being treated with 500 μM MPP+ while transfected with MIR24-3p mimics. n = 4–6/group. Scale bar: 50 μm. Arrow: apoptosis cells. (F) Cells were stained with Annexin V-APC and PI, and the percentage of apoptotic cells was detected by flow cytometry while transfected with MIR24-3p mimics. n = 3/group. (G) Immunoblot analysis and quantitation of BCL2, BAX and cleaved CASP9 while transfected with MIR24-3p mimics. n = 3/group. Cells were stained with JC-1 (H) and MitoTracker (I), and the percentage of cells that changed MMP and MitoTracker red/green was detected by flow cytometry while transfected with MIR24-3p mimics. n = 3/group. (J) Colocalization of GFP-LC3 and MitoTracker transfected with anti-MIR24-3p in the SH-SY5Y cell. Green, GFP-LC3; Red, MitoTracker; Blue, DAPI. Scale bar: 10 μm. (K) Expressions of BAX, BCL2, cleaved CASP9, PRKN and COX4 were detected. Cytoplasm and mitochondria were separated to detect the expression of PRKN after being transfected with anti-MIR24-3p. n = 3/group. (L) Colocalization of Cy3-Mir24-3p and TH injected with Mir24-3p antagomir. (M) Immunohistochemical staining of TH+ neuron and Nissl staining of neuron injected with Mir24-3p antagomir in the WT and pink1-/- mice after MPTP treatment. n = 3 male mice/group. Anta-NC: antagomir negative control which was used as control of antagomir-Mir24-3p, (N) Immunoblot analysis of BCL2, BAX and TH in the WT and pink1-/- mice after MPTP treatment. Data were presented as mean ± S.E.M. **P < 0.01, ***P < 0.001 vs control group. ###P < 0.001 vs MPP+ group. Two-way ANOVA with Dunnett’s multiple comparisons test (B, E-F). **P < 0.01, ***P < 0.001 vs control using Student’s t-test (C).
Next, we sought to explore whether anti-Mir24-3p plays a neuroprotective role in PD in vivo. We found that, in the basal state, the aged A53T transgenic (A53Ttg/tg) mice showed an increased level of Mir24-3p, which was accompanied by downregulation of PINK1 and upregulation of SNCA/α-synuclein (Figure 7B,C). These factors suggested that A53T is a suitable model for exploring the interaction between MIR24-3p and PINK1. Cy3-conjugated Mir24-3p antagomir was injected into the SNpc of A53Ttg/tg mice (Figure 7A) and was widely expressed in the TH+ cells in the SNpc region (Figure 7D). The level of Mir24-3p was significantly decreased by injecting Mir24-3p antagomir (Figure S6J). In the subacute MPTP model, Mir24-3p antagomir treatment elevated the expression of PINK1 in the midbrain of A53Ttg/tg mice, indicating an acceleration of mitophagy (Figure 7E and Figure S6K). More importantly, Mir24-3p antagomir ameliorated MPTP-induced TH+ neuronal loss. The results showed that subacute MPTP/p treatment decreased TH+ cells by 38% and Nissl+ cells by 39% in the SNpc of A53Ttg/tg mice, but Mir24-3p antagomir treatment reduced the percentage of loss to 16% and 25% respectively (Figure 7F–H). In agreement with immunostaining results, western blot analysis showed that subacute MPTP administration induced apoptosis, which can be markedly reversed by Mir24-3p antagomir injection (Figure 7I). Additionally, immunostaining of SNCA and LC3 demonstrated that Mir24-3p antagomir reduced SNCA levels and enhanced autophagy in DA neurons (Figure 7J,K and Figure S6L-M). Collectively, our data demonstrate that MIR24-3p-PINK1 axis exerts a critical role in mediating DA neuronal fate in the progress of PD.
Figure 7.
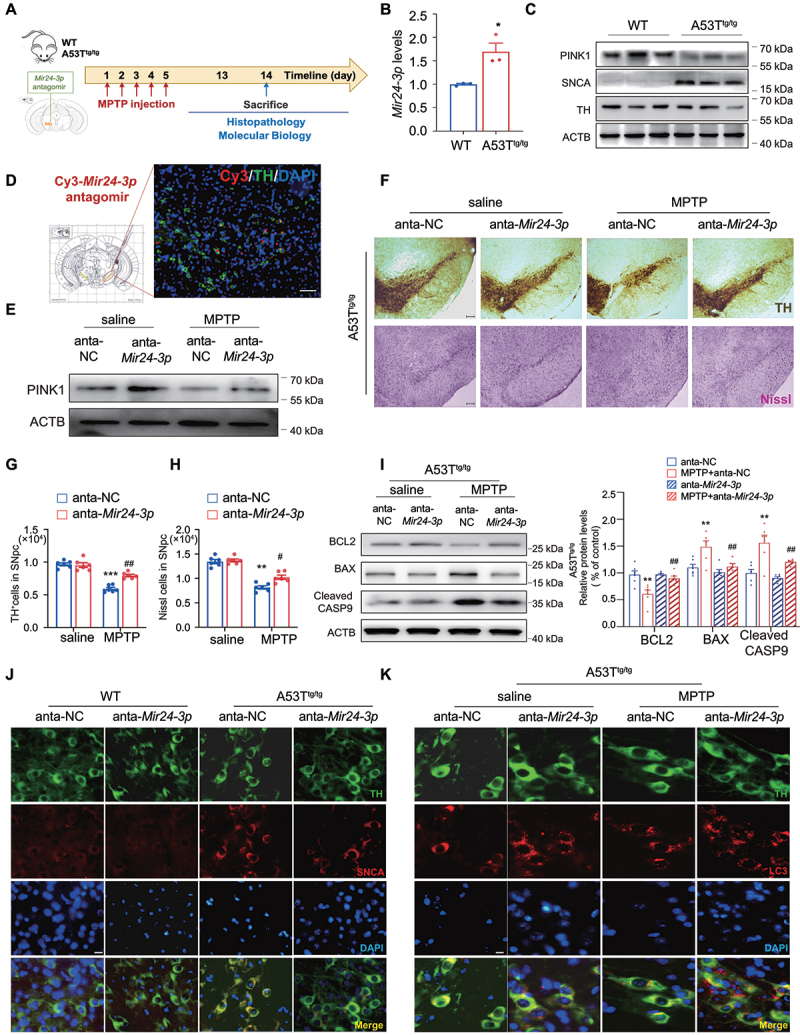
Anti-Mir24-3p played a neuroprotective effect in vivo. (A) Schematic diagram of the model injected Cy3-Mir24-3p-antagomir to the midbrain of A53Ttg/tg mice. n = 6 male mice/group. (B) QT-PCR showed the expression of Mir24-3p was upregulated in A53Ttg/tg mice. n = 3/group. (C) Immunoblot for PINK1, SNCA and TH in the midbrain of WT and A53Ttg/tg mice. (D) Colocalization of Cy3 and TH after the Mir24-3p antagomir microinjection into the midbrain. Green, TH; Red, Cy3; Blue, DAPI. Scale bar: 100 μm. (E) the expression of PINK1 was detected by WB in the subacute MPTP model. (F) Immunohistochemical staining of TH+ neuron and Nissl staining of neuron in the SNpc after subacute MPTP treatment. (G) Counting TH+ neuron and (H) Nissl+ cells in the SNpc. n = 6 male mice/group. (I) Immunoblot analysis and quantitation of BCL2, BAX and cleaved CASP9 in A53Ttg/tg mice after subacute MPTP treatment. n = 6/group. (J) Colocalization of TH and SNCA in WT and A53Ttg/tg mice. Green, TH; Red, SNCA; Blue, DAPI. (K) Colocalization of TH and LC3 in A53Ttg/tg mice after subacute MPTP treatment. Green, TH; Red, LC3; Blue, DAPI. *P < 0.05 using Student’s t-test (B). Data were presented as mean ± S.E.M. ***P < 0.001 vs anta-NC-saline group. #P < 0.05, ##P < 0.01 vs anta-NC-MPTP group. Two-way ANOVA with Dunnett’s multiple comparisons test (G and H).
Overexpression of CircEPS15 protects DA neurons in the MPTP mouse model
As a MIR24-3p sponge, the regulatory effect of circEPS15 on PD was further investigated in the MPTP mouse model. CircEPS15-Vector or CircEPS15-AAV was injected into the SNpc of mice followed by MPTP injection, behavioral test and biochemical analysis (Figure 8A). The CircEPS15-AAV injection elevated the expression of circEPS15 in both midbrain and plasma samples (Figure S8A-B). In the SNpc region, circEPS15 was expressed dominantly in TH+ cells (Figure 8B) and had the colocalization with Mir24-3p (Figure 8C). As shown in Figure 8D, open field test (speed and course) was employed to determine the effect of circEPS15 on mouse movement behaviors. It was found that both speed and course were markedly improved in the circEPS15 overexpressed mice (Figure 8D,E). In the rotarod test, circEPS15-overexpressed mice showed longer residence time than that Vector mice, whereas the retention period in the pole test was similar between the two groups (Figure 8F and Figure S8C). Furthermore, HPLC analysis showed that the level of dopamine in the striatum was significantly decreased in the control group after MPTP/p injections, but circEPS15-overexpressed mice exhibited higher levels of dopamine than the control group (Figure 8G). In both chronic and subacute MPTP models, overexpression of circEPS15 ameliorated MPTP-induced loss of DA neurons and DA transporter (Figure 8H and Figure S8D-F, 8N-P). Moreover, as shown in Figure 8I and Figure S8G-M, overexpression of circEPS15 reversed TH reduction, protected against apoptosis, and promoted mitophagy in the MPTP mouse model. The increased expression of PINK1 and PRKN in TH+ cells indicated that circEPS15-boosted mitophagy indeed occurred in DA neurons (Figure 8J). Based on the results in vitro, we further verified the effect of circEPS15 and MIR24-3p in vivo. WT mice were microinjected with Mir24-3p agomir and circEPS15 mixture into the midbrain. The results showed that TH+ and Nissl+ neurons in the midbrain were markedly decreased given Mir24-3p agomir, while these effects were reversed by overexpression of circEPS15 (Figure 8K and Figure S8Q-R). Consequently, these data confirm that circEPS15, as a MIR24-3p sponge, regulates PINK1-dependent mitophagy to protect DA neurons in PD.
Figure 8.
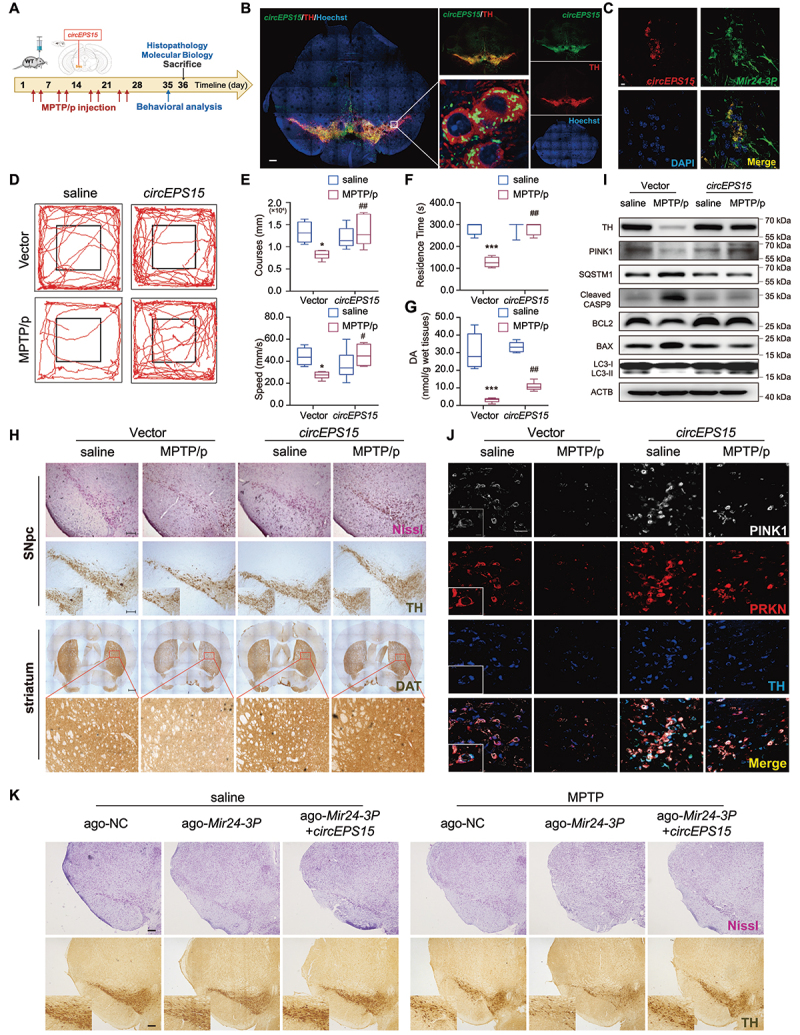
CircEPS15 promoted the recovery of dopaminergic neurons in vivo. (A) Schematic diagram of the mouse MPTP/p model. (B) Expression efficiency of circEPS15 overexpression. Red, TH; Green, circEPS15; Blue, Hoechst. Scale bar: 100 μm. (C) Colocalization of circEPS15 and Mir24-3p using FISH. Red, circEPS15; Green, Mir24-3p; Blue, DAPI. Scale bar: 10 μm. (D) Representative motor performance in the open field test. Mice were in an open field within 5 min and recorded movement distance. n = 6 male mice/group. (E) Speed and course in the open field test. (F) Time is taken for mice residence in the bar. (G) the level of dopamine in mouse striatum homogenate was detected by HPLC. (H) Immunohistochemical staining of TH+ neuron and Nissl staining of neuron in the SNpc (upper panel). Immunohistochemical staining of TH+ neuron in the striatum (lower panel). (I) TH, PINK1, BCL2, BAX, cleaved CASP9, LC3 and SQSTM1 from mouse mesencephalon homogenate were analyzed by immunoblotting. (J) Colocalization of PINK1, PRKN and TH transfected with circEPS15 in the SNpc of control and MPTP/p group. (K) Immunohistochemical staining of TH+ neuron and Nissl staining of neuron in the SNpc. Ago-NC: agomir negative control which was used as control of agomir-Mir24-3p. White, PINK1; Red, PRKN; Blue, TH. Scale bar: 100 μm. Data were presented as mean ± S.E.M. *P < 0.05, ***P < 0.001 vs Vector-saline group. #P < 0.05, ##P < 0.01 vs Vector-MPTP/p group. Two-way ANOVA with Dunnett’s multiple comparisons test (G and H).
Discussion
Our study identified and verified that circEPS15 was downregulated in the peripheral blood of PD patients and its expression level was correlated with the H-Y stage/UPDRS score of PD patients. It was demonstrated that overexpression of circEPS15 significantly ameliorated dopaminergic neuronal loss and motor coordination behavioral symptoms in the MPTP/p PD mice model. Gain-of-function experiments showed that circEPS15 significantly promoted cell proliferation, inhibited apoptosis, mediated the clearance of damaged mitochondria and maintained mitochondrial homeostasis. Different databases (TargetScan, miRDB, and Circbase) were applied to obtain candidate miRNAs involved in circEPS15-mediated mitophagy. Mechanistic studies showed that circEPS15 acted as a MIR24-3p sponge to upregulate PINK1, leading to the acceleration of mitophagy and protection of dopaminergic neurons. This study reveals the role of circEPS15 in the pathogenesis of PD and provides a potential biomarker for the diagnosis and treatment of PD (Figure 9).
Figure 9.
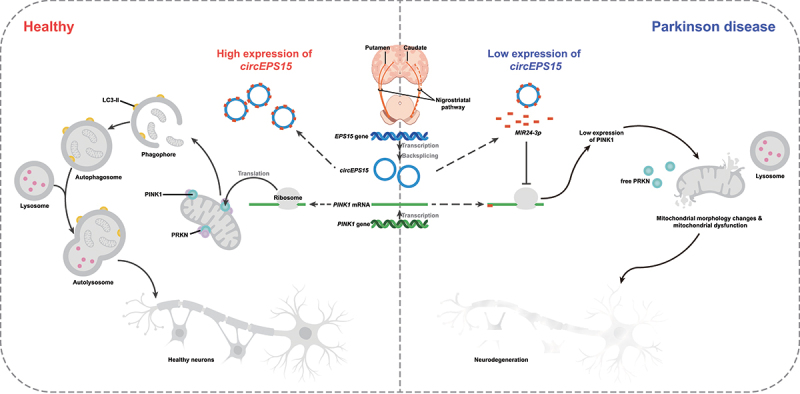
Schematic diagram: the mechanism by which circEPS15 acts as a MIR24-3p sponge to maintain the expression of PINK1 thus enhancing PINK1-PRKN-dependent mitophagy to promote DA neuron recovery and improve mitochondrial function in vitro and in vivo.
Circular RNA was originally thought to be the product of mistaken splicing during the gene transcription process. However, emerging evidence has revealed that circRNAs exert important biological functions in neurodegenerative diseases [4]. Due to a lack of a circRNA map for the progression of PD, we performed rRNA-depleted RNA sequencing and detected more than 10,000 circRNAs in 4 pairs of PD patients and matched normal controls. Among these circRNAs, circEPS15 and circJA429830 are correlated with PD progression, but the latter is not relevant to the clinical UPDRS score (Figure S1A). To this end, circEPS15 was the candidate for further experiments.
Growing evidence has revealed that circRNAs can serve as protein scaffolds, competitors for protein binding and miRNA sponges [35,36]. Among these plausible functions, circRNAs are widely studied as miRNA sponges that can bind miRNAs, and subsequently prevent them from suppressing their target mRNAs [37]. In PD, it was reported that circSNCA can sponge miR-7 to mediate apoptosis and autophagy of SH-SY5Y cells [8]. In addition, research showed that circDLGAP4 plays a neuroprotective role through MIR134-5p-CREB pathway [10]. Although circRNAs have been well studied in recent years, the roles of circRNAs in PD pathogenesis are poorly documented. Our study demonstrates that circEPS15 can sponge MIR24-3p, thus interfering with downstream target genes. Furthermore, the interaction between circEPS15 and MIR24-3p was confirmed via FISH and affinity isolation assays. Then, PINK1 was identified as the target gene of MIR24-3p by using computational algorithms and Luciferase activity assay. Of course, may some researchers consider that the content of microRNA in the body is much higher than that of circRNA, which may be because microRNA has other functions in vivo besides sponging with circRNA [38]. Moreover, in our study, we suspected whether the downregulation of circEPS15 was caused by the parent gene. Therefore, we checked the RNA sequencing and found that the EPS15 gene had no significant change in patients’ samples. The results of WB experiment also showed that the protein EPS15 was not changed in the midbrain of MPTP model mice. Therefore, we think that the downregulation of circEPS15 was not related to the parent gene EPS15.
The PINK1 gene encodes serine-threonine kinase which was highly conserved [39]. It was reported that mutations of PINK1 could cause autosomal-recessive parkinsonism [40,41]. Besides, PINK1 was demonstrated to play a crucial role in triggering mitophagy, a cellular process that selectively clears impaired mitochondria via autophagic degradation [42]. Accumulating evidence suggests that the PINK1-PRKN signaling is tightly associated with mitochondrial homeostasis, dysfunction of this quality control pathway usually leads to neurodegeneration [15]. In our study, the expression of PINK1 was inhibited by MIR24-3p in the PD models, leading to impaired mitophagy and neuronal damage. And circEPS15 protected against PD pathology through recovering PINK1-PRKN-mediated mitophagy.
Conclusion
This study demonstrates for the first time that circEPS15 binds to MIR24-3p and acts as an endogenous sponge to inhibit the post-transcriptional control of MIR24-3p, resulting in increased expression of PINK1 and induction of mitophagy and subsequent rescue of dopaminergic neurons. Combining the results from clinical samples and animal models, we believe that circEPS15 is a promising biomarker and target for therapeutic interventions in PD.
Materials and methods
RNA-seq libraries preparation and data analysis
CloudSeq Biotech Inc. (Shanghai, China) provided the RNA Sequencing service following the previously published procedures [43,44]. Peripheral blood samples of Parkinson patients and healthy controls were collected with consent which was reviewed and approved by the Ethics Committee of the Affiliated Brain Hospital of Nanjing Medical University (Nanjing, China). The characteristics of people involving the controls and PD patients are presented in Table S1.
Briefly, the blood samples were stored in the EDTA-pretreated tube stand for 3 h and then centrifuged at 3500 g for 5 min. After that, the uppermost plasma layer was carefully collected and placed in a new RNase-free tube. The RNA libraries were built using rRNA-depleted RNAs with TruSeq Stranded Total RNA Library Prep Kit (Illumina, hisep4000) according to the manufacturer’s instructions.
Bioinformatics analysis
The circRNAs and miRNA sponges screening were analyzed by these databases: Circbank (http://www.circbank.cn/help.html), TargetScan (http://www.targetscan.org) and miRbase (http://www.mirbase.org). The candidate circRNAs were selected mainly based on their fold change and excluding circRNAs of low abundance whose unique junction reads cannot be found in more than three samples, or less than ten total junction reads were seen.
Primary cell cultures and treatment
Primary astrocytes were collected from the brain tissues of neonatal mice (3 days) as previously reported [45]. Astrocytes were seeded into the plate coated with poly-L-lysine (Sigma-Aldrich, P4707) and cultured for 7–10 days according to our previous literature. Primary microglia were collected as in previous works [45,46]. Microglia were seeded on the T75 precoated PLL and the culture medium is the same as astrocytes, and the microglia were collected by shaking the glia culture at 200 g for 15 min after 10–14 days.
Primary DA neurons were isolated from 14–16 days pregnant by treatment with 0.125% trypsin/EDTA and the culture medium is the neurobasal medium (Thermo Fisher, A3582901) supplied with 10% B27 (Thermo Fisher, A3582801) and 100 unit/mL penicillin-streptomycin (Thermo Fisher, 15140163). In our culture, it performed the quantification of 3.61% of TH+ neurons, which is consistent with the literature [47,48]. MPP+ 500 μM for 24 h was used to prepare the in vitro models of PD in the experiments of primary glial cells, and MPP+ 30 μM for 24 h was used in primary neurons.
Cell line culture and transfection
SH-SY5Y and HEK-293T cells were acquired from the American Type Culture Collection (CRL-2266; http://www.atcc.org) and National Collection of Authenticated Cell Cultures (SCSP-502; https://www.cellbank.org.cn) respectively, and were both detected by STR profiling. Lipofectamine 3000 (Invitrogen, L3000015) was used to transfect the miRNAs or siRNA oligos refer to the manufacturer’s instructions. The MIR24-3p (Hanbio, HH20200311RFF) and PINK1 siRNA (GenePharma, GY20200928RFF) were transfected at a concentration of 50 nM. For the overexpression of PINK1, full-length human PINK1 cDNA and its truncations were amplified and subcloned into pcDNA3.1 (Hanbio, HH20201015RFF). The sequences of miRNAs and siRNA was shown in Table S2.
Animals
All 3-month-old male C57BL/6J mice were obtained from Nanjing Medical University (Nanjing, Jiangsu, China) and raised in temperature- and humidity-controlled rooms in light/dark. pink1−/- mice were constructed in GemPharmatech (Nanjing, Jiangsu, China).
A53T mice were constructed by Nanjing University [49]. The animal procedures were followed as per the Institutional Animal Care and Use manual of Nanjing Medical University.
Stereotaxic surgery
The adeno-associated virus (AAV) overexpressing circEPS15 (AAV2/9) and the corresponding empty vector were injected into the mice midbrains with stereotaxic surgery using sodium pentobarbital anesthesia (40 mg.kg−1; Sigma, 1030001) according to previous literature [50,51]. The 3-dimensional coordinates of the mice midbrains are as follows: A/P −3.0 mm, R/L ±1.3 mm, and D/V −4.5 mm. Each mouse was microinjected with either a GFP-AAV or CircEPS15-GFP AAV (1 μL of 2 × 10¹² viral genome/μL, Hanbio). To evaluate the effects of circEPS15 on the chronic and subacute mouse PD model, mice were divided into 4 groups 3 weeks after AAV microinjection: GFP-AAV + Saline, CircEPS15-GFP + Saline, GFP-AAV + MPTP, CircEPS15-GFP + MPTP. To evaluate the effects of antagomir on the A53T mouse MPTP PD model, each mouse was microinjected with antagomir (2.5 μL/one side, 1 nmol, RiboBio). Mice were divided into 4 groups 3 weeks after microinjection: anta-Mir24-3p negative control (NC) + Saline, anta-Mir24-3p + Saline, anta-Mir24-3p NC + MPTP, anta-Mir24-3p + MPTP. To evaluate the effects of Agomir (2.5 μL/one side, 1 nmol, RiboBio) on the subacute mouse PD model, mice were divided into 6 groups 3 weeks after microinjection: ago-Mir24-3p negative control (NC) + Saline, ago-Mir24-3p + Saline, ago-Mir24-3p + CircEPS15-GFP + Saline, ago-NC + MPTP, ago-Mir24-3p + MPTP, ago-Mir24-3p + CircEPS15-GFP + MPTP.
Treatment of the MPTP/p PD mouse model
The chronic and subacute PD models were prepared. Chronic model: 20 mg/kg of MPTP (Sigma-Aldrich, M0896) was subcutaneously injected followed by 250 mg/kg probenecid (Sigma-Aldrich, D2650) dissolved in DMSO intraperitoneal injection over 5 weeks. Subacute models: 30 mg/kg MPTP was subcutaneously injected once a day over 1 week. Saline and probenecid were administered to each control mouse. Samples were collected 1 week after the final injection.
High-performance liquid chromatography (HPLC)
To detect the quantity of DA in the striatum, the mice were sacrificed. After separating the striatum, the samples (10 μL/mg tissue) were homogenated (containing 0.1 mol/L perchloric acid, 0.1 mM EDTA-2Na, 4 × 10⁻⁸ mol/L DHBA [Sigma, 858781]), magnetic bead homogenated, and the homogenate centrifuged with 20,000 g for 20 min at 4°C, then the supernatant was taken for detection. Waters HPLC detection system: 1525 Binary HPLC Pump, 2465 Electrochemical Detector; 717 plus Auto sample; Thermo BDS HYPERSIL column, 5 μm, 250 × 4.6 mm; Parameter setting: voltage 600 mV, sensitivity 5.0 nA, column temperature 40°C, flow rate 1.0 ml/min, sample injection 10 μL. Millennium 32 chromatographic workstation collects and analyzes data.
Stoichiometry
The plasmid pcDNA3.1 was constructed by taking 150 bp before and after the junction site (PPL, BQ000132). After shaking bacteria extraction, a solution with a concentration of 1 μg/μL circEPS15 was obtained. Then, the plasmid was diluted according to the concentration gradient, and the qPCR experiment was carried out so that the Ct values corresponding to different concentration gradients could be used to obtain the standard curve. After that, the Ct values detected by circEPS15 in the samples were compared with the standard curve to accurately calculate the copy number of circEPS15.
Western blot
RIPA (Sigma, R2078) was applied for homogenizing tissue, and then the BCA protein assay kit (Thermo Fisher, 23235) was used to detect the total protein. The 8–15% SDS-PAGE gels were designed to separate total protein and transferred using the PVDF membranes (Millipore, ISEQ00005). Membranes were then blocked with 5% bovine serum albumin (BSA; Sigma, V900933) for 1.5 h, and 10 ml of antibody mixture was added and incubated at 4°C overnight. The antibodies were as follows: anti-TH (Millipore, AB152), anti-PINK1 (Novus, BC100–494), anti-PRKN (Abcam, ab77924), anti-COX4 (Santa Cruz Biotechnology, sc -376,731), anti-BCL2 (Santa Cruz Biotechnology, sc-7382), anti-BAX (Cell Signaling Technology, 14796), anti-CASP9 (Santa Cruz Biotechnology, sc -56,076), anti-ACTB (Sigma-Aldrich, A5441), anti-LC3 (Proteintech Group, 14600–1-AP), and anti-SQSTM1 (Proteintech Group, 18420–1-AP).
Luciferase reporter assay
The vectors of luciferase reporters were synthesized by Vector Builder (Hanbio, Shanghai, China). HEK-293T cells were transfected with 100 nM control mimics. Cells were co-transfected with constructs of 1 μg per well of pGL3-Circ-EPS15/PINK1-3′UTR or pGL3-Circ-EPS15/PINK1-3′UTR Mut using Lipofectamine 3000 6 h after transfection. The luciferase activity was calculated by a dual-luciferase reporter assay kit (Promega, E1960) after 48 h of transfection on a Varioskan LUX machine.
Cell viability assay
The cell viability was detected by the CCK-8 Cell counting kit (Vazyme, A311–01). Ten μL of working fluid and 90 μL of DMEM were added to each hole and reacted at 37°C for 1–2 h. Then, the absorbance at 450 nm wavelength was measured.
Assay of LDH (lactate dehydrogenase)
The LDH release was measured using an LDH diagnostic kit (Solarbio, BC0685). According to the reagent manufacturer’s instructions, the activity of LDH was calculated by the results of enzyme labeling instrument (450 nm).
Immunohistochemistry
The mice were perfused with saline for 5 min after anesthetization, and the brain tissues were placed in 4% paraformaldehyde overnight, then in 20% sucrose solution for overnight 3 times, and finally in 30% sucrose solution for overnight 3 times. The Leica M1950 microtome was used for frozen sectioning with a thickness of 20 μm each slice. The brain slices were washed in phosphate-buffered saline (PBS; Sigma, P-3813) 2 times for 10 min each time, soaked in 3% H2O2 for 15 min, immersed in 5% BSA in PBS for 1.5 h, and then primary antibodies (anti-TH [Millipore, AB152], anti-SLC6A3/DAT [Santa Cruz Biotechnology, sc -32,259]) overnight and corresponding secondary antibody (Proteintech Group, B900210) for 1 h, finally the commercial kit (MX Biotechnologies, DAB-0031) for immunostaining. The optical fractionator (MBF Bioscience, Williston, VT) was applied to calculate the numbers of TH-neurons in the SNpc. The Nissl staining was followed with the instruction of the manufacturer (Solarbio, G1430).
Immunofluorescence and 3D reconstruction
The experimental process was the same as immunohistochemistry. The primary antibodies were as follows: anti-TH [Millipore, AB152], anti-PINK1 [Novus, BC100–494], anti-PRKN [Proteintech Group, 66674–1-Ig], anti-SNCA [Becton Dickinson, 610787], anti-LC3 [Cell Signaling Technology, 2775]). The secondary antibodies were: Alexa Fluor 555 goat anti-mouse IgG (Thermo Fisher, A21422), Alexa Fluor 488 goat anti-rabbit IgG (Thermo Fisher, A11008) and Alexa Fluor 647 goat anti-rabbit IgG (Thermo Fisher, A32795). Finally, the sections were sealed with DAPI (Sigma-Aldrich, D9542), and then they were detected by a confocal scanning laser microscope (Carl Zeiss).
The primary DA neurons were observed and stereoscopic counting with Stereo-Investigator software (Olympus). A total of 50 TH immunoreactive neurons were calculated per group. Three-dimensional (3D) reconstruction and Sholl analysis of TH-positive cells were analyzed by Neurolucida 11.
Mitochondrial membrane potential (MMP)
The mitochondrial membrane potential was measured using JC-1 (Thermo Fisher, T3168) staining. The SH-SY5Y cells were stained for 30 min at 37°C and then analyzed by flow cytometer (Becton Dickinson).
Mitochondrial reactive oxygen species (ROS)
The cells were incubated with Mitosox Red (Thermo Fisher, M36008; 5 μM) for 30 min, and then the stained cells were viewed by confocal microscopy. The mitochondrial ROS was evaluated by flow cytometer (Becton Dickinson).
ANXA5/annexin V-PI fluorescence-activated cell sorter analysis
The cell apoptosis was detected by flow cytometer (Becton Dickinson) using an Annexin V/PI apoptosis detection kit (Becton Dickinson, 556547).
Isolation of mitochondria
The mitochondria of SH-SY5Y cells were isolated referring to the manufacturer’s instruction (Mitochondria Isolation Kit; Beyotime, 3606, 3601), and then RIPA lysate was added to lyse mitochondria proteins. The concentrations of protein were quantified with a BCA kit (Thermo Scientific, 23225).
RNA immunoprecipitation
According to the manufacturer’s instructions, the RIP assay was carried out with EZ-Magna RIP RNA-binding protein immunoprecipitation Kit (Millipore, 17–704). The SH-SY5Y cells were collected in RIP lysis buffer with protease and RNase inhibitors. After centrifugation, the beads conjugated with IgG or AGO2 antibodies were added to the cell lysate at 4°C for 12 h. Then, the beads were washed and incubated with proteinase K. Finally, RNA was extracted using Trizol Reagent (Invitrogen, 15596018).
RNase R treatment, cDNA synthesis, and PCR
The RNA and RNase R (Geneseed, R0302) were incubated together for 30 min at 37°C. Then, the Prime Script RT Master Mix (Vazyme, R223–01) was applied to reverse transcription of RNA into cDNA, which was followed by ChamQ SYBR qPCR Master Mix (Vazyme, Q321–02). The primers we used were presented in Table S2.
Overexpression of CircRNA-EPS15
The lentivirus overexpressing CircEPS15 was synthesized by Vector Builder (1 μL of 1 × 10⁹ viral genomes/μL, Hanbio, Shanghai, China). SH-SY5Y cells were infected with lentivirus for 72 h, and 2 mmol/L of puromycin was given to stimulate the selection of surviving cells to construct transfected cell lines.
Fluorescence in situ hybridization (FISH)
GenePharma (China) designed and produced FAM-labeled MIR24-3p and Cy3-labeled circEPS15 probes. The fluorescent in Situ Hybridization Kit (GenePharma, China) was used to detect the probes, and images were obtained using confocal scanning laser microscope (Carl Zeiss).
Behavioral assays
The rotarod test, open field test and pole test were carried out 3hree days after the final MPTP or saline injection. The software (Clever Sys Inc) was used to record the mice’s tracks for 5 minutes and compute their speeds in OFT. The mice were placed head-up on top of a 50 cm tall, 1 cm diameter, vertical wooden pole for the pole test. The day before behavior tests, familiarize each mouse with the device. The time required for T-turn and T-total that performed the best for each session of three trials were retained. Prior to the rotarod test, the device had been used to train the mice (300 s at a fixed speed of 20 rpm) per day for 3 days. The time spent on the rotating stick was recorded for each mouse.
Statistical analysis
Statistical analyses were performed using SPSS version 22.0 or GraphPad Prism 9.0 software, and all data were presented as mean ± S.E.M. * P < 0.05, ** P < 0.01, *** P < 0.001 using Student’s t-test. Statistical significance was assessed with two-way ANOVA with Dunnett’s multiple comparisons tests.
Supplementary Material
Acknowledgements
We would like to thank Dr. Lei Cao from the Department of Pharmacology, National University of Singapore, for his helpful suggestions on the manuscript.
Funding Statement
The work reported herein was supported by grants from the National Key R&D Program of China [No.2021ZD0202903], the National Natural Science Foundation of China [No.81922066, No.82173797, No.82003725, No.81991523 and No.82003722].
Disclosure statement
No potential conflict of interest was reported by the author(s).
Data availability statement
All data needed to evaluate the conclusions in the paper are present in the paper and/or the Supplementary Materials. Additional data related to this paper may be requested from the authors.
Ethics approval and consent to participate
All experiments involving serum samples of PD patients were approved by the Committee of Nanjing Medical University (NJMU-2019-784). All animal experiments were approved by the Institutional Animal Care and Use Committee of Nanjing Medical University (1601153–3) and complied with institutional guidelines.
Supplementary material
Supplemental data for this article can be accessed online at https://doi.org/10.1080/15548627.2023.2196889.
References
- [1].Cheng HC, Ulane CM, Burke RE.. Clinical progression in Parkinson disease and the neurobiology of axons. Ann Neurol. 2010;67(6):715–725. [DOI] [PMC free article] [PubMed] [Google Scholar]
- [2].Verduci L, Strano S, Yarden Y, et al. The circRNA-microRNA code: emerging implications for cancer diagnosis and treatment. Mol Oncol. 2019;13(4):669–680. DOI: 10.1002/1878-0261.12468 [DOI] [PMC free article] [PubMed] [Google Scholar]
- [3].Mahmoudi E, Cairns MJ. Circular RNAs are temporospatially regulated throughout development and ageing in the rat. Sci Rep. 2019;9(1):2564. [DOI] [PMC free article] [PubMed] [Google Scholar]
- [4].You X, Vlatkovic I, Babic A, et al. Neural circular RNAs are derived from synaptic genes and regulated by development and plasticity. Nat Neurosci. 2015;18(4):603–610. DOI: 10.1038/nn.3975 [DOI] [PMC free article] [PubMed] [Google Scholar]
- [5].Zhao Y, Alexandrov PN, Jaber V, et al. Deficiency in the Ubiquitin Conjugating Enzyme UBE2A in Alzheimer’s Disease (AD) is linked to deficits in a natural circular miRNA-7 sponge (circRNA; ciRS-7). Genes (Basel). 2016;7(12):116. DOI: 10.3390/genes7120116 [DOI] [PMC free article] [PubMed] [Google Scholar]
- [6].Mahmoudi E, Fitzsimmons C, Geaghan MP, et al. Circular RNA biogenesis is decreased in postmortem cortical gray matter in schizophrenia and may alter the bioavailability of associated miRNA. Neuropsychopharmacology. 2019;44(6):1043–1054. DOI: 10.1038/s41386-019-0348-1 [DOI] [PMC free article] [PubMed] [Google Scholar]
- [7].Yao G, Niu W, Zhu X, et al. Hsa_circrna_104597: a novel potential diagnostic and therapeutic biomarker for schizophrenia. Biomarker Med. 2019;13(5):331–340. DOI: 10.2217/bmm-2018-0447 [DOI] [PubMed] [Google Scholar]
- [8].Sang Q, Liu X, Wang L, et al. CircSNCA downregulation by pramipexole treatment mediates cell apoptosis and autophagy in Parkinson’s disease by targeting miR-7. Aging (Albany NY). 2018;10(6):1281–1293. DOI: 10.18632/aging.101466 [DOI] [PMC free article] [PubMed] [Google Scholar]
- [9].Hanan M, Simchovitz A, Yayon N, et al. A Parkinson’s disease CircRNAs resource reveals a link between circSLC8A1 and oxidative stress. EMBO Mol Med. 2020;12(9):e11942. DOI: 10.15252/emmm.201911942 [DOI] [PMC free article] [PubMed] [Google Scholar]
- [10].Feng Z, Zhang L, Wang S, et al. Circular RNA circDLGAP4 exerts neuroprotective effects via modulating miR-134-5p/creb pathway in Parkinson’s disease. Biochem Biophys Res Commun. 2020;522(2):388–394. DOI: 10.1016/j.bbrc.2019.11.102 [DOI] [PubMed] [Google Scholar]
- [11].Kumar L, Shamsuzzama, Jadiya P, et al. Functional characterization of novel circular RNA molecule, circzip-2 and its synthesizing gene zip-2 in C. Elegans model of Parkinson’s disease. Mol Neurobiol. 2018;55(8):6914–6926. DOI: 10.1007/s12035-018-0903-5 [DOI] [PubMed] [Google Scholar]
- [12].Matheoud D, Sugiura A, Bellemare-Pelletier A, et al. Parkinson’s disease-related proteins PINK1 and Parkin repress mitochondrial antigen presentation. Cell. 2016;166(2):314–327. DOI: 10.1016/j.cell.2016.05.039 [DOI] [PubMed] [Google Scholar]
- [13].Burré J, Sharma M, Südhof TC. Cell biology and pathophysiology of α-Synuclein. Cold Spring Harb Perspect Med. 2018;8(3):a024091. [DOI] [PMC free article] [PubMed] [Google Scholar]
- [14].Cookson MR. DJ-1, PINK1, and their effects on mitochondrial pathways. Mov Disord. 2010;25(Suppl 1):S44–48. [DOI] [PMC free article] [PubMed] [Google Scholar]
- [15].Ge P, Dawson VL, Dawson TM. PINK1 and Parkin mitochondrial quality control: a source of regional vulnerability in Parkinson’s disease. Mol Neurodegener. 2020;15(1):20. [DOI] [PMC free article] [PubMed] [Google Scholar]
- [16].Thomas B, Beal MF. Parkinson’s disease. Hum Mol Genet. 2007;16(Spec No. 2):R183–194. [DOI] [PubMed] [Google Scholar]
- [17].Valente EM, Salvi S, Ialongo T, et al. PINK1 mutations are associated with sporadic early-onset parkinsonism. Ann Neurol. 2004;56(3):336–341. DOI: 10.1002/ana.20256 [DOI] [PubMed] [Google Scholar]
- [18].Liu W, Acín-Peréz R, Geghman KD, et al. Pink1 regulates the oxidative phosphorylation machinery via mitochondrial fission. Proc Natl Acad Sci, USA. 2011;108(31):12920–12924. DOI: 10.1073/pnas.1107332108 [DOI] [PMC free article] [PubMed] [Google Scholar]
- [19].Sliter DA, Martinez J, Hao L, et al. Parkin and PINK1 mitigate STING-induced inflammation. Nature. 2018;561(7722):258–262. DOI: 10.1038/s41586-018-0448-9 [DOI] [PMC free article] [PubMed] [Google Scholar] [Retracted]
- [20].Pickrell AM, Youle RJ. The roles of PINK1, parkin, and mitochondrial fidelity in Parkinson’s disease. Neuron. 2015. Jan 21;85(2):257–273. [DOI] [PMC free article] [PubMed] [Google Scholar]
- [21].Jankovic J, Tan EK. Parkinson’s disease: etiopathogenesis and treatment. J Neurol Neurosurg Psychiatry. 2020;91(8):795–808. [DOI] [PubMed] [Google Scholar]
- [22].Majbour N, Aasly J, Abdi I, et al. Disease-associated α-Synuclein aggregates as biomarkers of Parkinson disease clinical stage. Neurology. 2022;99(21):e2417–2427. DOI: 10.1212/WNL.0000000000201199 [DOI] [PMC free article] [PubMed] [Google Scholar]
- [23].Saiki S, Sasazawa Y, Fujimaki M, et al. A metabolic profile of polyamines in parkinson disease: a promising biomarker. Ann Neurol. 2019;86(2):251–263. DOI: 10.1002/ana.25516 [DOI] [PMC free article] [PubMed] [Google Scholar]
- [24].Tolosa E, Garrido A, Scholz SW, et al. Challenges in the diagnosis of Parkinson’s disease. Lancet Neurol. 2021;20(5):385–397. DOI: 10.1016/S1474-4422(21)00030-2 [DOI] [PMC free article] [PubMed] [Google Scholar]
- [25].Lou G, Palikaras K, Lautrup S, et al. Mitophagy and neuroprotection. Trends Mol Med. 2020;26(1):8–20. DOI: 10.1016/j.molmed.2019.07.002 [DOI] [PubMed] [Google Scholar]
- [26].Kalia LV, Lang AE. Parkinson’s disease. Lancet. 2015;386(9996):896–912. [DOI] [PubMed] [Google Scholar]
- [27].Lin G, Lee P-T, Chen K, et al. Phospholipase PLA2G6, a Parkinsonism-Associated gene, affects Vps26 and Vps35, retromer function, and ceramide levels, similar to α-Synuclein gain. Cell Metab. 2018;28(4):605–618.e6. DOI: 10.1016/j.cmet.2018.05.019 [DOI] [PubMed] [Google Scholar]
- [28].Nicholl DJ, Vaughan JR, Khan NL, et al. Two large British kindreds with familial Parkinson’s disease: a clinico-pathological and genetic study. Brain. 2002;125(Pt 1):44–57. DOI: 10.1093/brain/awf013 [DOI] [PubMed] [Google Scholar]
- [29].Yoshino H, Tomiyama H, Tachibana N, et al. Phenotypic spectrum of patients with PLA2G6 mutation and PARK14-linked parkinsonism. Neurology. 2010;75(15):1356–1361. DOI: 10.1212/WNL.0b013e3181f73649 [DOI] [PubMed] [Google Scholar]
- [30].Kinghorn KJ, Castillo-Quan JI, Bartolome F, et al. Loss of PLA2G6 leads to elevated mitochondrial lipid peroxidation and mitochondrial dysfunction. Brain. 2015;138(Pt 7):1801–1816. DOI: 10.1093/brain/awv132 [DOI] [PMC free article] [PubMed] [Google Scholar]
- [31].Matsuda N, Sato S, Shiba K, et al. PINK1 stabilized by mitochondrial depolarization recruits Parkin to damaged mitochondria and activates latent Parkin for mitophagy. J Cell Biol. 2010;189(2):211–221. DOI: 10.1083/jcb.200910140 [DOI] [PMC free article] [PubMed] [Google Scholar]
- [32].Narendra DP, Jin SM, Tanaka A, et al. PINK1 is selectively stabilized on impaired mitochondria to activate Parkin. PLoS Biol. 2010;8(1):e1000298. DOI: 10.1371/journal.pbio.1000298 [DOI] [PMC free article] [PubMed] [Google Scholar]
- [33].Lazarou M, Jin SM, Kane LA, et al. Role of PINK1 binding to the TOM complex and alternate intracellular membranes in recruitment and activation of the E3 ligase Parkin. Dev Cell. 2012;22(2):320–333. DOI: 10.1016/j.devcel.2011.12.014 [DOI] [PMC free article] [PubMed] [Google Scholar]
- [34].Okatsu K, Uno M, Koyano F, et al. A dimeric PINK1-containing complex on depolarized mitochondria stimulates Parkin recruitment. J Biol Chem. 2013;288(51):36372–36384. DOI: 10.1074/jbc.M113.509653 [DOI] [PMC free article] [PubMed] [Google Scholar]
- [35].Kristensen LS, Andersen MS, Stagsted LVW, et al. The biogenesis, biology and characterization of circular RNAs. Nat Rev Genet. 2019;20(11):675–691. DOI: 10.1038/s41576-019-0158-7 [DOI] [PubMed] [Google Scholar]
- [36].Mo Y, Wang Y, Wang Y, et al. Circular RNA circPVT1 promotes nasopharyngeal carcinoma metastasis via the β-TrCP/c-Myc/SRSF1 positive feedback loop. Mol Cancer. 2022. Oct 5;21(1):192. [DOI] [PMC free article] [PubMed] [Google Scholar]
- [37].Zeng Z, Xia L, Fan S, et al. Circular RNA CircMAP3K5 acts as a MicroRNA-22-3p sponge to promote resolution of intimal hyperplasia via TET2-Mediated smooth muscle cell differentiation. Circulation. 2021;143(4):354–371. DOI: 10.1161/CIRCULATIONAHA.120.049715 [DOI] [PubMed] [Google Scholar]
- [38].Chen L-L. The expanding regulatory mechanisms and cellular functions of circular RNAs. Nat Rev Mol Cell Biol. 2020;21(8):475–490. [DOI] [PubMed] [Google Scholar]
- [39].Valente EM, Abou-Sleiman PM, Caputo V, et al. Hereditary early-onset Parkinson’s disease caused by mutations in PINK1. Science. 2004;304(5674):1158–1160. DOI: 10.1126/science.1096284 [DOI] [PubMed] [Google Scholar]
- [40].Lizama BN, Chu CT. Neuronal autophagy and mitophagy in Parkinson’s disease. Mol Aspects Med. 2021;82:100972. [DOI] [PMC free article] [PubMed] [Google Scholar]
- [41].Pilsl A, Winklhofer KF. Parkin, PINK1 and mitochondrial integrity: emerging concepts of mitochondrial dysfunction in Parkinson’s disease. Acta Neuropathol. 2012;123(2):173–188. [DOI] [PubMed] [Google Scholar]
- [42].Eldeeb MA, Thomas RA, Ragheb MA, et al. Mitochondrial quality control in health and in Parkinson’s disease. Physiol Rev. 2022;102(4):1721–1755. DOI: 10.1152/physrev.00041.2021 [DOI] [PubMed] [Google Scholar]
- [43].Luan J, Jiao C, Kong W, et al. CircHLA-C plays an important role in lupus nephritis by sponging miR-150. Mol Ther Nucleic Acids. 2018;10:245–253. [DOI] [PMC free article] [PubMed] [Google Scholar]
- [44].Jiang MJ, Chen YY, Dai JJ, et al. Dying tumor cell-derived exosomal miR-194-5p potentiates survival and repopulation of tumor repopulating cells upon radiotherapy in pancreatic cancer. Mol Cancer. 2020. Mar 30;19(1):68. [DOI] [PMC free article] [PubMed] [Google Scholar]
- [45].Wei Y, Lu M, Mei M, et al. Pyridoxine induces glutathione synthesis via PKM2-mediated Nrf2 transactivation and confers neuroprotection. Nat Commun. 2020;11(1):941. DOI: 10.1038/s41467-020-14788-x [DOI] [PMC free article] [PubMed] [Google Scholar]
- [46].Fang Y, Jiang Q, Li S, et al. Opposing functions of β-arrestin 1 and 2 in Parkinson’s disease via microglia inflammation and Nprl3. Cell Death Differ. 2021;28(6):1822–1836. DOI: 10.1038/s41418-020-00704-9 [DOI] [PMC free article] [PubMed] [Google Scholar]
- [47].Gaven F, Marin P, Claeysen S. Primary culture of mouse dopaminergic neurons. J Vis Exp. 2014;91:e51751. DOI: 10.3791/51751 [DOI] [PMC free article] [PubMed] [Google Scholar]
- [48].Chinta SJ, Andersen JK. Dopaminergic neurons. Int J Biochem Cell Biol. 2005;37(5):942–946. [DOI] [PubMed] [Google Scholar]
- [49].Han X, Sun S, Sun Y, et al. Small molecule-driven NLRP3 inflammation inhibition via interplay between ubiquitination and autophagy: implications for Parkinson disease. Autophagy. 2019;15(11):1860–1881. DOI: 10.1080/15548627.2019.1596481 [DOI] [PMC free article] [PubMed] [Google Scholar]
- [50].Brichta L, Shin W, Jackson-Lewis V, et al. Identification of neurodegenerative factors using translatome-regulatory network analysis. Nat Neurosci. 2015;18(9):1325–1333. DOI: 10.1038/nn.4070 [DOI] [PMC free article] [PubMed] [Google Scholar]
- [51].Gao H-M, Zhang F, Zhou H, et al. Neuroinflammation and α-synuclein dysfunction potentiate each other, driving chronic progression of neurodegeneration in a mouse model of Parkinson’s disease. Environ Health Perspect. 2011;119(6):807–814. DOI: 10.1289/ehp.1003013 [DOI] [PMC free article] [PubMed] [Google Scholar]
Associated Data
This section collects any data citations, data availability statements, or supplementary materials included in this article.
Supplementary Materials
Data Availability Statement
All data needed to evaluate the conclusions in the paper are present in the paper and/or the Supplementary Materials. Additional data related to this paper may be requested from the authors.