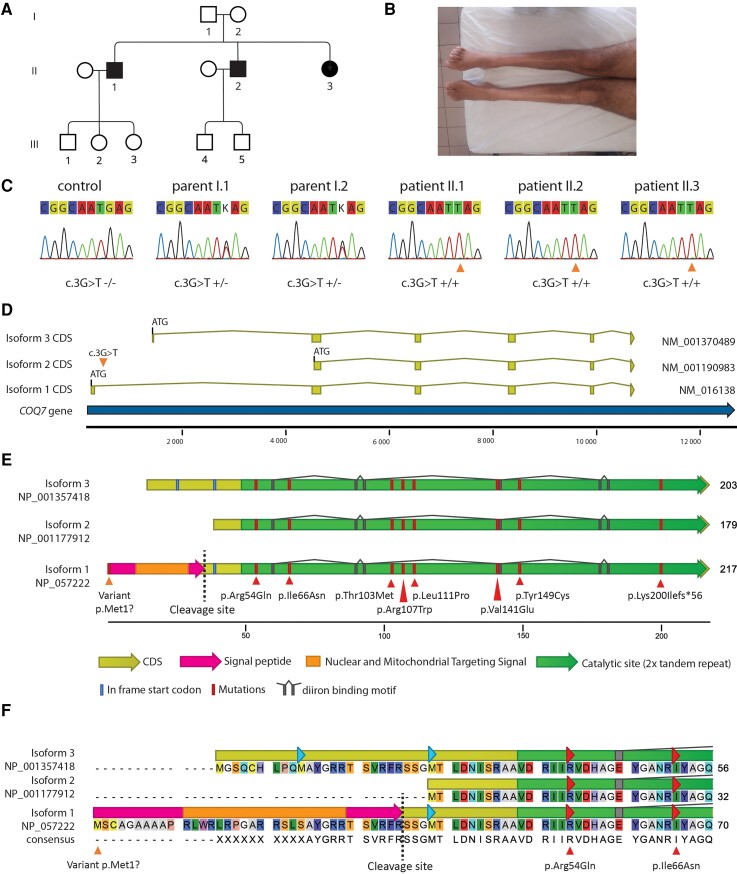
Figure 1.
Presentation of the family and COQ7 protein. (A) Pedigree of the family. Squares are males and circles are females. Filled symbols represent affected subjects and empty symbols unaffected subjects (B) Amyotrophy of Patient II-2 legs. (C) Sanger sequencing confirmation of the genotypes. (D) Schematic representations of the different isoforms showing the three possible ATG start codons. The orange triangle shows the point mutation c.3G>T on isoform 1 (NM_016138.5), which is the main isoform expressed in the spinal cord. (E) Schematic representation of the three COQ7 isoforms aligned on the major isoform 1 (NP_057222.2). Isoform 1 is composed of 217 AA, including a 35-AA signal peptide which will be cleaved, and a 182-AA mature protein. Isoforms 2 and 3 are respectively composed of 179 and 203 AA. The variant from the patients is localized in the isoform 1 start codon (orange triangle), leading to the disruption of this codon. Other pathogenic mutations previously described are localized within the catalytic site (red triangle). Translation of the coding DNA sequence (CDS) is in yellow. The nuclear and mitochondrial targeting signal in the isoform 1 signal peptide is in orange. The cleavage site of the mitochondrial processing peptidase is shown by a dashed line. The diiron binding site of the catalytic domain is in grey. In-frame start codons are in blue. (F) COQ7 isoform alignment showing the variable AA in the N-terminal region.

