Figure 4.
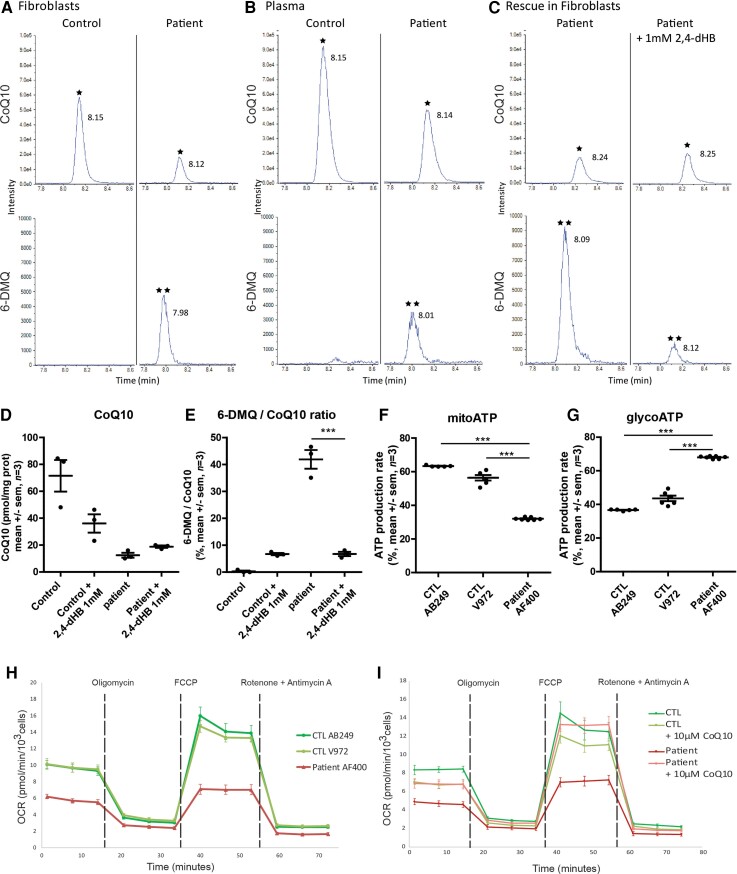
Metabolic changes in the patient’s plasma and fibroblasts. Representative HPLC-MS/MS chromatograms for the detection of CoQ10 and 6-DMQ (A) in fibroblasts, (B) in the plasma of healthy controls and Patient II-2, and (C) in the patient’s fibroblasts treated with 1 mM 2,4-dHB. The top chromatogram represents the detected signal for CoQ10 (indicated by asterisk) and the bottom chromatogram represents the detected signal for 6-DMQ (indicated by double asterisk). (D and E) Graphical representation of the rescue of CoQ10 and 6-DMQ levels by 1 mM 2,4-dHB in the patient’s fibroblasts (one-way ANOVA followed by Bonferroni tests ***P < 0.001; n = 3). (F and G) Graphical representation of ATP production by mitochondrial respiration (mitoATP) and glycolysis (glycoATP) measured in real-time using the Seahorse Bioscience Extracellular Flux Analyzer on control (#AB249 and #V972) or patient’s (#AF400) fibroblasts (one-way ANOVA followed by Bonferroni tests ***P < 0.001; n = 3). (H) Seahorse Mitostress analysis. OCR traces, expressed as pmol O2/min/103 cells of fibroblast cell lines from the patient and controls. The dashed lines indicate the time of addition of oligomycin, FCCP, and antimycin A/rotenone. The OCR profile is representative of three independent experiments. (I) Effect of 10 μM CoQ10 supplementation on OCR traces of fibroblast cell lines from the patient and control. The OCR profile is representative of three independent experiments.

