

We report on limited variation in the thermal physiology of intertidal gastropods that underwent an evolutionary transition from warm rocky shores to cool mangroves. Thermal adaptation of these gastropods centres on heat tolerance, which becomes redundant in the mangrove species. This finding carries implications for conservation management and predicting species responses to climate warming.
Keywords: ecophysiology, gastropod, heat tolerance, thermal performance curve
Abstract
Predictions for animal responses to climate warming usually assume that thermal physiology is adapted to present-day environments, and seldom consider the influence of evolutionary background. Little is known about the conservation of warm-adapted physiology following an evolutionary transition to a cooler environment. We used cardiac thermal performance curves (cTPCs) of six neritid gastropod species to study physiological thermal trait variation associated with a lineage transition from warmer rocky shores to cooler mangroves. We distinguished between functional thermal performance traits, related to energy homeostasis (slope gradient, slope curvature, HRmax, maximum cardiac activity and Topt, the temperature that maximizes cardiac activity) and a trait that limits performance (ULT, the upper lethal temperature). Considering the theory of optimal thermal performance, we predicted that the functional traits should be under greater selective pressure to change directionally and in magnitude than the thermal limit, which is redundant in the cooler environment. We found little variation in all traits across species, habitats and ecosystems, despite a ~20°C reduction in maximum habitat temperature in the mangrove species over 50 million years. While slope gradient was significantly lowered in the mangrove species, the effect difference was negated by greater thermal plasticity in the rocky shore species. ULT showed the least variation and suggested thermal specialization in the warmest habitat studied. The observed muted variation of the functional traits among the species may be explained by their limited role in energy acquisition and rather their association with heat tolerance adaptation, which is redundant in the mangrove species. These findings have implications for the conservation of habitat of intertidal gastropods that transition to cooler environments. Furthermore, they highlight the significance of evolutionary history and physiological conservation when predicting species responses to climate change.
Introduction
Predicting how animals should respond to climate warming is a challenge for evolutionary and environmental biologists (Huey et al., 2009, 2012; Terblanche et al., 2011; Sunday et al., 2012; Pacifici et al., 2015; Huey and Kingsolver, 2019). Extensive consideration has been given to describing the thermal regimes of species, and determining behavioural and physiological responses to temperature change (Angilletta, 2009). While behavioural thermoregulation (the capability of ectothermic animals to modify their body temperature in response to acutely varying habitat temperature) and thermal acclimation (lifetime phenotypic changes) complicate understanding, these concepts are relatively well studied (Angilletta, 2009). Furthermore, using fundamental thermal niche theory, researchers have modelled spatial habitat temperatures and organismal body temperatures to understand likely future species distributions (Huey and Stevenson, 1979; Huey and Kingsolver, 1989; Huey et al., 2012). Importantly, however, most approaches and frameworks assume that observed physiological performances and tolerances directly relate to thermal adaptation to contemporary environmental conditions (Huey and Kingsolver, 1989; Angilletta, 2009; Muñoz et al., 2014; Sinclair et al., 2016; Bodensteiner et al., 2021). Very few studies have considered the influence of evolutionary histories of species and ancestral climates on thermal performance (see Bennett et al., 2021). Trait canalization, whereby physiological phenotypes are insensitive to environmental change, arises when selection pressure to change is weak (Flatt, 2005). Canalization is seen in lineages that evolved in hot paleoclimates and have subsequently undergone ecological transitions to cooler habitats (see Flatt, 2005; Polgar et al., 2015). We investigated change in the thermal physiology of closely-related, tropical intertidal gastropod species following a transition from a warmer rocky shore to a cooler mangrove environment.
Neritid snails are abundant and diverse in tropical intertidal zones (Marshall et al., 2015). Phylogenetic analyses suggest that the contemporary species of this family have a common rocky shore ancestor, from which they have diversified and transitioned on multiple occasions over 50–100 million years to nutrient-rich mangrove ecosystems (Fig. 1; Frey and Vermeij, 2008; Frey, 2010; Marshall et al., 2015; Wang et al., 2019; Feng et al., 2020, 2021). At least 16 species occur on the shorelines of Brunei, with Nerita undata Linnaeus, 1758, Nerita chamaeleon Linnaeus, 1758 and Nerita albicilla Linnaeus, 1758, being abundant in rocky shore habitats, and Nerita planospira Anton, 1838, Nerita balteata Reeve, 1855 and Neripteron violaceum Gmelin, 1791, being abundant in mangrove habitats (Fig. 1; Mustapha et al., 2021; Mustapha and Marshall, 2021). The rocky-shore snails experience more extreme and variable temperatures, ranging between 27°C and 50°C, whereas local mangrove habitat temperatures (both sunned muddy surfaces or shaded trees) seldom rise above 35°C (Fig. 2; Marshall et al., 2013, 2015). The mangrove species largely experience similar heat loading across habitats (muddy sediment, pneumatophores, shaded trees), whereas heat loading varies among the rocky shore species with vertical distribution in the following order: N. albicilla (low-shore), N. chamaeleon (mid-shore) and Nerita undata (mid-high shore; Figs. 1 and 2; Marshall et al., 2013, 2015).
Figure 1.

(A) The neritid species studied shown in apertural and abapertural view: a. Nerita chamaeleon, b. N. undata, c. N. albicilla, d. Neripteron violaceum, e. N. balteata and f. N. planospira. Scale bars represent 3 mm. (B) An abbreviated phylogeny of the species redrawn from Marshall et al. (2015), showing three independent transitions to mangroves (M). Rocky shore species occurred in the high shore (R/H), mid shore (R/M) and low shore (R/L). Numbers refer to divergence times (mya; Feng et al., 2021). Details of other phylogenies are given in Frey and Vermeij (2008), Frey (2010), Wang et al. (2019) and Feng et al. (2020, 2021).
Figure 2.
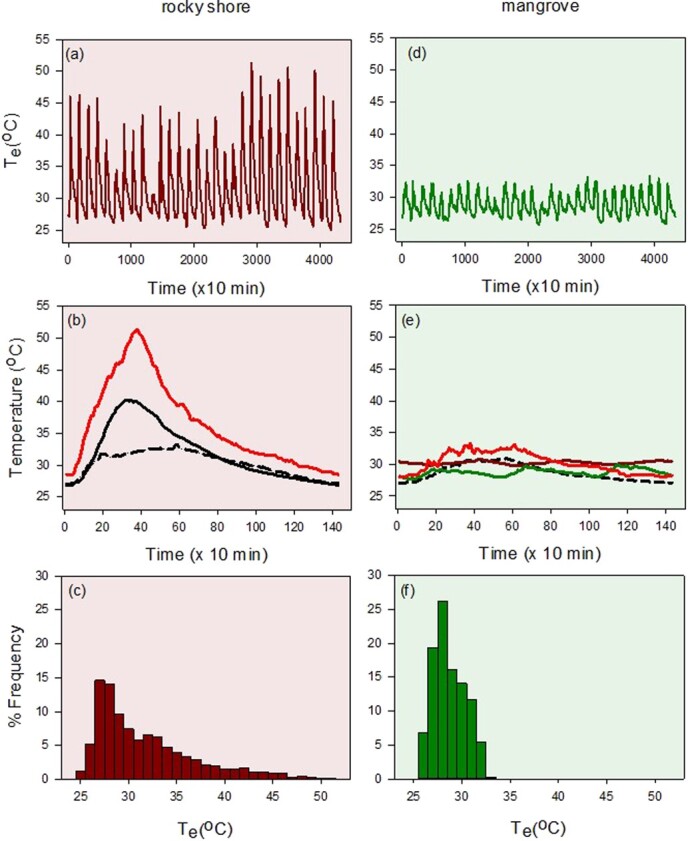
Environmental temperatures experienced by rocky shore and mangrove neritid snails (screened iButtons; Marshall et al., 2015) in Brunei. (a, d) Temperature was recorded every 10 min for 30 days from upper rocky shore (sun-exposed, air) and mangrove trunk (shade, air). (b, e) Daily temperature variation averaged for 30 days for rocky shore, max (red), mean (solid) and shade (dashed) and for mangrove, trunk max (red), trunk mean (dashed), leaf mean (green) and mud mean (brown, tidally influenced). (c, f) Temperature frequency distributions based on (a, d); mean and maximum temperature for the rocky shore were 31.8 and 51.3°C (Δ = 19.5°C), and for mangroves were 27.7 and 33.2°C (Δ = 4.5°C). Water temperatures typically vary between 27 and 30°C.
Physiological and behavioural responses to temperature are complex, but can be described using thermal reaction norms, particularly the well-considered thermal performance curve (TPC; Sinclair et al., 2016). Cardiac activity of marine gastropods indicates organismal physiological capabilities, informs about adaptive capacity, and conveys information about oxygen delivery and cellular energy demand (Marshall and McQuaid, 1992, 2011; Marshall et al., 2011; Chen et al., 2021; Liao et al., 2021). Cardiac thermal performance curves (cTPCs) thus communicate functional aspects of physiology, such as the partitioning of energy to maintenance, growth, reproduction and thermoprotection (capacity adaptation), as well as communicating organismal tolerance (resistance adaptation) (Cossins and Bowler, 1987; Marshall et al., 2011; Marshall and McQuaid, 2011; Liao et al., 2021). Four functional attributes associate with the upslope of a cTPC. Maximum heart rate (HRmax) and the temperature at which heart rate is maximized (Topt) are primary traits, whereas slope gradient and slope curvature represent the interaction of these (Fig. 3a). The slope gradient increases when the thermal breadth contracts during displacement of a cTPC to a cooler thermal range (A versus B in Fig. 3a), but because HRmax is usually simultaneously reduced in cool-adapted marine gastropods (C in Fig. 3a), the slope gradient is often equal to or flatter than that of warm-adapted species (line C to A, Fig. 3a; Monaco et al., 2017). Slope curvature captures heart rate variation at finer thermal increments than slope gradient, and is reduced by both contraction of the thermal breadth (A versus B in Fig. 3a) and depression of HRmax (A versus C in Fig. 3a). Many warm-adapted gastropods depress metabolic and heart rates during acute warming, further enhancing slope curvature (Fig. 3a; Marshall and McQuaid, 2011; Marshall et al., 2011; Liao et al., 2021). The temperature above the Topt that minimizes heart rate during acute warming (the flatline temperature) is synonymous with the upper lethal temperature (ULT;Marshall et al., 2011; Ørsted et al., 2022). Although more broadly framed functional traits, such as activity, growth and development are usually investigated (Chown, 2012; Sinclair et al., 2016; Kellermann et al., 2019), cTPC attributes imply physiological potential to support these higher-level functions. Also, the conventional term, critical thermal maximum (CTmax) inappropriately marks heat tolerance in intertidal gastropods, which cease locomotor activity at temperatures well below the ULT (Monaco et al., 2017).
Figure 3.

Predicted directional changes in cardiac traits with a transition from a warmer to a cooler marine intertidal environment. (a) Hypothetical cTPCs for a warm-adapted snail (A), a cool-adapted snail with Topt displaced towards cooler temperatures (B). (C) A cool-adapted snail with reduced HRmax as is observed in other intertidal gastropods (C). Slope gradient (shown here as a line drawn from HRmin to Topt; blue dashed line) may be similar or reduced and slope curvature is reduced in the cool-adapted snail. (b) The predictions are confirmed by cTPCs for a cool-adapted, low-rocky shore snail (Trochus radiatus; blue) and a hot-adapted, high-shore snail (Echinolittorina vidua; red). ULT is also reduced in the cooler-adapted snail. Data were plotted for two representative individuals from the same rocky shore and curves were fitted using negative exponential smoothing (Sigmaplot ver. 14) after correcting the data to a baseline of 50 BPM (see Monaco et al., 2017).
The above hypothesis for cTPC trait variation for warm and cool adapted animals is founded on the theory for optimality of performance and evolutionary fitness (see Angilletta, 2009). This hypothesis has also been shown to apply to rocky shore snails that inhabit warmer or cooler environments (Fig. 3b; Monaco et al., 2017). In the present study, we used the six above-mentioned snail species (N. undata, N. chamaeleon, N. albicilla, N. planospira, N. balteata and Neript. violaceum) to test the prediction that directional trait change should accompany an eco-evolutionary transition from a warm rocky-shore to a cool mangrove environment. Specifically, we tested whether the values of all of five traits are lowered following this transition (Fig. 3; Monaco et al., 2017). However, because the functional traits (HRmax, slope gradient, curvature and Topt) associate directly with organismal fitness (and impart evolutionary benefit) through energy homeostasis (the aquisition and utilization of energy), we further predicted that they should change more (greater selection strength) than the trait marking the performance limit (ULT), which is essentially redundant in the cooler mangrove environment. In other words, greater benefit should derive from a closer match between the functional physiology and the novel cooler thermal regime in the mangroves (capacity adaptation) than from losing an ancestral adaptation for heat tolerance (resistance adaptation).
The data presented are primarily intended to inform about pattern differences among the habitat-separated snails, rather than about evolutionary mechanisms, such as environmental canalization or evolutionary stasis. Inference on the latter would require information about both genetic and environmental drivers of the phenotypic variation (Burt, 2001; Flatt, 2005; Ellegren, 2010). We use simple terminology, such as trait conservation, where limited or no phenotypic variation is evident (Araújo et al., 2013), and directional selection where the variation is appropriate to the direction of the environmental change (Burt, 2001; Flatt, 2005; Ellegren, 2010; Munoz et al. 2013). We also refer interchangeably to attribute and trait, with reference to a phenotypic feature that interacts with the environment. Such an evolutionary context for physiological trait variation should benefit climate warming frameworks, which usually assume a close match between thermal adaptation and contemporary climatic conditions (Angilletta, 2009).
Materials and Methods
Snail phylogeny and habitat temperatures
Multiple habitat transitions have occurred during the evolution of neritid snails, from rocky shores to mangroves, from lower to upper rocky-intertidal zones, and from hard to soft substrata (mud or sand) in mangrove forests (Frey and Vermeij, 2008; Frey, 2010). A redrawn phylogeny of the study species and their rocky shore ancestry is shown in Fig. 1. Neripteron violaceum, N. planospira and N. balteata represent three independent transitions, and the consensus is that Neript. violaceum is derived from recent freshwater ancestry (Fig. 1; Frey, 2010; Marshall et al., 2015; Wang et al., 2019; Feng et al., 2020, 2021). In all mangrove habitats (shaded trees or shaded or sunned muddy substrata) these snails experience air temperatures of ~25–35°C (Fig. 2; Marshall et al., 2015). On the rocky shores, N. albicilla occurs in the low intertidal zone (~0.5–1.0 m Chart Datum, CD), where it is mostly inundated by seawater and thus experiences temperatures ranging between 26 and 31°C (Marshall and McQuaid, 2020). However, the body temperatures of individuals might occasionally rise above 40°C during longer spring tide air exposures. The mid-shore N. chamaeleon potentially experiences warmer conditions, though this species appears to behaviourally thermoregulate by seeking cool, shaded refuges under boulders when aerially exposed. Body temperatures of this species probably rise to the upper 40°C range (Fig. 2; Marshall et al., 2015). The high-shore N. undata is likely exposed to temperatures approaching 50°C for longer than N. chamaeleon. Whereas the rocky shore temperatures vary diurnally between 25°C and 50°C, the mangrove temperatures are relatively stable, daily and seasonally (Fig. 2; Helmuth and Hofmann, 2001; Marshall et al., 2010, 2015; Denny et al., 2011; Brahim et al., 2019).
Snail collection and laboratory holding
Specimens were collected at low tide from a rocky boulder beach and nearby mangroves in Brunei, between July and December 2017. Nerita chamaeleon, N. undata and N. albicilla were taken from the Empire, along the South China Sea coastline (4.9694°N, 114.8551°E), N. balteata and N. planospira from the mangroves at Pulau Bedukang, Brunei Bay (4.9795°N, 115.0576°E) and Neript. violaceum from mangroves at Sungai Kedayan, a tributary of the Sungai Brunei (4.8981°N, 114.9341°E; Mustapha et al., 2021). More than 15 adult individuals of each species were returned to the laboratory under cool conditions, where they were kept before experiments in an incubator at a constant 27°C on a moist substratum and high humidity for 1–2 days. The experimental snails were thus considered to be field acclimatized.
Additionally, a laboratory temperature-acclimation experiment (common-garden approach) was performed to assess within-individual cTPC trait variation. This experiment used N. undata and Neript. violaceum snails, which represent the most extreme habitat/evolutionary circumstances. Snails collected between Dec 2022 and Mar 2023 were acclimated for 7–9 days in incubators (Memmert Peltier-cooled, IPP400) set for low temperature acclimation (12 h at 27°C and 12 h at 30°C; n = 12 snails) or high temperature acclimation (6 h rising from 27 to 40°C, 6 h falling from 40 to 27°C, and 12 hours at 27°C; n = 12 snails). These thermal regimes represent the natural daily mean temperature variation (Fig. 2). The snails were held in lidded plastic containers under high humidity air and were provided with rocks from their natural environment covered with food substratum (mud/algae). Each day the snails were immersed for 30 mins in estuarine (7–10 psu, Neript. violaceum) or open-sea water (30 psu, N. undata) to simulate tidal effects and prevent dehydration.
cTPC and performance attributes
For the primary experiment, cardiac thermal performance was determined for nine individuals of each species, randomly drawn from the collected snail pool. We used six individuals per species for the acclimation experiment. Although more individuals were originally trialled, clear heart patterns were not always achieved due to weak signals and or internal animal movement. These cases were discarded. Shell lengths of the studied snails (mm, mean ± SD) were, N. chamaeleon (18.5 ± 1.0), N. undata (18.6 ± 1.1), N. albicilla (19.0 ± 0.7), N. balteata (22.6 ± 1.5), N. planospira (19.1 ± 1.1) and Neript. violaceum (14.2 ± 0.9). For the temperature-acclimation experiment, shell lengths were, N. undata (17.5 ± 0.4) and Neript. violaceum (13.5 ± 0.7). Heart rate was measured with optoelectronic infrared sensors adhered to the shells (CNY70, Vishay Semiconductors, Shelton, CT, USA). Signals were amplified, filtered and digitally logged using PowerLab (ADInstruments, Australia) and LabChart 7 (ADInstruments, Australia; Marshall et al., 2011). Sampling rate was set at 40 Hz and amplitude varied between 40 mV and 1000 mV. Heart rates were recorded for snails held in air in plastic bags inside a waterbath that were heated at 0.25°C min−1, between 30°C and 65°C. A similar heating rate is naturally experienced on rocky shores (Marshall et al., 2010, 2011). The waterbath temperature was controlled with a programmable Grant TXF200 (Cambridge, United Kingdom). Snail temperatures were simultaneously recorded using calibrated K-type thermocouples adhered to shells and connected to a TC-08 interface and Picolog (Pico Technology, Cambridge, United Kingdom). Analyses were based on raw heartbeat traces or Triangular Barlett smoothed traces (Marshall et al., 2011). The protocol and procedures employed were ethically reviewed and approved by the Faculty of Science Ethics Committee, Universiti Brunei Darussalam.
Physiological temperature attributes were determined for each snail, either directly from the heart rate data or from mathematical descriptions of the profiles (Fig. 3). Slope gradient, Topt and HRmax were assessed from individual cTPCs fitted with a Sharpe-Schoolfield’s model (Schoolfield et al., 1981). The models were fitted to the data using nonlinear least-squares regressions in the R package, rTPC (Padfield et al., 2021). Sharpe-Schoolfield’s formulation is process-based, with parameters that can be interpreted biologically. We used the activation energy parameter to represent the slope gradient response of each snail. The maximum heart rate estimated for each individual across the entire temperature gradient considered (HRmax) and its associated temperature (Topt) were extracted from the cTPC model fits. The degree of curvature of the upslope (i.e. slope curvature; Fig. 3) was determined based on a second-degree polynomial curve fitted to the upslope section of heart rate vs temperature plots:  , where
  ,
,  and
and  are model coefficients. The second derivative of this equation (i.e. 2 *
  ) provided a ‘curvature parameter’. The upper lethal thermal trait (ULT) was determined from heartbeat flatlining for individuals, which was obtained directly from the recording traces (Fig. 3; Marshall et al., 2010). Notably, while the heartbeat of gastropods sometimes recovers after flatlining following rapid cooling, no studies have shown that snails that have flatlined are capable of emerging from their shells and all typically die within a few days (see also Stenseng et al., 2005; Somero, 2010; Marshall pers. obs.).
Data and statistical analysis
Statistical analyses were done using R (R Core Team, 2019). To test the predictions that the thermal physiological traits should vary to match habitat conditions (between-habitat responses; Fig. 3) and that this variation should be greater in functional traits, we first determined the values for each of the thermal traits (ULT, Topt, HRmax, slope gradient and slope curvature). To examine the effect of habitat on the thermal traits (values averaged by species) while accounting for the species evolutionary relationships, we used a phylogenetic regression analysis and model comparison approach (see Marshall et al., 2015). A phylogenetic tree was built from mitochondrial cytochrome oxidase subunit I sequences retrieved from GenBank (N. albicilla, EU732211; N. bateata, EU732225; N. chamaeleon, EU732227; N. planospira, EU732292; N. violaceum, MZ831953). Sequences were aligned based on the MUSCLE (MUltiple Sequence Comparison by Log- Expectation) algorithm, and the tree was constructed based on Neighbour Joining method using the software MEGA (Tamura et al., 2021). We used the R package caper (Orme et al., 2018) to compute and compare alternative models that made assumptions about the role of phylogeny on the trait responses. We included a ‘star model’ that ignored phylogeny, a Brownian model where phenotypic divergence is proportional to divergence time (phylogenetic signal, λ = 1), and a Pagel model where branch lengths are optimized to maximize the correspondence between phenotypic divergence and divergence time (λ is variable) (Pagel, 1999). To examine within-ecosystem habitat variation, we compared the traits among species for each habitat using generalized linear models (assuming Gaussian error distribution) and Tukey HSD multiple comparison tests. Similarly, for the temperature-acclimation experiment, we examined within-individual trait variation using GLMs followed by Tukey HSD tests. We determined statistical significance based on likelihood-ratio tests, with α = 0.05. For all models, we examined the assumptions of normality and homogeneity of variances visually, based on Normal Q-Q and Residuals vs Fitted Values plots, respectively (Figs S1, S2, S3, S4 andS5).
Although phenotypic variation could reflect greater environmental variation within a habitat, the lack of phenotypic variation implies lack of genetic variation within a population, which influences trait heritability and constrains evolution (Hoffmann and Sgrò, 2011). We calculated the coefficient of variation ( ) across species and habitats:
  , where σ is the standard deviation and μ the mean. The
  of Topt and ULT were calculated using temperature data transformed to units of Kelvin.
Results
The cTPCs were typically unimodal, and generally well captured by Sharpe-Schoolfield’s models. However, individuals of some species (N chamaeleon, N. undata, N. planospira and N. balteata) showed greater flattening of this curve over the lower temperature range (< 40°C) compared with others (N. albicilla and Neript. violaceum) (Fig. 4). Mean maximum heart rate (HRmax) varied across the species between 108 and 151 bpm (Fig. 5).
Figure 4.

Variability on cTPC described using the Sharpe-Schoolfield’s model for rocky shore snails (a = N. undata, c = N. chamaeleon and e = N. albicilla) and mangrove snails (b = N. planospira, d = N. balteata and f = Neript. violaceum). Dotted and dashed vertical lines represent mean (± SD, shaded area) values of Topt and mean ULT, respectively. n = 9 snails for each species. Arrows indicate thresholds for temperature-insensitive heart rate responses by some individuals.
Figure 5.

Physiological thermal traits estimated from TPCs (heart rate versus temperature) for three rocky shore and three mangrove neritid snail species. (a) and (b) Slope parameter of the relationship between heart rate (log2-transformed) and temperature for the up-slope section of the curves (i.e. temperatures < Topt). (c) Optimal temperatures (Topt). (d) Upper lethal temperature (ULT). (e) Maximum heart rate (HRmax). The slope gradient and Topt represent sub-lethal traits, while ULT is the lethal physiological limit. Different letters above the boxes indicate habitat-specific differences among species.
Regarding the between-habitat comparisons, we found that slope gradient was higher for rocky shore than mangrove species (P = 0.04, Fig. 5, Tables 1, 2). All other thermal traits were independent of habitat (Tables 1, 2). The model comparison approach also revealed that the phylogenetic signal was important for describing the slope gradient (wAICc = 0.56), the slope curvature (wAICc = 0.52), and Topt (wAICc = 0.52) (Table 1). In contrast, the top-ranked models for HRmax and ULT did not include a phylogenetic signal (λ = 0). The Pagel models, where the phylogenetic signal (λ) is estimated, were poorly supported (wAICc = 0, Table 1).
Table 1.
Comparison between linear regression models describing the effect of habitat on three cTPC traits
| Model | Statistics | Phylogenetic signal λ | AICc | wAICc |
|---|---|---|---|---|
| Slope gradient ~ habitat | t6 = 2.84, P = 0.04 | 0 | 9.10 | 0.44 |
| Slope gradient ~ habitat | t6 = 2.84, P = 0.00 | 0.95 | 37.43 | 0.00 |
| Slope gradient ~ habitat | t6 = 2.84, P = 0.04 | 1 | 8.62 | 0.56* |
| Slope curvature ~ habitat | t6 = −0.57, P = 0.60 | 0 | 20.73 | 0.48 |
| Slope curvature ~ habitat | t6 = −0.99, P = 0.38 | < 0.001 | 50.54 | 0.00 |
| Slope curvature ~ habitat | t6 = −0.90, P = 0.42 | 1 | 20.56 | 0.52* |
| HRmax ~ habitat | t6 = 2.07, P = 0.11 | 0 | 50.98 | 0.56* |
| HRmax ~ habitat | t6 = 0.70, P = 0.52 | < 0.001 | 78.27 | 0.00 |
| HRmax ~ habitat | t6 = 2.18, P = 0.09 | 1 | 51.48 | 0.44 |
| Topt ~ habitat | t6 = 0.65, P = 0.56 | 0 | 34.91 | 0.48 |
| Topt ~ habitat | t6 = 0.16, P = 0.88 | < 0.001 | 64.19 | 0.00 |
| Topt ~ habitat | t6 = 0.54, P = 0.62 | 1 | 34.72 | 0.52* |
| ULT ~ habitat | t6 = 0.96, P = 0.39 | 0 | 42.00 | 0.53* |
| ULT ~ habitat | t6 = 1.48, P = 0.21 | < 0.001 | 71.93 | 0.00 |
| ULT ~ habitat | t6 = 0.59, P = 0.58 | 1 | 42.23 | 0.47 |
Table 2.
Summary of relative responses of cTPC traits
| Trait type | Trait | Ecosystem comparison | Species comparison | |
|---|---|---|---|---|
| Functional | Slope gradient | RS > M | Nu = Nc = Na | Np = Nb = Nv |
| Slope curvature | RS = M | Nu < Nc > Na | Nb > Nv = Np; Nb = Np |
|
| HRmax | RS = M | Nu > Nc = Na | Np = Nb = Nv | |
| Topt | RS = M | Nu = Nc > Na | Np = Nb > Nv | |
| Lethal limit | ULT | RS = M | Nu > Nc = Na | Nb > Np > Nv |
Habitat-specific models (between-species responses) revealed significant differences (linear models; P < 0.05 for all tests except slope gradient for rocky shore and HRmax for mangrove), with relatively similar patterns across traits (Fig. 5). For the rocky shore, attribute values were typically higher for N. undata and lowest for N. albicilla. N. chamaeleon was generally intermediate, although it showed the highest slope curvature. For mangrove species, values were typically higher for N. planospira and N. balteata, and lowest for Neript. violaceum (Fig. 5).
The acclimation experiment revealed a minimal influence of acclimation temperature on the traits for both the rocky shore and the mangrove species considered, N. undata and Neript. violaceum (Figs 6 and7). The only significant effect identified suggests a slightly higher ULT for the mangrove species acclimated to a cool than warm temperature (mean ± SD = 51.3 ± 1.0 and 50.1 ± 0.52°C, respectively; LRT, χ2 = 6.36, df = 1, P = 0.012; Fig. 7d). The temperature acclimation experiment also allowed comparing the traits between cool- and warm-acclimated, and field-fresh (primary experiment) individuals of N. undata and Neript. violaceum. For N. undata, we found that ULT of field-fresh individuals was slightly higher than that of cool- (LRT, χ2 = 11.31, df = 2, P = 0.004; Tukey HSD, P < 0.001) and warm-acclimated (Tukey HSD, P < 0.001) animals. The HRmax of field-fresh N. undata was extraordinarily higher than that of cold- (LRT, χ2 = 41.77, df = 2, P < 0.001; Tukey HSD, P < 0.001) and warm-acclimated ones (Tukey HSD, P < 0.001; see also Figs 4 and6). The slope gradient, slope curvature and Topt were unaffected by acclimation (Tukey HSD, P > 0.05 in every case). For Neript. violaceum we found that acclimation treatments modified the trait values, relative to those of field-fresh individuals. The slope gradient was higher for field-fresh than hot-acclimated animals (LRT, χ2 = 9.50, df = 2, P = 0.008; Tukey HSD, P = 0.007). The slope curvature (LRT, χ2 = 8.70, df = 2, P = 0.013; Tukey HSD, P = 0.009) and Topt (LRT, χ2 = 10.26, df = 2, P = 0.006; Tukey HSD, P = 0.005) were higher for field-fresh than hot-acclimated animals. In turn, the ULT and HRmax of field fresh Neript. violaceum were higher than for both cool- (ULT; LRT, χ2 = 90.82, df = 2, P < 0.001; Tukey HSD, P < 0.001; HRmax; LRT, χ2 = 36.22, df = 2, P < 0.001; Tukey HSD, P < 0.001) and hot-acclimated individuals (ULT; Tukey HSD, P < 0.001; HRmax; Tukey HSD, P < 0.001).
Figure 6.

Acclimation experiment. Variability on cTPC described using the Sharpe-Schoolfield’s model for a rocky shore snail (Nerita undata) and a mangrove snail (Neripteron violaceum) acclimated to cool and hot temperature treatments. Dotted and dashed vertical lines represent mean (±SD, shaded area) values of Topt and mean ULT, respectively. n = 6 snails for each species.
Figure 7.

Acclimation experiment. Physiological thermal traits estimated from TPCs (heart rate versus temperature) for a rocky shore (N. undulata) and a mangrove neritid (Neript. violaceum) snail species acclimated to hot and cool temperature treatment. (a) Slope gradient and (b) slope curvature parameters of the relationship between heart rate and temperature for the up-slope section of the curves (i.e. temperatures < Topt). (c) Optimal temperatures (Topt). (d) Upper lethal temperature (ULT). (e) Maximum heart rate (HRmax). The slope gradient, slope curvature and Topt represent sublethal traits, while ULT is the lethal physiological limit. Different letters above the boxes indicate habitat-specific differences between species.
Regarding between- and within-trait variability, the least variable thermal attributes across habitats were ULT (CV; mean ± SD = 0.955 ± 0.292) and Topt (CV; mean ± SD = 2.19 ± 0.88), followed by the HRmax (CV; mean ± SD = 12.6 ± 2.28) and the slope gradient (CV; mean ± SD = 19.2 ± 7.11) (Fig. 8). The slope curvature was the most variable thermal trait (CV; mean ± SD = 91.1 ± 42.4). This hierarchy was consistent for both habitats (Figs 5 and8; Table 2). The observation that the lethal trait ULT was the least variable among individuals suggests constrained selection of this trait.
Figure 8.

Coefficient of variation ( ) of the sub-lethal (i.e. Topt), lethal (i.e. ULT) and performance (i.e. slope gradient, slope curvature, and HRmax) thermal traits of three rocky shore and three mangrove neritid gastropod species.
Discussion
Neritid snails that evolutionarily transitioned to cool mangrove environments and currently experience vastly cooler habitat temperatures were found to differ little in thermal physiology from their warmer rocky shore counterparts. Our analysis accounting for phylogenetic relatedness, showed limited difference in most cTPC traits between the intertidal ecosystems (Table 1). Slope gradient was an outlier, such that the mangrove species produced flatter slopes than field-fresh rocky shore species during acute experimental warming. Slope flattening of the mangrove species could be seen as a directional change for life in a cooler environment (see Fig. 2). This can be explained as either adaptive selection to better match the thermal physiology with the environmental temperature (Angilletta, 2009), or to reduce the cost of maintaining redundant thermal tolerance traits (Feder and Hofmann, 1999). Alternatively, this may represent a non-adaptive random loss of a plesiomorphy that evolved for life on the thermally more-variable and warmer rocky shores (evolutionary drift). Notably, however, the thermal acclimation experiment showed unique flattening of the otherwise steeper slopes in rocky shore snails. Such thermal plasticity appears to allow individuals to modulate their physiological machinery in favour of homeostasis (energetic cost saving) when resting for long periods under high temperature exposure on rocky shores (Newell, 1969; Newell and Branch, 1980; Marshall and McQuaid, 2011; Marshall et al., 2013).
For each ecosystem separately, the maximum heart rate (HRmax) and optimum temperature for performance (Topt) differed significantly among the species in expected ways relative to habitat temperature variation (Fig. 5). The lowest Topt values were recorded in N. albicilla, which occupies the coolest, lower rocky shore zone, and in Neript. violaceum, which is ancestrally associated with cooler freshwater ecosystems. The unique elevation of maximal heart rate in N. undata coincides with its hot, upper rocky shore occupation (Fig. 5; Monaco et al., 2017). Slope curvature was uninformative across the ecosystems, habitats and species, with no clear pattern emerging. Cardiac rate-temperature relationships of intertidal gastropods are known to deviate from predictions for ectothermic animals in general, due to induced temperature-insensitive metabolic depression when resting (see Fig. 3; Newell, 1969; Newell and Branch, 1980; Marshall et al., 2013; Marshall and McQuaid, 2011; Verberk et al., 2016). This allows for the conservation of energy resources when feeding becomes limited, and is especially common in higher-shore gastropods, which experience severe feeding constraints (due to prolonged inactivity) under extreme heating (Marshall and McQuaid, 2011; Marshall et al., 2013). Initial plateauing of the cTPC was observed in N. undata (one individual), N. chamaeleon (three individuals), N. balteata (three individuals) and N. planospira (four individuals; Figs 3 and5), suggesting the retention of temperature-induced metabolic depression in the mangrove species, despite this having no adaptive benefit to them. Such individual variability in cardiac depression is commonly observed in marine gastropod study cohorts apparently comprising individuals that differ in their instantaneous energy demand (see Marshall and McQuaid, 2011, 2020).
Heat tolerance (ULT) was found to relate to habitat conditions and evolutionary background. While N. undata (the rocky shore species that lives in one of the hottest environments globally; Somero et al., 2017) exhibited the greatest heat tolerance, Neript. violaceum (the mangrove species that underwent a uniquely cool freshwater evolutionary incursion) displayed the lowest heat tolerance. These observations imply thermal specialization in N. undata snails and loss of heat resistance in Neript. violaceum. Although directional selection is likely muted in Neript. violaceum as no obvious benefit is derived from reducing heat tolerance in the cooler mangrove environment, notably, the maintenance of this resistance trait is not without a cost (see above; Feder and Hofmann, 1999). The most closely-related neritid species pair, marking the most recent ecosystem transition, the rocky shore N. chamaeleon and the mangrove N. balteata, present a useful case for comparison. These species have identical heat tolerance capabilities, despite experiencing very different contemporary thermal regimes and ecological divergence over ~40 mya, when global temperatures were ~3°C warmer (Figs 1 and5; Table 2; Feng et al., 2021). The phenotypic variation among individuals of a population indicates the potential for selection (Hoffmann and Sgrò, 2011). The lowest value of the coefficient of variation was recorded for the ULT, suggesting resistance of this trait to change, in compliance with the general pattern found in animal ectotherms (Fig. 8; Araújo et al., 2013).
Our key finding (in the primary experiments) of limited thermal physiological difference between the ecosystems was observed despite not accounting for the potentially confounding effect of acclimatization to the different thermal regimes in the rocky shore and mangrove ecosystems. A separate common-garden experiment (acclimating the species from the most extreme habitats in each ecosystem, N. undata and Neript. violaceum, to rocky shore or mangrove mean temperatures) revealed that cardiac trait values were largely unaffected by laboratory acclimation. The most striking outcome of these experiments was, however, the difference in HRmax between acclimated and field-fresh N. undata snails. This effector of slope gradient was markedly depressed in both cool- (0.75-fold decrease) and warm-acclimated N. undata (0.80-fold decrease) individuals (Figs 5 and7). This could be due to the less than optimal laboratory holding conditions, or snails not being exposed to the higher range of temperatures (> 40°C) commonly experienced on rocky shores. Relatively minor differences were observed between field-fresh and acclimated responses in the mangrove species, Neript. violaceum, suggesting loss of acclimatory capacity in the thermally more stable environment. Overall, the acclimation experiment highlighted the role of thermal plasticity in negating the earlier observation (primary experiment) of slope gradient differences (see above). Despite the preponderance of ectothermic animals to have relatively fixed heat tolerances (ULT; Araújo et al., 2013), the ULTs of tropical intertidal gastropods are often flexible, due to heat-hardening under stressfully high temperatures (usually above mid-40°C; Brahim et al., 2019); However, we found no difference in the ULT of the differently-acclimated snails, for both species, which again probably relates to the relatively benign thermal regimes used in the common-garden experiment (< 40°C).
What do the observed cardiac thermal performance patterns mean in terms of functional adaptation? It is commonly regarded that gastropod cardiac performance mirrors cellular oxygen demand and therefore cTPCs can be interpreted with reference to organismal functionality (Marshall et al., 2011). Such interpretation is, however, complicated here by the different thermal regimes of the ecosystems (Fig. 2), and by the mismatch generally in intertidal gastropods of thermal performances for locomotor activity and physiology (Monaco et al., 2017). Because locomotor activity of intertidal gastropods ceases at temperatures well below those tolerated when resting (CTmax is often by as much as 10°C below the ULT), cardiac performance above the CTmax (typically between 40 and 45°C in tropical species) must be unrelated to energy aquisition (see Monaco et al., 2017; Ørsted et al. 2022). This means that the cardiac activity in the higher thermal range considered here (> 40°C) is primarily associated with energetic support of a heat shock response in the rocky- shore neritid snails, but must be redundant in the mangrove snails that never naturally experience these higher temperatures. Thus, whereas the HRmax and Topt values in the rocky- shore species likely refer to heat tolerance adaptation, in the mangrove species they refer to a non-adaptive thermodynamic effect (Angilletta, 2009). Because the locomotor activity of intertidal gastropods is not only inherently limited by morphology, but is also confined to the narrow and cool temperatures of the range tolerated (Monaco et al., 2017), the role of thermal physiology in enhancing fitness through energy acquisition is likely under weak evolutionary selection. Rather, thermal adaptation relating to the energetics of these gastropods likely mainly concerns energy utilization during inactivity, particularly the servicing of the contrasting demands of conserving energy resources and supporting heat tolerance (i.e., a heat shock response). Notably again, the latter is irrelevant to the mangrove species.
What are the implications of conserved or redundant physiology with respect to species resilience to climate change? Functional thermal redundancy in the neritid snails is further suggested by the magnitude of the temperature difference between the habitats and the ecosystems studied. Habitat thermal regimes can be simply described in terms of mean and extreme temperatures, and most studies suggest that functional physiologies adaptively respond to mean temperature variation (Bozinovic et al., 2011; Barker et al., 2021). The difference in mean temperature between the rocky shore and mangrove ecosystems is only ~4°C, whereas the maximum (extreme) temperatures driving heat tolerance selection vary by as much as ~20°C (Fig. 2). These differences suggest that more frequent and severe heatwaves predicted during warmer climates are more likely to impact neritid snails (and other intertidal snails) through their effect on heat tolerance rather than energetics. Physiological trait conservation and hence mismatching of ULT with environmental temperature, should lead to significant thermal buffering of climate warming by the mangrove species. More specifically, these species should have extended warming tolerance values (WT = ULT minus daily Temax; Deutsch et al., 2008; but also see Clusella-Trullas et al., 2021). These circumstances suggest that the forests could act as thermal refugia for other mangrove gastropods (see Marshall et al., 2015), assuming that the forests themselves are resilient to climate change. The conservation of mangroves forests is crucial for the local existence of such gastropod communities. Additionally, such a mismatch between environmental temperature and heat tolerance presents a caveat in the general use of climate envelope (or species distribution) modelling, which is based on the assumption of adaptation to contemporary thermal niches (Huey et al., 2012).
Conclusions
The thermal physiologies of the neritid snail species were similar and unrelated to habitat temperature variation, following a lineage transition from rocky shores to mangroves. A single cardiac thermal performance parameter (slope gradient) differed between the ecosystems, but this difference was negated when taking into account thermal plasticity. Although we predicted greater ability of functional cTPC traits (capacity) compared with the trait limiting all performance (tolerance), interpretations need to consider the thermal ranges for locomotor performance, as well as the temperatures naturally experienced. Doing so, revealed that the cardiac functional trait responses of these snails, and probably most intertidal gastropods, primarily involve supporting heat tolerance, rather than energy acquisition. These nuanced observations can be insightful, and can guide new approaches to assessing organismal responses to climate change. Interestingly, they contradict a mainstream metaanalytical conclusion that heat tolerance is unrelated to climate ancestry (Bennett et al., 2021). The mismatching of conserved physiologies with novel cooler environments that buffer otherwise lethal climate warming exposure, carries implications for the use of niche modelling to predict species responses to climate warming (Kearney and Porter, 2009). It is important to know how broadly the circumstances outlined in this study extend across taxa and ecosystems, in order for the possible future inclusion of evolutionary information in assessments of global warming responses.
Authorship
All authors wrote the paper, made a substantial direct and intellectual contribution to the work and approved it for publication. Reviewers’ comments led to an improved version of the manuscript.
Competing interests
The authors declare no competing interests.
Funding
This work was supported by Universiti Brunei Darussalam, through a grant to DJM (UBD/RSCH/1.4/FICBF(b)/2021/033).
Data availability
Data will be provided on request to the first author (D.J.M.).
Supplementary Material
Acknowledgements
Huan Chiao Lee helped to format the manuscript. We thank Enrico Rezende for providing the code used in the phylogenetic analysis and Alexandre Lambard for helping to prepare the phylogenetic tree.
Contributor Information
David J Marshall, Environmental and Life Sciences, Faculty of Science, Universiti Brunei Darussalam, Jalan Tungku Link, Gadong, BE1410, Brunei Darussalam.
Nurshahida Mustapha, Environmental and Life Sciences, Faculty of Science, Universiti Brunei Darussalam, Jalan Tungku Link, Gadong, BE1410, Brunei Darussalam.
Cristián J Monaco, IFREMER, IRD, Institut Louis-Malardé, Univ Polynésie française, Tahiti, Polynésie française, EIO, F-98725 Taravao, France.
Supplementary Material
Supplementary material is available at Conservation Physiology online.
References
- Angilletta MJ (2009) Thermal Adaptation: A Theoretical and Empirical Synthesis. Oxford University Press, Oxford, England [Google Scholar]
- Araújo MB, Ferri-Yáñez F, Bozinovic F, Marquet PA, Valladares F, Chown SL (2013) Heat freezes niche evolution. Ecol Lett 16: 1206–1219. 10.1111/ele.12155. [DOI] [PubMed] [Google Scholar]
- Barker C, Monaco CJ, McQuaid CD (2021) Exposure to fluctuating temperature increases thermal sensitivity in two lineages of the intertidal mussel Perna perna. Mar Ecol Prog Ser 668: 85–95. 10.3354/meps13713. [DOI] [Google Scholar]
- Bennett JM, Sunday J, Calosi P, Villalobos F, Martínez B, Molina-Venegas R, Araújo MB, Algar AC, Clusella-Trullas S, Hawkins BAet al. (2021) The evolution of critical thermal limits of life on Earth. Nat Commun 12: 1198. 10.1038/s41467-021-21263-8. [DOI] [PMC free article] [PubMed] [Google Scholar]
- Bodensteiner BL, Agudelo-Cantero GA, Arietta AZA, Gunderson AR, Muñoz MM, Refsnider JM, Gangloff EJ (2021) Thermal adaptation revisited: how conserved are thermal traits of reptiles and amphibians? Journal of Experimental Zoology 335: 173–194. 10.1002/jez.2414. [DOI] [PubMed] [Google Scholar]
- Bozinovic F, Bastías DA, Boher F, Clavijo-Baquet S, Estay SA, Angilletta MJ (2011) The mean and variance of environmental temperature interact to determine physiological tolerance and fitness. Physiol Biochem Zool 84: 543–552. 10.1086/662551. [DOI] [PubMed] [Google Scholar]
- Brahim A, Mustapha N, Marshall DJ (2019) Non-reversible and reversible heat tolerance plasticity in tropical intertidal animals: responding to habitat temperature heterogeneity. Front Physiol 9: 1909. 10.3389/fphys.2018.01909. [DOI] [PMC free article] [PubMed] [Google Scholar]
- Burt DB (2001) Evolutionary stasis, constraint and other terminology describing evolutionary patterns. Biol J Linn Soc 72: 509–517. 10.1111/j.1095-8312.2001.tb01334.x. [DOI] [Google Scholar]
- Chen Y, Wang J, Liao M, Li X, Dong Y (2021) Temperature adaptations of the thermophilic snail Echinolittorina malaccana: insights from metabolomic analysis. J Exp Biol 224: jeb238659. 10.1242/jeb.238659. [DOI] [PubMed] [Google Scholar]
- Chown SL (2012) Trait-based approaches to conservation physiology: forecasting environmental change risks from the bottom up. Philos Trans R Soc B Biol Sci 367: 1615–1627. 10.1098/rstb.2011.0422. [DOI] [PMC free article] [PubMed] [Google Scholar]
- Clusella-Trullas S, Garcia RA, Terblanche JS, Hoffmann AA (2021) How useful are thermal vulnerability indices? Trends Ecol Evol 36: 1000–1010. 10.1016/j.tree.2021.07.001. [DOI] [PubMed] [Google Scholar]
- Cossins AR, Bowler K (1987) Temperature Biology of Animals. Springer, Dordrecht [Google Scholar]
- Denny MW, Dowd WW, Bilir L, Mach KJ (2011) Spreading the risk: small-scale body temperature variation among intertidal organisms and its implications for species persistence. J Exp Mar Biol Ecol 400: 175–190. 10.1016/j.jembe.2011.02.006. [DOI] [Google Scholar]
- Deutsch CA, Tewksbury JJ, Huey RB, Sheldon KS, Ghalambor CK, Haak DC, Martin PR (2008) Impacts of climate warming on terrestrial ectotherms across latitude. Proc Natl Acad Sci 105: 6668–6672. 10.1073/pnas.0709472105. [DOI] [PMC free article] [PubMed] [Google Scholar]
- Ellegren H (2010) Preface. Philos Trans R Soc B Biol Sci 365: 1715. 10.1098/rstb.2010.0041. [DOI] [PMC free article] [PubMed] [Google Scholar]
- Feder ME, Hofmann GE (1999) Heat-shock proteins, molecular chaperones, and the stress response: evolutionary and ecological physiology. Annu Rev Physiol 61: 243–282. 10.1146/annurev.physiol.61.1.243. [DOI] [PubMed] [Google Scholar]
- Feng J, Guo Y, Yan C, Ye Y, Li J, Guo B, Lü Z (2020) Sequence comparison of the mitochondrial genomes in two species of the genus Nerita (Gastropoda: Neritimorpha: Neritidae): phylogenetic implications and divergence time estimation for Neritimorpha. Mol Biol Rep 47: 7903–7916. 10.1007/s11033-020-05870-0. [DOI] [PubMed] [Google Scholar]
- Feng J, Xia L, Yan C, Miao J, Ye YY, Li JJ, Guo BY, Lü ZM (2021) Characterization of four mitochondrial genomes of family Neritidae (Gastropoda: Neritimorpha) and insight into its phylogenetic relationships. Sci Rep 11: 11748. 10.1038/s41598-021-91313-0. [DOI] [PMC free article] [PubMed] [Google Scholar]
- Flatt T (2005) The evolutionary genetics of canalization. Q Rev Biol 80: 287–316. 10.1086/432265. [DOI] [PubMed] [Google Scholar]
- Frey MA (2010) The relative importance of geography and ecology in species diversification: evidence from a tropical marine intertidal snail (Nerita). J Biogeogr 37: 1515–1528. 10.1111/j.1365-2699.2010.02283.x. [DOI] [Google Scholar]
- Frey MA, Vermeij GJ (2008) Molecular phylogenies and historical biogeography of a circumtropical group of gastropods (genus: Nerita): implications for regional diversity patterns in the marine tropics. Mol Phylogenet Evol 48: 1067–1086. 10.1016/j.ympev.2008.05.009. [DOI] [PubMed] [Google Scholar]
- Helmuth BST, Hofmann GE (2001) Microhabitats, thermal heterogeneity, and patterns of physiological stress in the rocky intertidal zone. Biol Bull 201: 374–384. 10.2307/1543615. [DOI] [PubMed] [Google Scholar]
- Hoffmann AA, Sgrò CM (2011) Climate change and evolutionary adaptation. Nature 470: 479–485. 10.1038/nature09670. [DOI] [PubMed] [Google Scholar]
- Huey RB, Deutsch CA, Tewksbury JJ, Vitt LJ, Hertz PE, Álvarez Pérez HJ, Garland T Jr (2009) Why tropical forest lizards are vulnerable to climate warming. Proc R Soc B Biol Sci 276: 1939–1948. 10.1098/rspb.2008.1957. [DOI] [PMC free article] [PubMed] [Google Scholar]
- Huey RB, Kearney MR, Krockenberger A, Holtum JAM, Jess M, Williams SE (2012) Predicting organismal vulnerability to climate warming: roles of behaviour, physiology and adaptation. Philos Trans R Soc B Biol Sci 367: 1665–1679. 10.1098/rstb.2012.0005. [DOI] [PMC free article] [PubMed] [Google Scholar]
- Huey RB, Kingsolver JG (1989) Evolution of thermal sensitivity of ectotherm performance. Trends Ecol Evol 4: 131–135. 10.1016/0169-5347(89)90211-5. [DOI] [PubMed] [Google Scholar]
- Huey RB, Kingsolver JG (2019) Climate warming, resource availability, and the metabolic meltdown of ectotherms. Am Nat 194: E140–E150. 10.1086/705679. [DOI] [PubMed] [Google Scholar]
- Huey RB, Stevenson RD (1979) Integrating thermal physiology and ecology of ectotherms: a discussion of approaches. Am Zool 19: 357–366. 10.1093/icb/19.1.357. [DOI] [Google Scholar]
- Kearney M, Porter W (2009) Mechanistic niche modelling: combining physiological and spatial data to predict species' ranges. Ecol Lett 12: 334–350. 10.1111/j.1461-0248.2008.01277.x. [DOI] [PubMed] [Google Scholar]
- Kellermann V, Chown SL, Schou MF, Aitkenhead I, Janion-Scheepers C, Clemson A, Scott MT, Sgrò CM (2019) Comparing thermal performance curves across traits: how consistent are they? J Exp Biol 222: jeb193433. 10.1242/jeb.193433. [DOI] [PubMed] [Google Scholar]
- Liao M, Li G, Wang J, Marshall DJ, Hui TY, Ma SY, Zhang YM, Helmuth B, Dong YW (2021) Physiological determinants of biogeography: the importance of metabolic depression to heat tolerance. Glob Chang Biol 27: 2561–2579. 10.1111/gcb.15578. [DOI] [PubMed] [Google Scholar]
- Marshall DJ, Baharuddin N, McQuaid CD (2013) Behaviour moderates climate warming vulnerability in high-rocky-shore snails: interactions of habitat use, energy consumption and environmental temperature. Mar Biol 160: 2525–2530. 10.1007/s00227-013-2245-1. [DOI] [Google Scholar]
- Marshall DJ, Dong Y, McQuaid CD, Williams GA (2011) Thermal adaptation in the intertidal snail Echinolittorina malaccana contradicts current theory by revealing the crucial roles of resting metabolism. J Exp Biol 214: 3649–3657. 10.1242/jeb.059899. [DOI] [PubMed] [Google Scholar]
- Marshall DJ, McQuaid CD (1992) Relationship between heart rate and oxygen consumption in the intertidal limpets Patella granularis and Siphonaria oculus. Comp Biochem Physiol A Physiol 103: 297–300. 10.1016/0300-9629(92)90583-C. [DOI] [Google Scholar]
- Marshall DJ, McQuaid CD (2011) Warming reduces metabolic rate in marine snails: adaptation to fluctuating high temperatures challenges the metabolic theory of ecology. Proc R Soc B Biol Sci 278: 281–288. 10.1098/rspb.2010.1414. [DOI] [PMC free article] [PubMed] [Google Scholar]
- Marshall DJ, McQuaid CD (2020) Metabolic regulation, oxygen limitation and heat tolerance in a subtidal marine gastropod reveal the complexity of predicting climate change vulnerability. Front Physiol 11: 1106. 10.3389/fphys.2020.01106. [DOI] [PMC free article] [PubMed] [Google Scholar]
- Marshall DJ, McQuaid CD, Williams GA (2010) Non-climatic thermal adaptation: implications for species’ responses to climate warming. Biol Lett 6: 669–673. 10.1098/rsbl.2010.0233. [DOI] [PMC free article] [PubMed] [Google Scholar]
- Marshall DJ, Rezende EL, Baharuddin N, Choi F, Helmuth B (2015) Thermal tolerance and climate warming sensitivity in tropical snails. Ecol Evol 5: 5905–5919. 10.1002/ece3.1785. [DOI] [PMC free article] [PubMed] [Google Scholar]
- Monaco CJ, McQuaid CD, Marshall DJ (2017) Decoupling of behavioural and physiological thermal performance curves in ectothermic animals: a critical adaptive trait. Oecologia 185: 583–593. 10.1007/s00442-017-3974-5. [DOI] [PubMed] [Google Scholar]
- Muñoz MM, Stimola MA, Algar AC, Conover A, Rodriguez AJ, Landestoy MA, Bakken GS, Losos JB (2014) Evolutionary stasis and lability in thermal physiology in a group of tropical lizards. Proc R Soc B Biol Sci 281: 20132433. 10.1098/rspb.2013.2433. [DOI] [PMC free article] [PubMed] [Google Scholar]
- Mustapha N, Baharuddin N, Tan SK, Marshall DJ (2021) The neritid snails of Brunei Darussalam: their geographical, ecological and conservation significance. Ecologica Montenegrina 42: 45–61. 10.37828/em.2021.42.2. [DOI] [Google Scholar]
- Mustapha N, Marshall DJ (2021) Tracking coastal acidification from erosion of gastropod shells: spatial sensitivity and organism size effect. Environ Monit Assess 193: 690. 10.1007/s10661-021-09479-z. [DOI] [PubMed] [Google Scholar]
- Newell RC (1969) Effect of fluctuations in temperature on the metabolism of intertidal invertebrates. Am Zool 9: 293–307. 10.1093/icb/9.2.293. [DOI] [Google Scholar]
- Newell RC, Branch GM (1980) The influence of temperature on the maintenance of metabolic energy balance in marine invertebrates. Adv Mar Biol 17: 329–396. 10.1016/S0065-2881(08)60304-1. [DOI] [Google Scholar]
- Orme D, Freckleton R, Thomas G, Petzoldt T, Fritz S, Isaac N, Pearse W (2018). Caper: comparative analyses of Phylogenetics and evolution in R_. R package version 1.0.1, <https://CRAN.R-project.org/package=caper>
- Ørsted M, Jørgensen BJ, Johannes Overgaard J (2022) Finding the right thermal limit: a framework to reconcile ecological, physiological and methodological aspects of CTmax in ectotherms. 225. J Exp Biol 225: jeb244514. 10.1242/jeb.244514. [DOI] [PubMed] [Google Scholar]
- Pacifici M, Foden WB, Visconti P, Watson JEM, Butchart SHM, Kovacs KM, Scheffers BR, Hole DG, Martin TG, Akçakaya HRet al. (2015) Assessing species vulnerability to climate change. Nat Climate Change 5: 215–224. 10.1038/nclimate2448. [DOI] [Google Scholar]
- Padfield D, O’Sullivan H, Pawar S (2021) rTPC and nls.Multstart: a new pipeline to fit thermal performance curves in R. Methods Ecol Evol 12: 1138–1143. 10.1111/2041-210X.13585. [DOI] [Google Scholar]
- Pagel M (1999) Inferring the historical patterns of biological evolution. Nature 401: 877–884. 10.1038/44766. [DOI] [PubMed] [Google Scholar]
- Polgar G, Khang TF, Chua T, Marshall DJ (2015) Gross mismatch between thermal tolerances and environmental temperatures in a tropical freshwater snail: climate warming and evolutionary implications. J Therm Biol 47: 99–108. 10.1016/j.jtherbio.2014.11.009. [DOI] [PubMed] [Google Scholar]
- R Core Team (2019) R: A Language and Environment for Statistical Computing. R Foundation for Statistical Computing, Vienna, Austria [Google Scholar]
- Schoolfield RM, Sharpe PJ, Magnuson CE (1981) Non-linear regression of biological temperature-dependent rate models based on absolute reaction-rate theory. J Theor Biol 88: 719–731. 10.1016/0022-5193(81)90246-0. [DOI] [PubMed] [Google Scholar]
- Sinclair BJ, Marshall KE, Sewell MA, Levesque DL, Willett CS, Slotsbo S, Dong Y, Harley CDG, Marshall DJ, Helmuth BSet al. (2016) Can we predict ectotherm responses to climate change using thermal performance curves and body temperatures? Ecol Lett 19: 1372–1385. 10.1111/ele.12686. [DOI] [PubMed] [Google Scholar]
- Somero GN (2010) The physiology of climate change: how potentials for acclimatization and genetic adaptation will determine ‘winners’ and ‘losers’. J Exp Biol 213: 912–920. 10.1242/jeb.037473. [DOI] [PubMed] [Google Scholar]
- Somero GN, Lockwood BL, Tomanek L (2017) Biochemical Adaptation: Responses to Environmental Challenges from Life’s Origins to the Anthropocene. Sinauer Associates, Sunderland, MA, USA [Google Scholar]
- Stenseng E, Braby CE, Somero GN (2005) Evolutionary and acclimation-induced variation in the thermal limits of heart function in congeneric marine snails (genus Tegula): implications for vertical zonation. Biol Bull 208: 138–144. 10.2307/3593122. [DOI] [PubMed] [Google Scholar]
- Sunday JM, Bates AE, Dulvy NK (2012) Thermal tolerance and the global redistribution of animals. Nat Clim Change 2: 686–690. 10.1038/nclimate1539. [DOI] [Google Scholar]
- Tamura K, Stecher G, Kumar S (2021) MEGA11: molecular evolutionary genetics analysis version 11. Mol Biol Evol 38: 3022–3027. 10.1093/molbev/msab120. [DOI] [PMC free article] [PubMed] [Google Scholar]
- Terblanche JS, Hoffmann AA, Mitchell KA, Rako L, Roux PC, Chown SL (2011) Ecologically relevant measures of tolerance to potentially lethal temperatures. J Exp Biol 214: 3713–3725. 10.1242/jeb.061283. [DOI] [PubMed] [Google Scholar]
- Verberk WCEP, Bartolini F, Marshall DJ, Pörtner HO, Terblanche JS, White CR, Giomi F (2016) Can respiratory physiology predict thermal niches? Ann N Y Acad Sci 1365: 73–88. 10.1111/nyas.12876. [DOI] [PubMed] [Google Scholar]
- Wang P, Zhu P, Wu H, Xu Y, Liao Y, Zhang H (2019) The complete mitochondrial genome of Neritina violacea. Mitochondrial DNA Part B 4: 2942–2943. 10.1080/23802359.2019.1662744. [DOI] [PMC free article] [PubMed] [Google Scholar]
Associated Data
This section collects any data citations, data availability statements, or supplementary materials included in this article.
Supplementary Materials
Data Availability Statement
Data will be provided on request to the first author (D.J.M.).