Abstract
Chimeric antigen receptor (CAR) technologies have been clinically implemented for the treatment of hematological malignancies; however, solid tumors remain resilient to CAR therapeutics. Natural Killer (NK) cells may provide an optimal class of immune cells for CAR-based approaches due to their inherent anti-tumor functionality. We sought to tune CAR immune synapses by adding an intracellular scaffolding protein binding site to the CAR. We employ a PDZ binding motif (PDZbm) that enables additional scaffolding crosslinks that enhance synapse formation and NK CAR cell polarization. Combined effects of this CAR design result in increased effector cell functionality in vitro and in vivo. Additionally, we utilize T cells and observe similar global enhancements in effector function. Synapse-tuned CAR immune cells exhibit amplified synaptic strength, number and abundance of secreted cytokines, enhanced killing of tumor cells, and prolonged survival in numerous different tumor models, including solid tumors.
Despite significant advances in CAR-based therapeutics; efficacy against solid tumors has eluded the most cutting-edge designs1–3. CAR technology has been utilized to elicit antigen-dependent signaling pathways in both NK and T cells4. However, CAR:Antigen complexes form disordered synapses5, which do not consist of bona fide central, peripheral, or distal supramolecular activation complexes (SMACs) in contrast to canonical T cell Receptor to Human Leukocyte Antigen (TCR:HLA) synapses5. These organized SMACs allow for a lower threshold for antigen recognition6. Further, the additional signaling molecules recruited to the synapse increase the efficiency of signaling and exclude inhibitory phosphatases7. In contrast, the disjointed CAR synapse is a punctate structure with islands of CAR:Antigen complexes6,8. These islands are, putatively, open to dephosphorylation and thus require a larger number of interactions to initiate downstream signaling and activate effector cells. We theorized that synapse modulation or tuning to an increasingly ordered state would result in an efficient and effective CAR.
To improve CAR synapse formation, we focused on Postsynaptic density-95, Discs large, and Zona occuldens 1 binding moieties (PDZbms). There are roughly 400 proteins that contain PDZ domains, many of these are typically associated with highly polarized epithelial, endothelial, and neuronal cells9. Additionally, there are some PDZbms that aid in the synapse formation and polarity of immune cells10. One of these motif containing proteins, Cytotoxic and Regulatory T cell Associated Molecule (CRTAM) is a binding partner of Scribble10, a PDZ domain containing intracellular scaffolding protein and mainly described in epithelial junctions11. CRTAM to Scribble interactions have been studied in T and NK cells10,12, and CRTAM plays a role in NK cell tumor immunosurveillance13. We, initially, focused our work on NK cells since they have an innate ability to kill tumor cells and contain ~5- to 7-fold more lytic granules compared to T cells14,15. Likewise, NK cells are not known to cause graft versus host disease and tumor cells have a reduced ability to evade attack due to the multiple targeting paradigms that are employed outside of the CAR:Antigen recognition axis16.
RESULTS
PDZbm enhances CAR NK cell synapse signaling
We selected the PDZbm of CRTAM and added it to the C-terminus (CAR.PDZ) of a CD28z CAR (CAR)17, which targets the tyrosine kinase, ephrin type-A receptor 2 (EphA2) or B7-H3, tumor associated antigens expressed in a broad range of solid and brain tumors18,19 (Figure 1a). CAR NK cells were generated from cultured primary peripheral blood NK cells by retroviral transduction and CAR, CAR.PDZ, and a non-functional control CAR (CAR Δ) were expressed equally with no differences on the cell surface of NK cells across numerous donors (Extended Data Figure 1a,b). Additionally, the CAR modifications did not alter the immunophenotype of NK cells (Extended Data Figure 1c).
Figure 1: The PDZ binding moiety scaffolding anchor enhances CAR NK cell synapse formation.
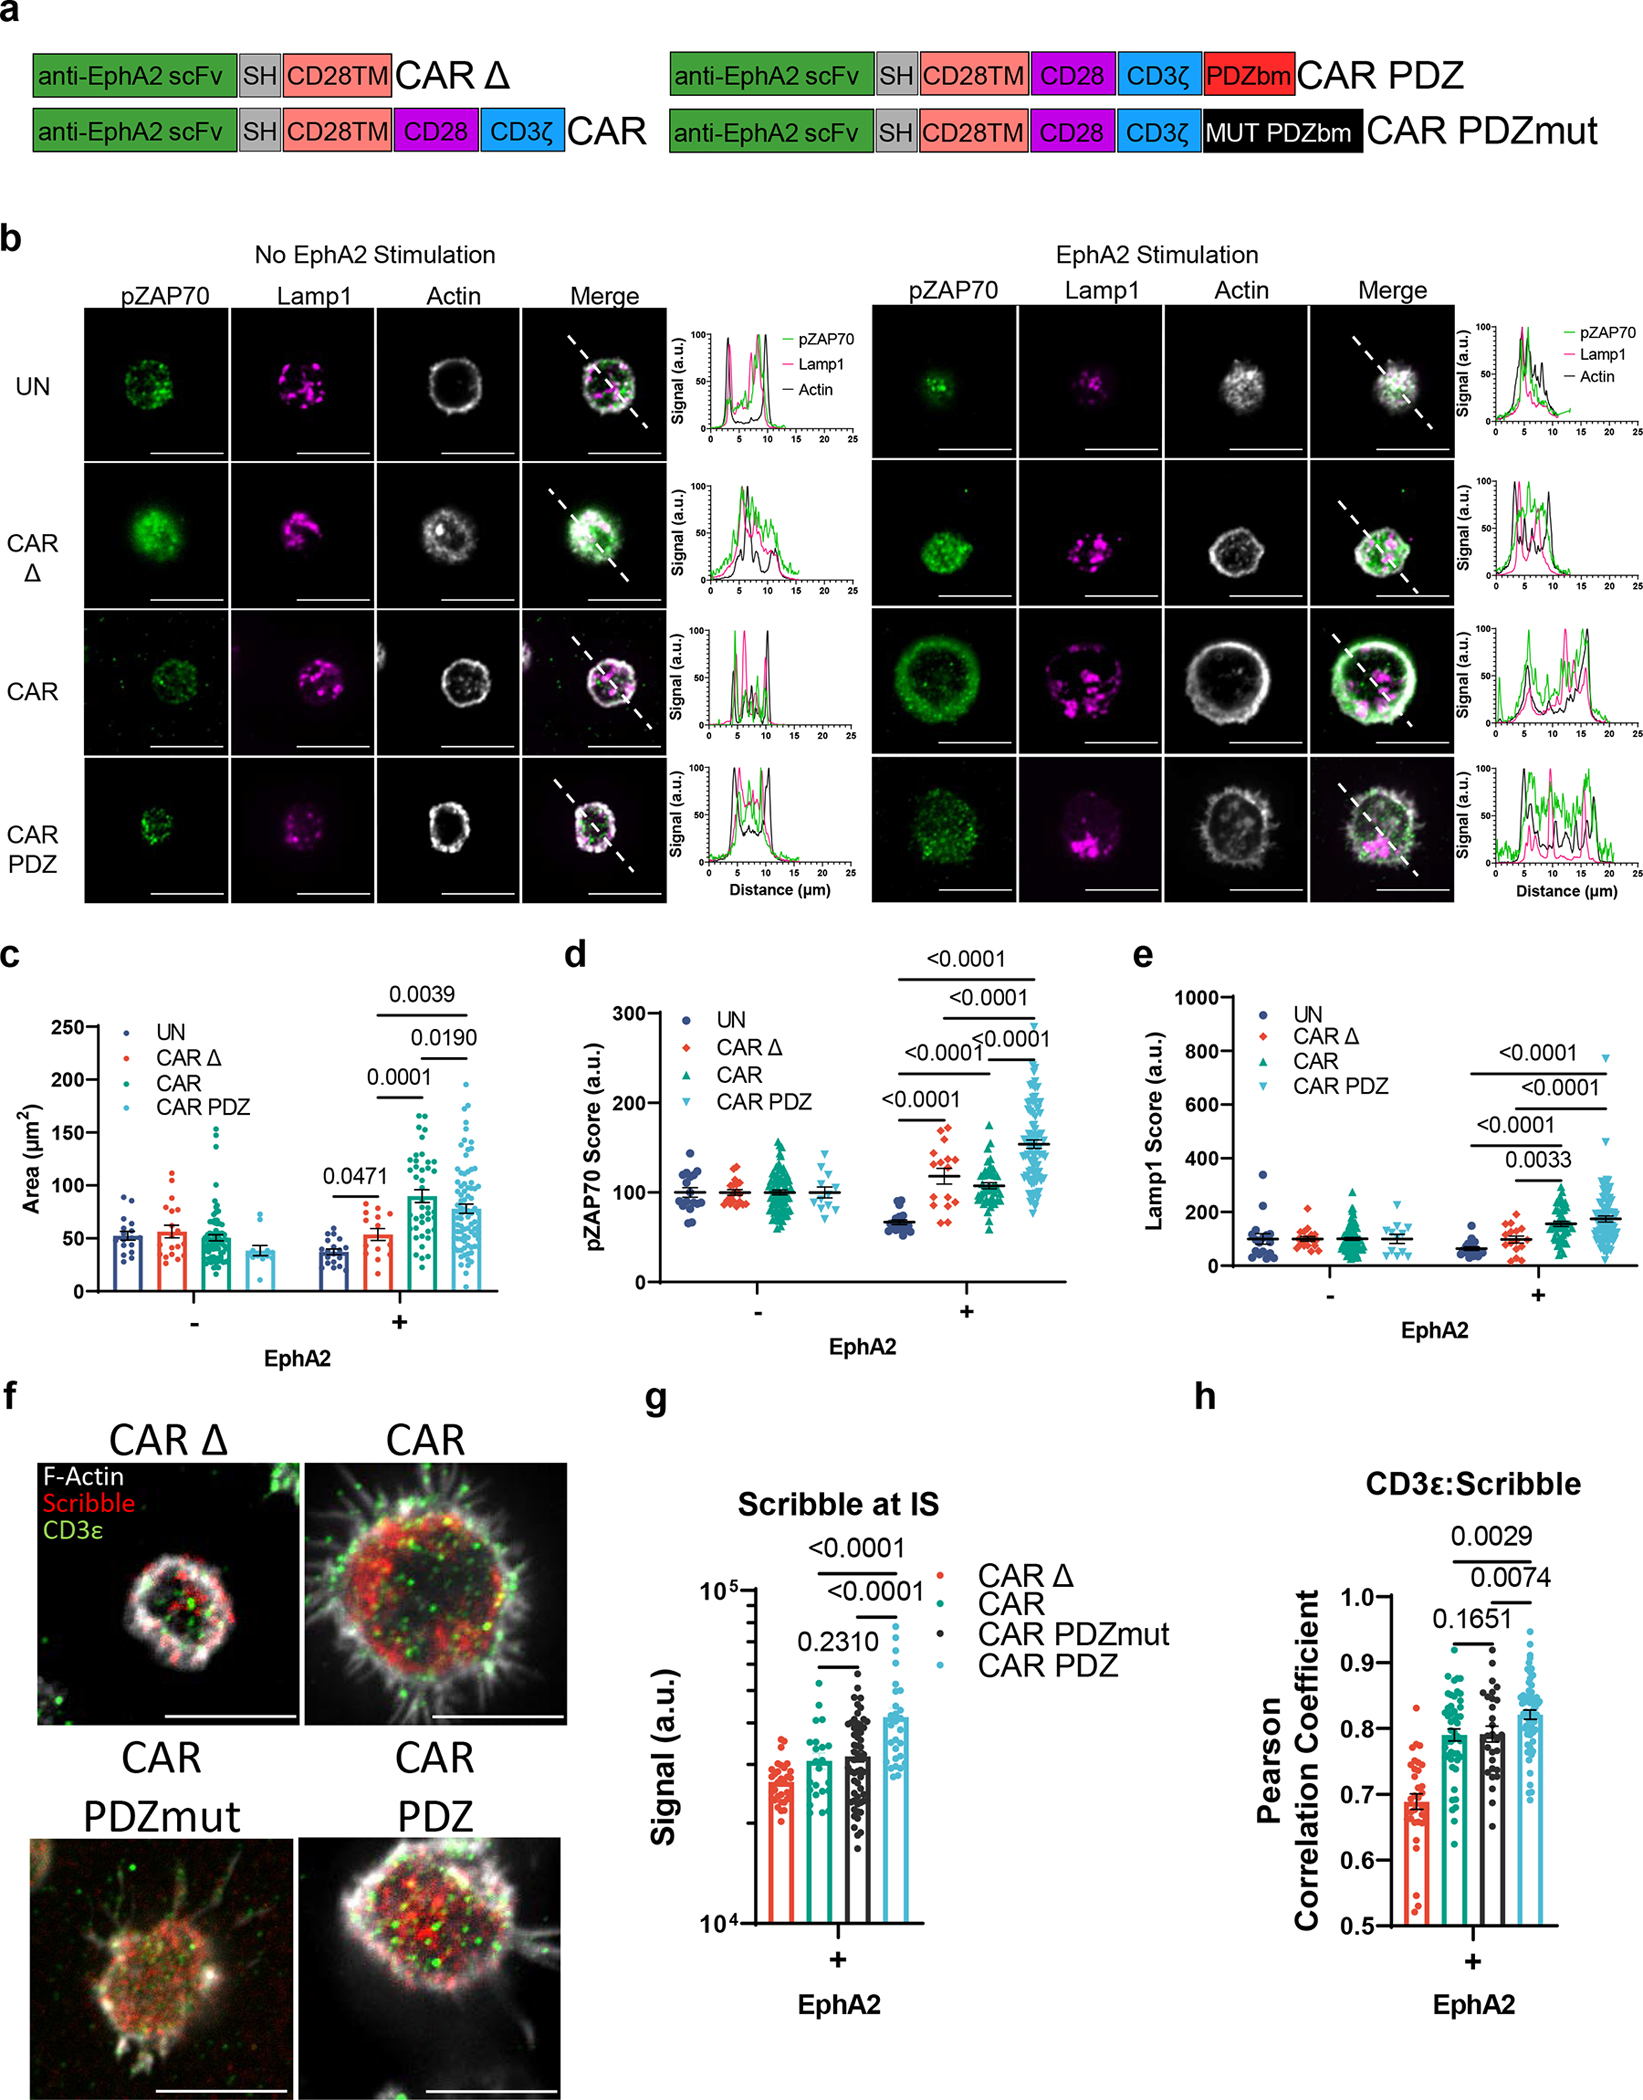
(a) Chimeric antigen receptor design schemes. Antigen recognition domain (anti-EphA2 scFv): green, short hinge domain IgG (SH): grey, transmembrane domain CD28 (CD28TM): salmon, CD28 co-stimulatory domain: purple, CD3ζ activation domain: blue, PDZbm scaffolding anchor domain: red, and mutated PDZbm domain in black.
(b) Fluorescent confocal microscopy of NK cells with and without recombinant human EphA2 protein incubated for 30 minutes, white bars indicate 10 microns; pZAP70 (green), Lamp1 (magenta), Actin (white). Dashed line in merged images delineate the approximate line scan quantization of the fluorescent signal depicted in the histograms to the right. Quantified single cell fluorescent data is plotted in (c-e).
(c) Quantification of synaptic area determined by actin immunolabeling, n=17 and 19, UN; n=19 and 16, CAR Δ; n=76 and 44, CAR; n=12 and 83, CAR.PDZ with and without EphA2 respectively. Two-Way ANOVA mean±SEM shown of one donor.
(d) pZAP70 intensity quantification from (b). Two-Way ANOVA mean±SEM shown. Cells are the same as in (c).
(e) Lamp1 intensity quantification from (b). Two-Way ANOVA mean±SEM shown. Cells are the same as in (c).
(f) Confocal images as prepared in (b) incubated for 60minutes with NK cells in various groups quantified in (g, h). White bars indicate 10microns. Immunolabelling of Scribble in red, CD3ε in green, and filamentous actin (F-actin) in white.
(g) Scribble polarization and accumulation at the immune synapse (IS). CAR Δ; n=32, CAR; n=23, CAR.PDZmut: n=57, CAR.PDZ n=28 from two independent experiments, One-Way ANOVA mean±SEM shown of two donors.
(h) CD3ε co-localization with Scribble as determined by Pearson Correlation Coefficient. CAR Δ; n=33, CAR; n=48, CAR.PDZmut: n=29, CAR.PDZ n=61, One-Way ANOVA mean±SEM shown of one donor.
Two-stage linear step-up procedure of Benjamini, Krieger and Yekutieli to correct for FDR in all cases.
We first determined if the PDZbm modulates CAR NK cell synapse formation in the singular context of EphA2 by doping recombinant human EphA2 protein to poly-L-lysine coated glass slides and allowed CAR NK cells to incubate and interact for 30 minutes (Figure 1b). We assessed synaptic area, downstream signaling via ZAP70 phosphorylation, and lysosomal polarization via confocal microscopy. Representative images, selected by the corresponding mean value calculated, are taken at the z-plane just above the glass surface to acquire a circular cross section of the spheroidal NK cells as they rest on top interacting with the EphA2 protein. We found a marked difference between CAR.PDZ and CAR constructs in the synaptic area (Figure 1c) and pZAP70 accumulation at the immune synapse (Figure 1d). The synaptic area was more condensed for CAR.PDZs and we observed that pZAP70 was increased in CAR.PDZ NK cells suggesting a more efficient signaling cascade (Figure 1d). Lysosomal polarization was not statistically different; however, it trended toward elevated levels in CAR.PDZ NK cells, which suggests cytotoxic vesicle recruitment to the immune synapse is enhanced (Figure 1e). We also found that CAR.PDZ constructs induced a significantly greater accumulation of Scribble (Figure 1f,g), confirming the functionality of the PDZ domain. This accumulation was time dependent as differences were not observed at 30 minutes (Extended Figure 2a,b). Furthermore, we observed an increase in a cytoplasmic splice variant of CD3ε20 that co-localized with Scribble as determined by the Pearson correlation coefficient specifically in CAR.PDZ NK cells (Figure 1h).
We next sought to investigate other synaptic protein polarizations. Given the importance of f-actin polymerization in synapse formation we elected to explore Wiskott/Aldrich syndrome protein (WASp). WASp regulates f-actin polymerization21 and we found a rapid accumulation of WASp in PDZ.CAR NK cells upon antigen recognition (Extended Figure 3). Thus, including a PDZ domain results in improved synapse formation, as judged by a condensed synaptic area with higher levels of phosphorylation (pZAP70) and recruitment of additional signaling molecules (CD3ε).
PDZbm enhances CAR NK cell calcium flux, avidity, and polarization
Given the multifactorial signal integration that NK cells calculate on a per cell basis16,22, we opted to explore the complex binding between NK cells and tumor cells, specifically EphA2 expressing A549 lung adenocarcinoma cells. We utilized a single cell avidity measurement technology, z-MOVI™, that determines the precise binding force between effector and target cell. We show that CAR.PDZ constructs have amplified binding capabilities after a 5-minute co-culture period followed by acoustic force exposure (Figure 2a,b). Intriguingly, we found no difference between standard CAR and non-signaling CAR constructs which further demonstrates the lack of internal super structure being formed in a traditional CAR signaling cascade (Figure 2c). CAR binding specificity was confirmed with an A549 cell line in which EphA2 was knocked out (KO) by CRISPR/Cas 9 gene editing (Figure 2d,e).
Figure 2: CAR.PDZ NK cells exhibit enhanced avidity and calcium flux upon cancer cell recognition.
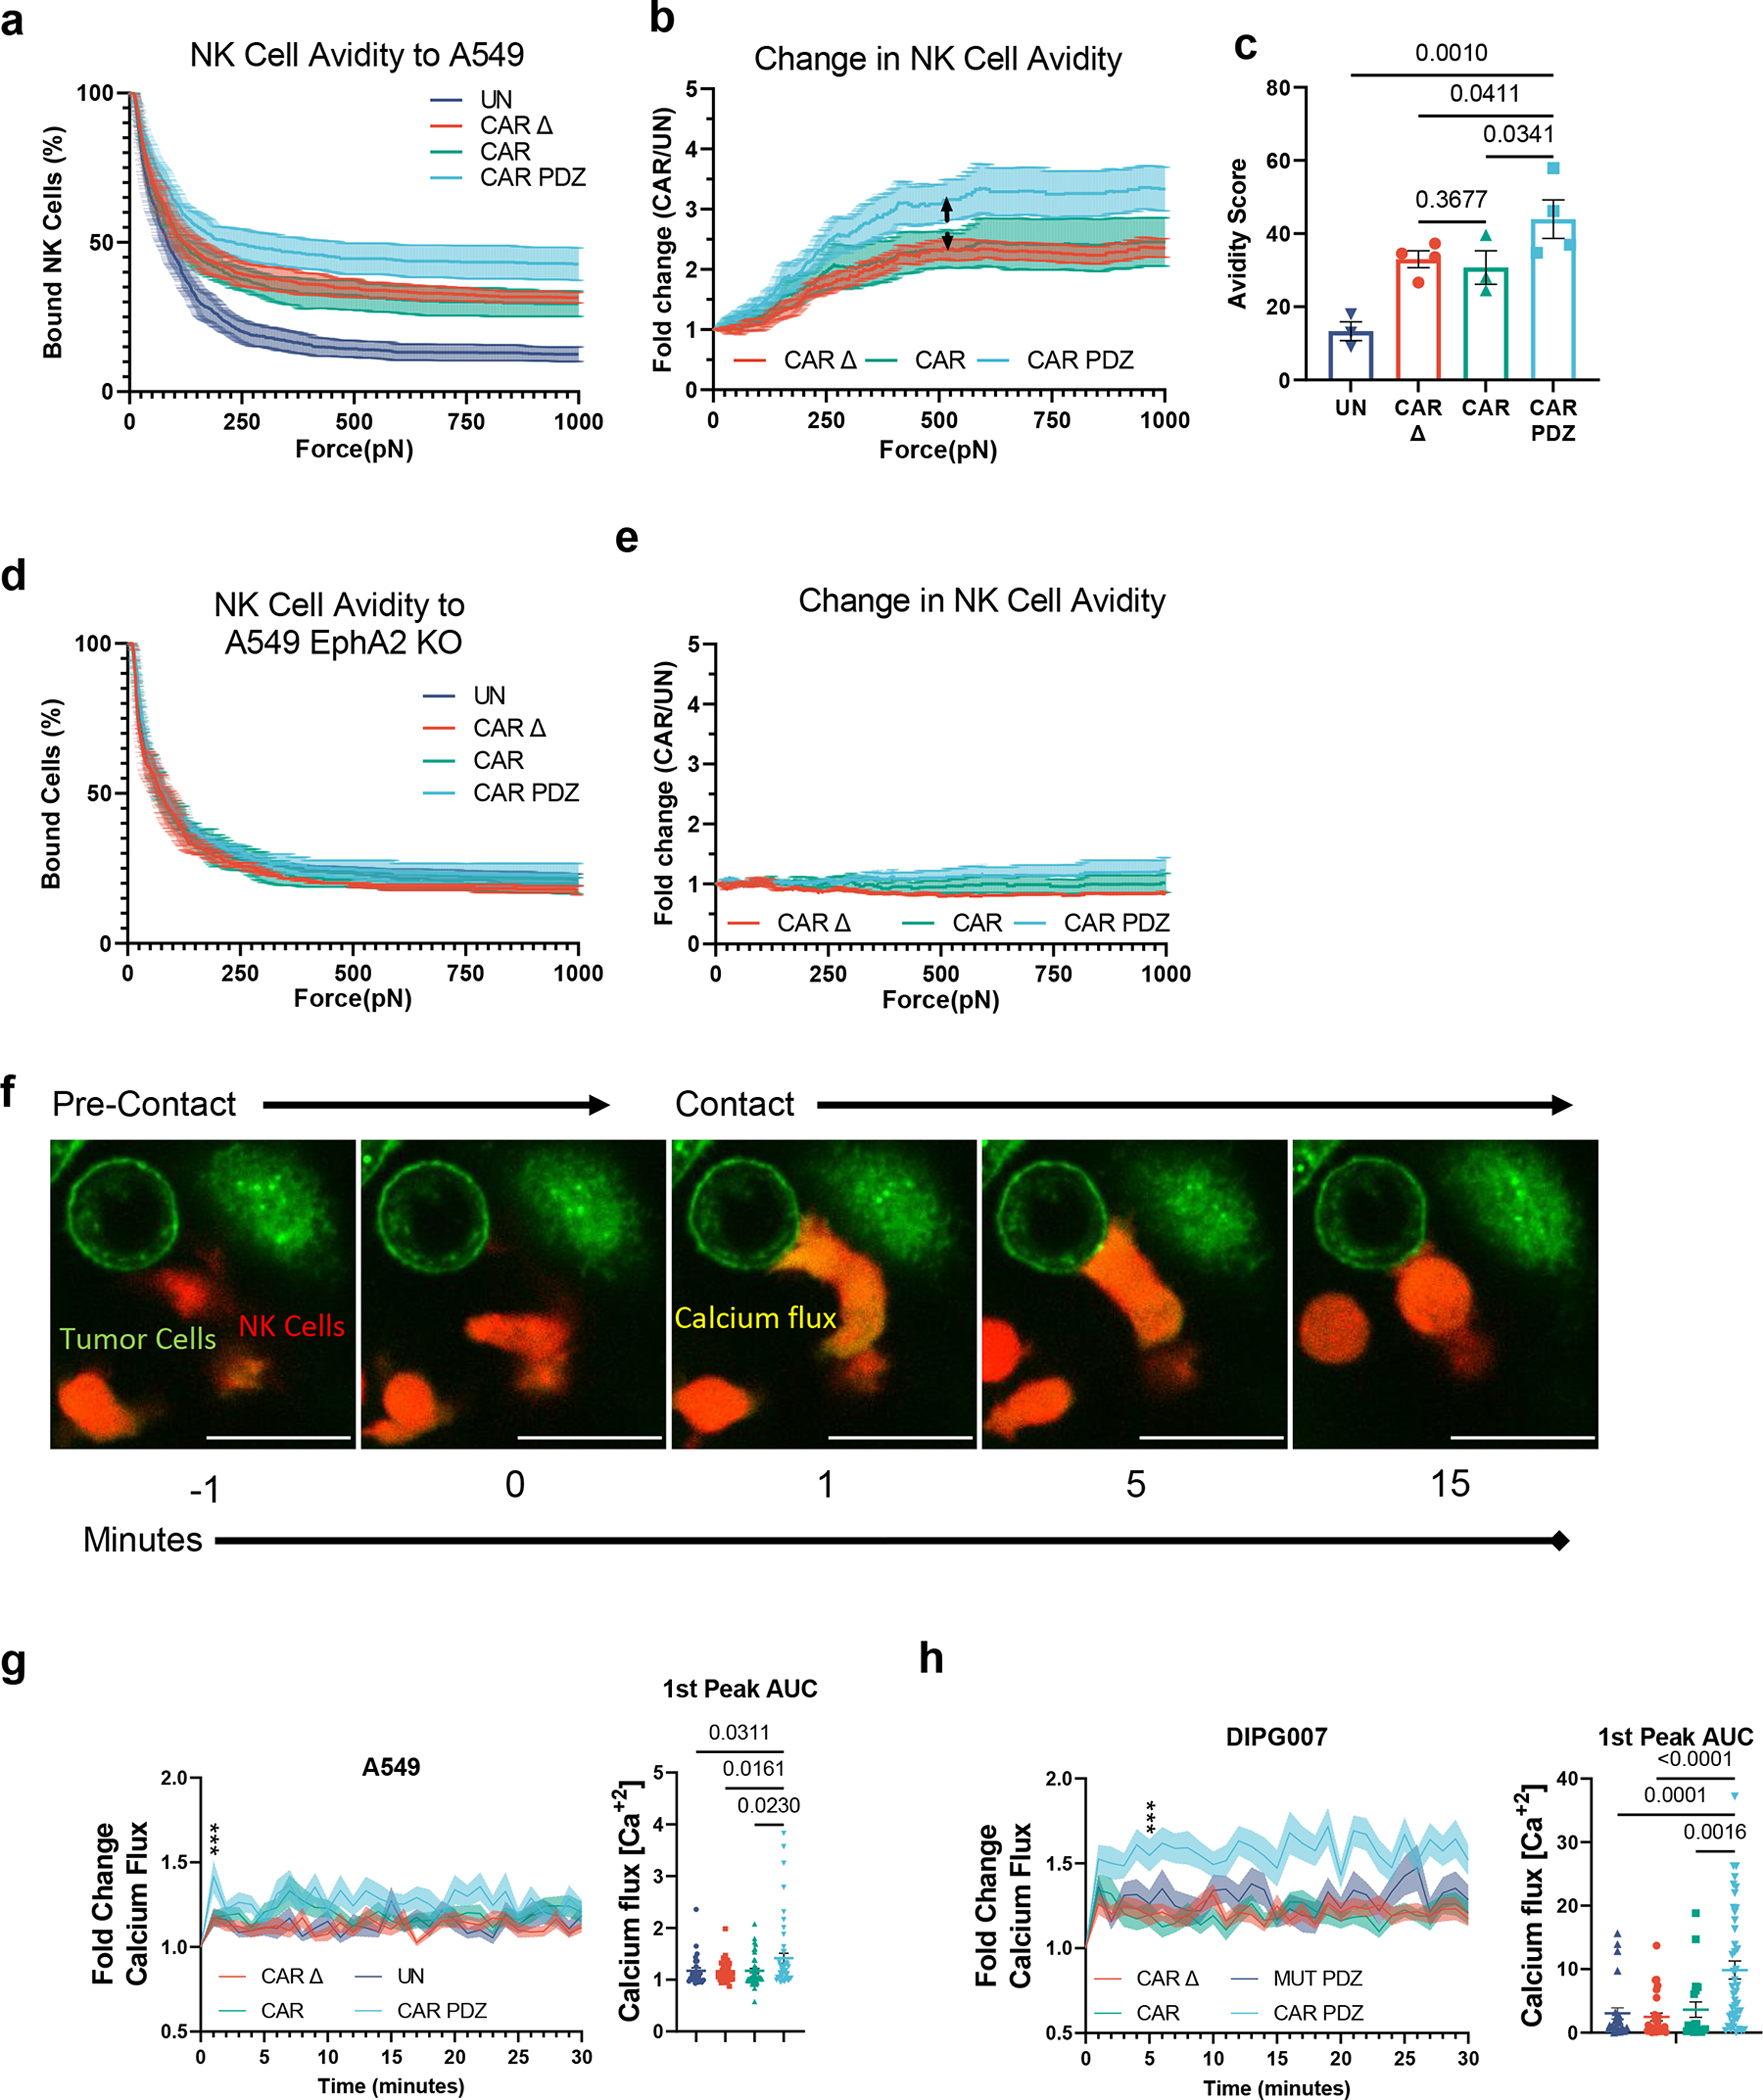
(a) Single cell assessment of at least NK cell avidity to EphA2-positive A549 tumor cells; at least 100 cells for each independent experiment was analyzed. UN; n=3 CAR Δ; n=4, CAR; n=3, CAR.PDZ; n=4 donors,mean±SEM shown.
(b) Normalized fold change of CAR NK cell binding compared to untransduced NK cells from (a). Arrowed line indicates the point of statistical difference at CAR.PDZ vs. CAR Δ and vs CAR at 548pN which continued to 1000pN. Two-Way ANOVA was used to determine statistical significance with Two-stage linear step-up procedure of Benjamini, Krieger and Yekutieli to correct for FDR; mean±SEM shown.
(c) Avidity score of CAR NK cells determined by plateau of One-Phase Decay analysis from (a). One-Way ANOVA was used to determine statistical significance with Two-stage linear step-up procedure of Benjamini, Krieger and Yekutieli to correct for FDR. mean±SEM shown.
(d) Same experimental conditions as (a) except utilizing EphA2 deleted A549 cells.
(e) Same normalized fold change as described in (c) utilizing EphA2 deleted A549 cells.
(f) Representative single cell calcium flux analysis of NK cells interacting with A549 tumor cells over indicated time points. Tumor cells labelled in green, NK cells in red, and calcium flux seen as a yellow burst. White bar indicates 10 microns.
(g) Fold Change Calcium flux quantification of NK cells with A549 tumor cells. UN; n= 28, CAR Δ; n=35, CAR; n=44, CAR.PDZ; n=48. Two-Way ANOVA was used to determine statistical significance with Two-stage linear step-up procedure of Benjamini, Krieger and Yekutieli to correct for FDR q<0.001 *** at minute 1; 1st peak AUC analysis with unpaired Brown-Forsythe and Welch’s ANOVA. mean±SEM shown of one donor.
(h) Fold Change Calcium flux quantification of NK cells with DIPG007 tumor cells. CAR Δ; n=30, CAR; n=19, CAR.PDZmut: n=26, CAR.PDZ n=43. Two-Way ANOVA was used to determine statistical significance with Two-stage linear step-up procedure of Benjamini, Krieger and Yekutieli to correct for FDR q<0.001 *** at minute 6; 1st peak AUC analysis with unpaired Brown-Forsythe and Welch’s ANOVA. mean±SEM shown of one donor.
Noting the enhanced binding strength of CAR.PDZ cells over a short period of time we next assessed calcium flux, a first step of immune cell activation23. Utilizing live cell image analysis, we quantified single cell calcium flux levels (Figure 2f, supplemental video 1–4) and found a greater calcium burst in CAR.PDZ NK cells (Figure 2g) and relatively higher and sustained levels over 30 minutes in comparison to other NK cell populations (untransduced, CAR, CAR Δ). Additionally, we quantified the time from calcium flux to lysosomal aggregation in these cells. CAR.PDZ NK cells were faster at coalescing the lysosomes compared to all other groups (Extended Data Figure 4, supplemental video 5–8). We next confirmed our findings in the DIPG007 glioma cells and included another control: NK cells expressing CAR.PDZs in which the C-terminal amino acid of the PDZbm was mutated, to render it non-functional (CAR.PDZmut). The greatest calcium flux was observed in CAR.PDZ NK cells compared to all other groups; further, CAR Δ, CAR, and CAR.PDZmut had similar calcium flux levels (Figure 2h). These results directly link a functional PDZbm as being critical to enhance NK cell activation.
We expanded upon these findings with another cancer cell line, LM7, and found similar results (Extended Data Figure 5). Additionally, we created another CAR containing the PDZbm targeting B7-H3 (Extended Data Figure 6a,b), a common tumor associated antigen studied previously24,25, and found similar results as with the EphA2 targeting CARs (Extended Data Figure 6c). We sought to explore the synapse size created between NK cells and tumor cells. In agreement with our initial data with antigen coated slides, CAR.PDZ NK cells had a smaller synapse area upon LM7 tumor cell interaction (Extended Data Figure 6d). Consistent with the previous calcium flux experiments, CAR.PDZ NK cells display enhanced flux against LM7 cells as well (Extended Data Figure 6e). Taken together, the enhanced calcium flux, smaller synapse area, and faster lysosome congregation all indicate a more efficient synapse formation.
Enhanced synapse CAR NK cells are polyfunctional
Given the amplified calcium influx and signaling via ZAP70 of CAR.PDZ NK cells we sought to determine the functional consequences. We first explored cytokine production upon target cell interaction and employed a 4-hour co-culture assay with A549 cells analyzing single cell secretomic profiles for each CAR construct utilizing an IsoLight™ system (Figure 3a). In particular, there was a notable increase in the frequency of perforin- and IFNy-secreting CAR.PDZ NK cells in comparison to CAR NK cells (Figure 3b). The latter is consistent with the observed amplified signaling via ZAP70 in CAR.PDZ NK cells, since IFNy production typically takes the highest level of activation stimulus and time26. We further observed an increased frequency of GM-CSF, TNFα, MIP-1α, and MIP-1β producing CAR.PDZ NK cells versus CAR NK cells; however, this did not reach statistical significance (Figure 3b). CAR.PDZ NK cells exhibited greater polyfunctionality, as judged by their ability to secrete multiple cytokines, in comparison to other NK cell populations (Figure 3c). To assess the quality of cytokine production, we calculated the polyfunctional strength index (PSI), which accounts for the frequency of cells secreting cytokine and the relative intensity of cytokine produced. We observed that the IFNy PSI was highest in CAR.PDZ NK cells (Figure 3d), which mirrored the secretion frequency data, and that the ‘effector cytokine’ group PSI was increased in CAR.PDZ versus CAR NK cells (Figure 3e). Finally, spectral t-SNE mapping of the signal intensity of selected cytokines (GM-CSF, IFNγ, IL-8, TNFα), chemokines (MCP-1, MIP-1α, MIP-1β) and molecules of cytolytic granules (granzyme B, perforin) revealed a distinct grouping of cells with a unique mapping of CAR.PDZ NK cells compared to other NK cell populations (Figure 3f). Intriguingly, we observed that CARΔ NK cells exhibited enhanced secretions compared to untransduced NK cells and in some instances similar levels to the signaling CARs. We hypothesize that this is due to the antigen recognition domain binding target cells and giving more opportunity for endogenous receptors to engage cognate ligands and become activated.
Figure 3: CAR.PDZ NK cells have enhanced and distinct cytokine production.
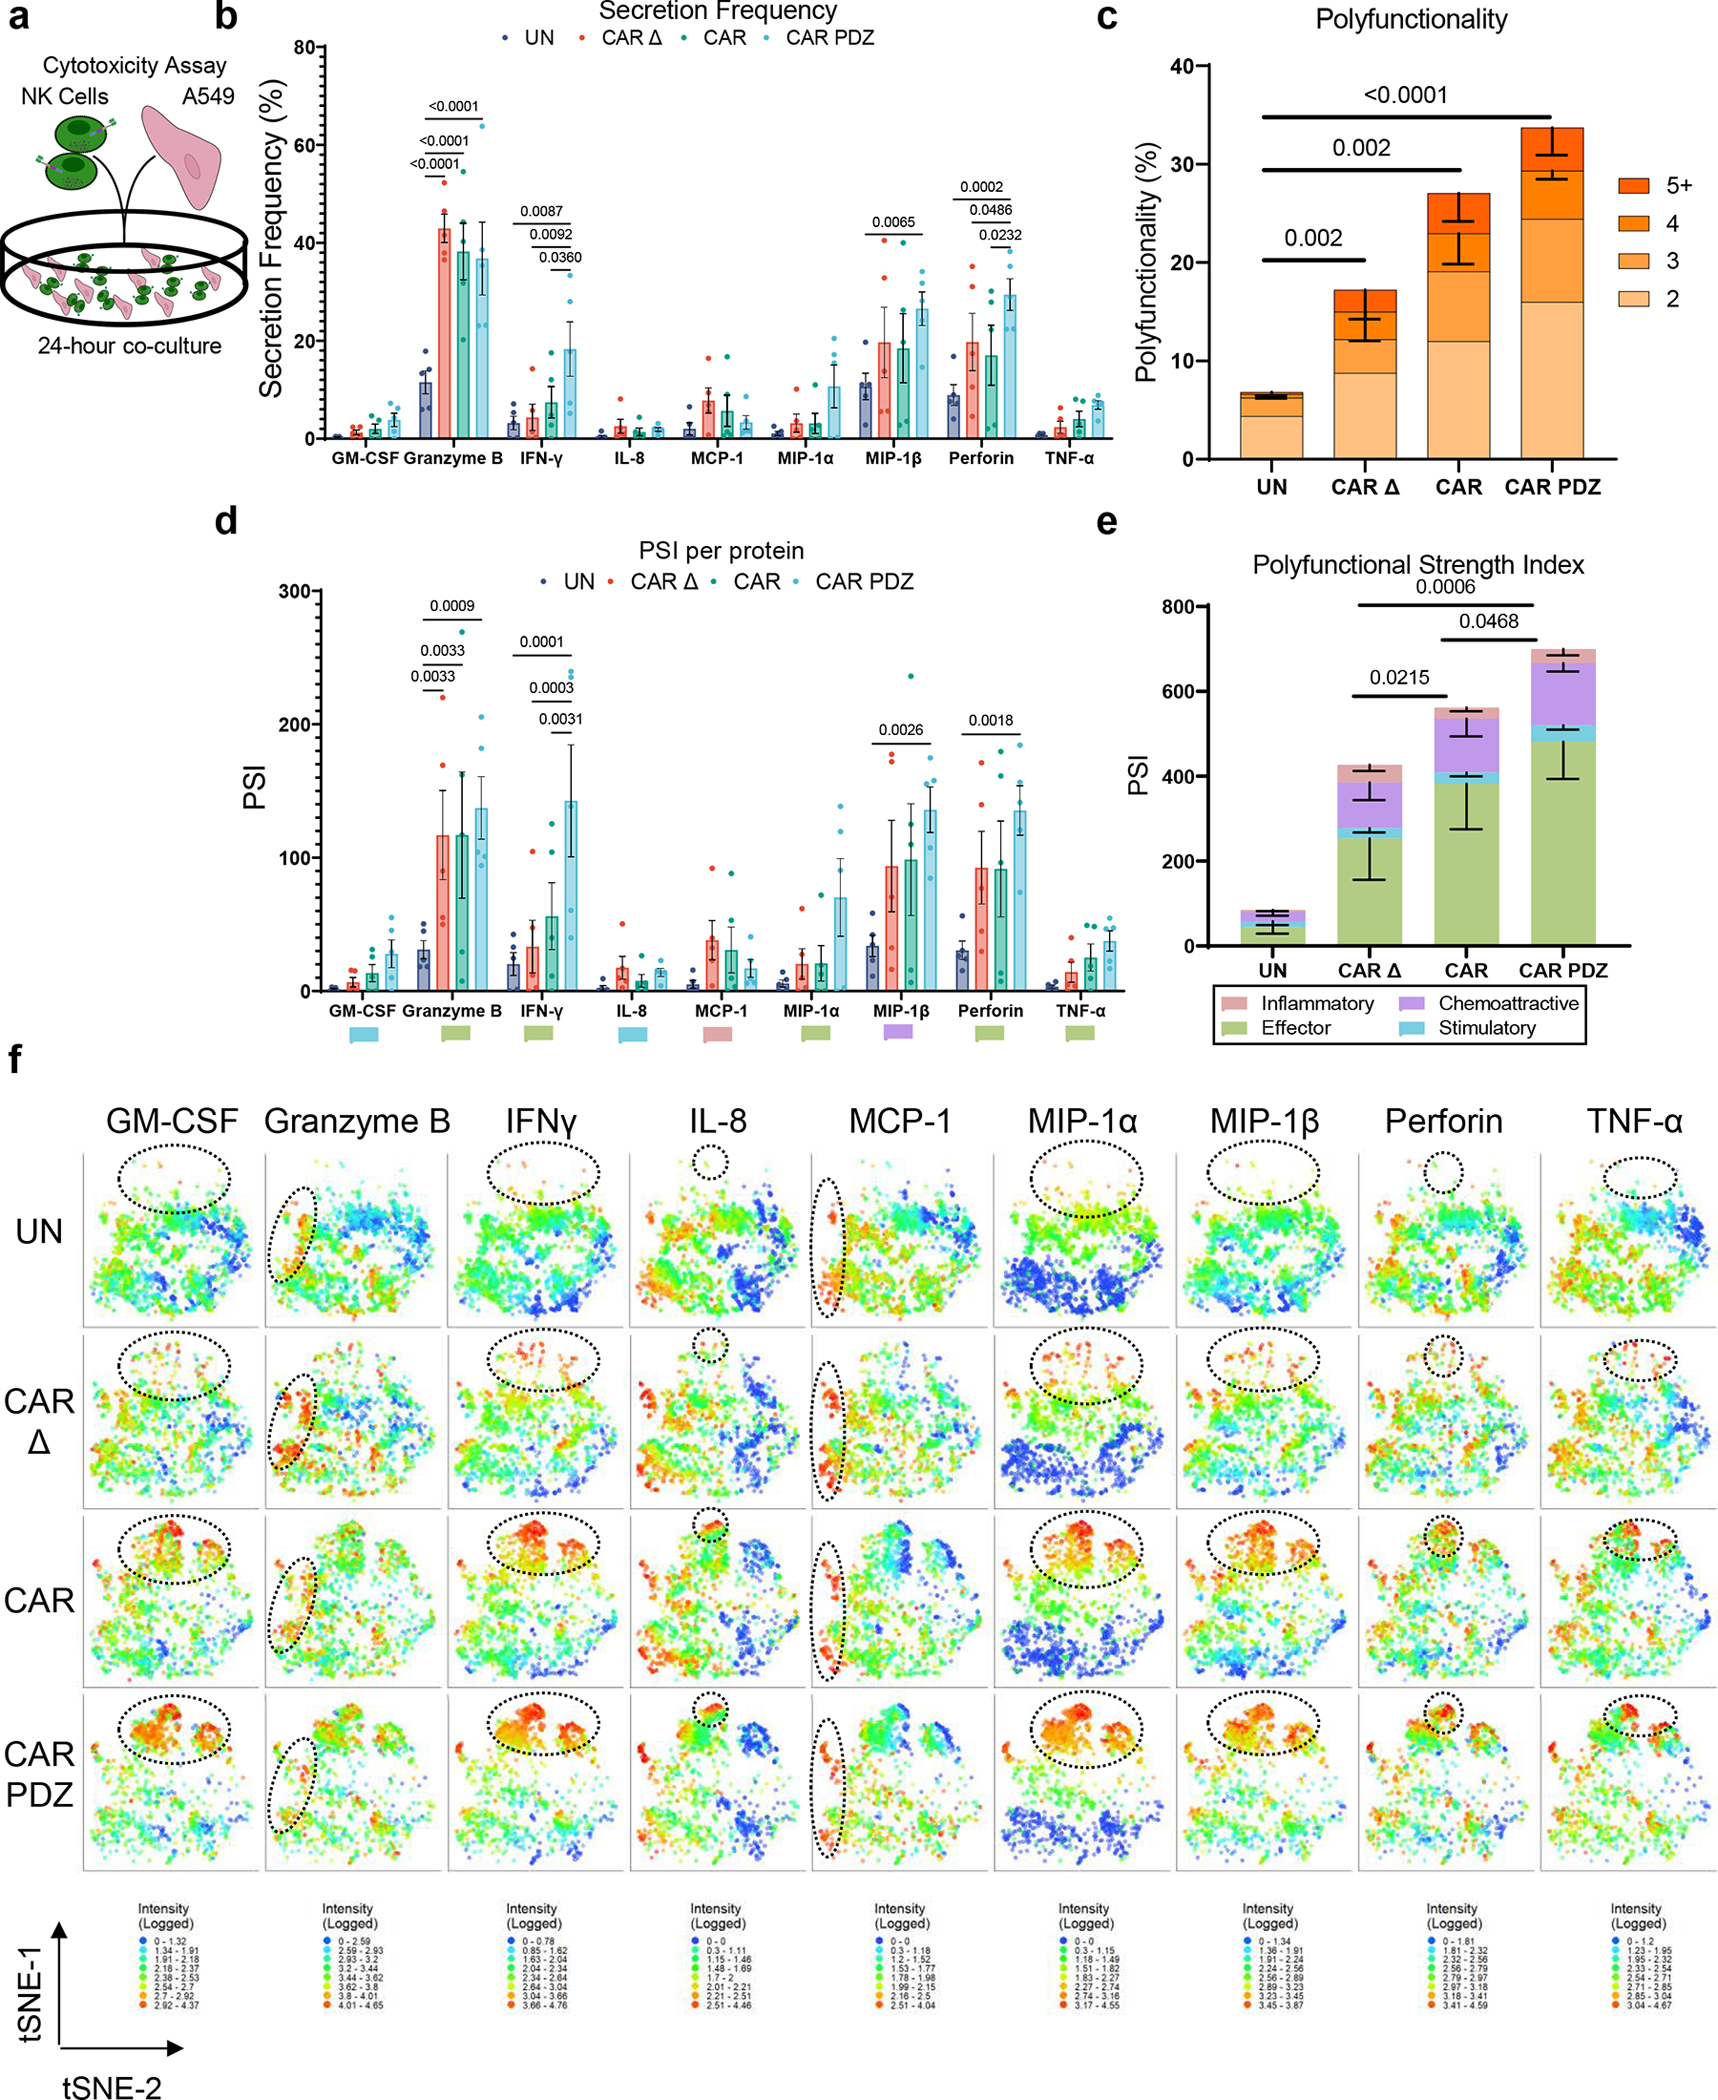
(a) Schematic overview of experimental conditions for secretomics analysis. Single cell secretomic analysis using an IsoLight machine depicting the polyfunctionality of NK cells after exposure to A549 target cells for 4-hours.
(b) Secretion frequency of selected cytokines from the 32 analyte IsoLight Chip. Two-Way ANOVA was used to determine statistical significance with Two-stage linear step-up procedure of Benjamini, Krieger and Yekutieli to correct for FDR. n=5 donors, mean±SEM shown.
(c) All CAR constructs produced significantly more cytokines on the 2-analyte level compared to UN. Two-Way ANOVA was used to determine statistical significance with Two-stage linear step-up procedure of Benjamini, Krieger and Yekutieli to correct for FDR. Statistical difference delineated by q<0.0001 ****. n=5 donors, mean±SEM shown.
(d) Polyfunctional Strength Index (PSI) of CAR-NK cells detailing cytokine categories of NK cells from (b) individual cytokines driving PSI variance with indicated colors defining (c). Two-Way ANOVA was used to determine statistical significance with Two-stage linear step-up procedure of Benjamini, Krieger and Yekutieli to correct for FDR. n=5 donors, mean±SEM shown.
(e) Only the effector cytokine group was significantly different between CAR.PDZ and CAR or CAR Δ NK cells. Two-Way ANOVA was used to determine statistical significance with Two-stage linear step-up procedure of Benjamini, Krieger and Yekutieli to correct for FDR. n=5 donors, mean±SEM shown.
(f) tSNE plots of the secretomic analysis performed in Figure 2a–e. tSNE plots revealed distinct cytokine secretion profiles and patterns for each construct tested. These plots highlight the increased secretion frequency and quantity. Log transformed secretion value intensities are delineated. Dashed ellipses indicate groups of highest secretion. Color spectra vary per cytokine from 0 to the highest value in each group, n=5 donors.
Synapse tuning improves CAR NK cell cytotoxicity and invasion
We next explored the cytolytic activity in CAR NK cells in 2D and 3D culture systems. In a standard 24-hour 2D MTS viability assay (Figure 4a), CAR.PDZ NK cells exhibited superior cytolytic activity against A549 tumor cells in comparison to CAR NK cells at all evaluated effector to target (E:T) ratios, except for the highest E:T ratio (Figure 4b). Assessing the mutated PDZbm CAR.PDZmut NK cells revealed a similar killing profile to standard CAR NK cells and a significantly reduced capacity compared to functional CAR.PDZ NK cells (Figure 4c). Conversely, we explored the functional consequences of CAR.PDZ binding to Scribble by blocking this interaction with a peptide Scribble PDZ antagonist, which resulted in reduced cytotoxicity (Figure 4d). We observed reduced cytolytic activity in all constructs which was expected given the ubiquitous nature of Scribble’s role in cell polarity and the high affinity peptide binding of Scribble’s PDZ domain. However, the greatest inhibitory effect was seen in CAR.PDZ NK cells as quantified by area between the curves analysis (Figure 4d,e).
Figure 4: CAR.PDZ NK cells have enhanced cytolytic activity and invasive properties.
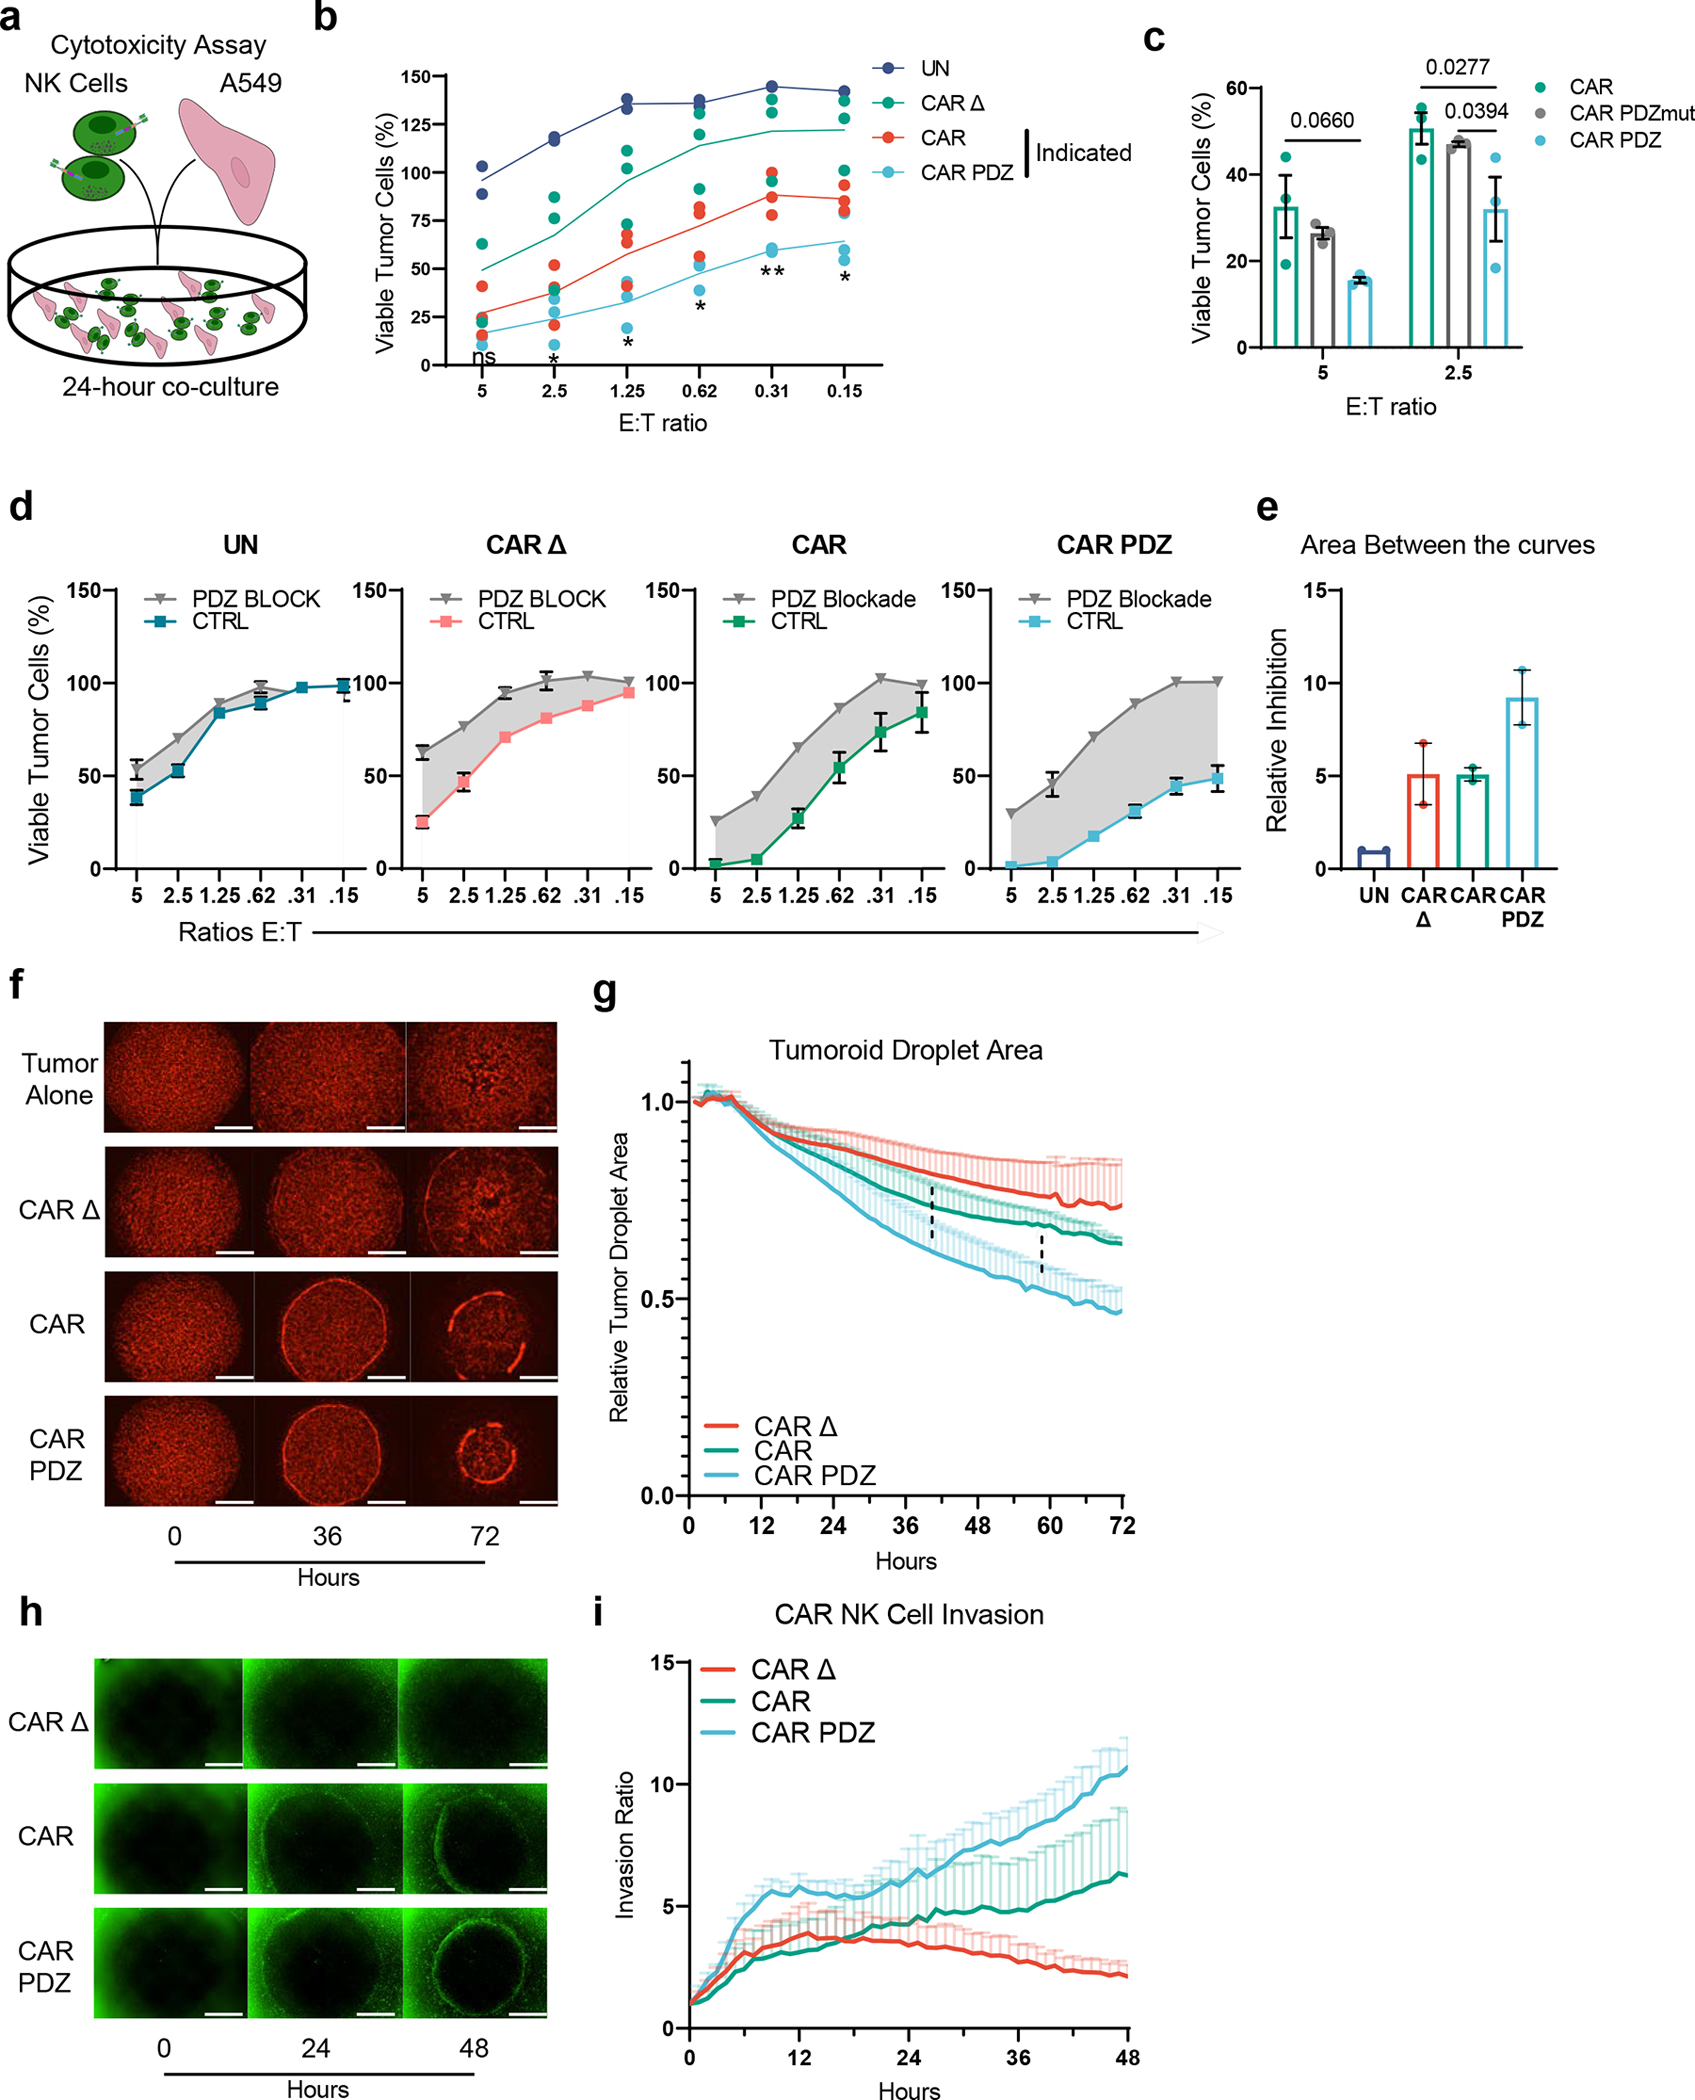
(a) Cytotoxicity assay scheme with A549 lung adenocarcinoma cell viability determined by a chromogenic MTS assay after 24-hour co-culture with NK cells.
(b) CAR vs CAR.PDZ NK cells: significant differences at all effector to target (E:T) ratios except for 5:1. All other comparisons are significantly different. Two-Way ANOVA was used to determine statistical significance with Two-stage linear step-up procedure of Benjamini, Krieger and Yekutieli to correct for FDR. Statistical difference delineated by q<0.05 *, q<0.01 **, n=3 donors, mean±SEM shown.
(c) CAR vs CAR.PDZ vs CAR.PDZmut NK cells: significant differences at all effector to target (E:T) ratios 2.5:1. Two-Way ANOVA was used to determine statistical significance with Two-stage linear step-up procedure of Benjamini, Krieger and Yekutieli to correct for FDR. n=3 donors, mean±SEM shown.
(d) UN, CAR Δ, CAR, CAR.PDZ NK cells with 10 micromolar PDZ blocking or control (CTRL) peptides. Technical triplicates with mean±SEM shown.
(e) Area between the curve analysis (shaded regions in d) for two independent experiments with unique donors normalized to untransduced.
(f) Representative images from a tumoroid droplet cytotoxicity assay 143b osteosarcoma cells in mCherry. White bars indicate 1mm.
(g) Quantification of the resulting tumor reduction as determined by tumor area normalized to the 1-hour (hr) mark. CAR.PDZ vs CAR Δ NK cells: significant differences starting at 40hrs of culture; CAR.PDZ vs CAR NK cells: significant differences starting at 58hrs of culture. Two-Way ANOVA was used to determine statistical significance with Two-stage linear step-up procedure of Benjamini, Krieger and Yekutieli to correct for FDR. Dashed lines indicate comparison groups and what hour they become statistically different at least q<0.05 *. n=3 donors, mean±SEM shown.
(h) Representative images from a tumoroid droplet invasion assay showing NK cells in green. Co-cultures were imaged hourly for 2 days. White bars indicate 1mm.
(i) NK cell invasion ratio represents the counted NK cells per mm2 and normalized to the 1-hour mark.
In a 3D assay, which consisted of a mixture of mCherry-positive 143b osteosarcoma cells and collagen in droplets surrounded by a ring of NK cells in Matrigel (Figure 4f), CAR.PDZ NK cells reduced tumoroid size to a greater degree than CAR NK cells (Figure 4g). NK cells were then labeled with a green fluorescent dye and tracked over 48 hours. CAR.PDZ cells also exhibited an enhanced ability to migrate to the droplet and invade to the center of the well in comparison to CAR NK cells (Figure 4h,i; supplemental videos 9–11). Thus, adding a PDZbm to CARs enhances not only their cytolytic potential, but also their migratory activity consistent with the known biology of Scribble in cell polarity and migration27.
Synapse-tuned CAR NK cells have potent anti-tumor activity
Finally, we compared the anti-tumor efficacy of untransduced, CAR Δ, CAR, and CAR.PDZ NK cells in three solid tumor xenograft models. We started with an A549 lung adenocarcinoma model in which tumor cells were implanted subcutaneously and treated with NK cells intravenously 14 days later (Figure 5a). Untreated tumors and tumors treated with untransduced NK cells showed rapid outgrowth. In contrast, CAR Δ, CAR, and CAR.PDZ NK cells had anti-tumor activity, including complete responses (CRs) for CAR and CAR.PDZ NK cells (Figure 5b). Only mice treated with CAR.PDZ NK cells had an improved overall survival benefit in comparison to CAR Δ NK cell treated mice (Figure 5c). While the median survival of CAR.PDZ NK cell treated mice was 16 days greater than for CAR NK cell treated mice, this did not reach statistical significance (Figure 5c). We next evaluated the same CAR NK cell populations in a locoregional osteosarcoma model. Mice were injected intraperitoneally with firefly luciferase expressing LM7 cells followed by injection of NK cells on day 7 (Figure 5d). Only, CAR.PDZ and CAR NK cells induced tumor regression, including CRs, as judged by bioluminescence imaging (Figure 5e). Mice treated with CAR.PDZ NK cells had a distinct survival advantage in comparison to all other treatment groups including CAR NK cells (Figure 5f). We extended these findings to a third tumor model, 143b, which is a highly aggressive osteosarcoma. We implanted 143b cell subcutaneously and treated with NK cells 5 days later (Figure 5g). All groups of mice except CAR.PDZ NK cell treated mice rapidly grew. This was observed in both the previous EphA2 targeting CARs and B7-H3 targeting CARs (Figure 5h). Again, only CAR.PDZ NK treated mice had an increase in survival (Figure 5i,j).
Figure 5: CAR.PDZ NK cells extend survival and eradicate solid tumors in vivo.
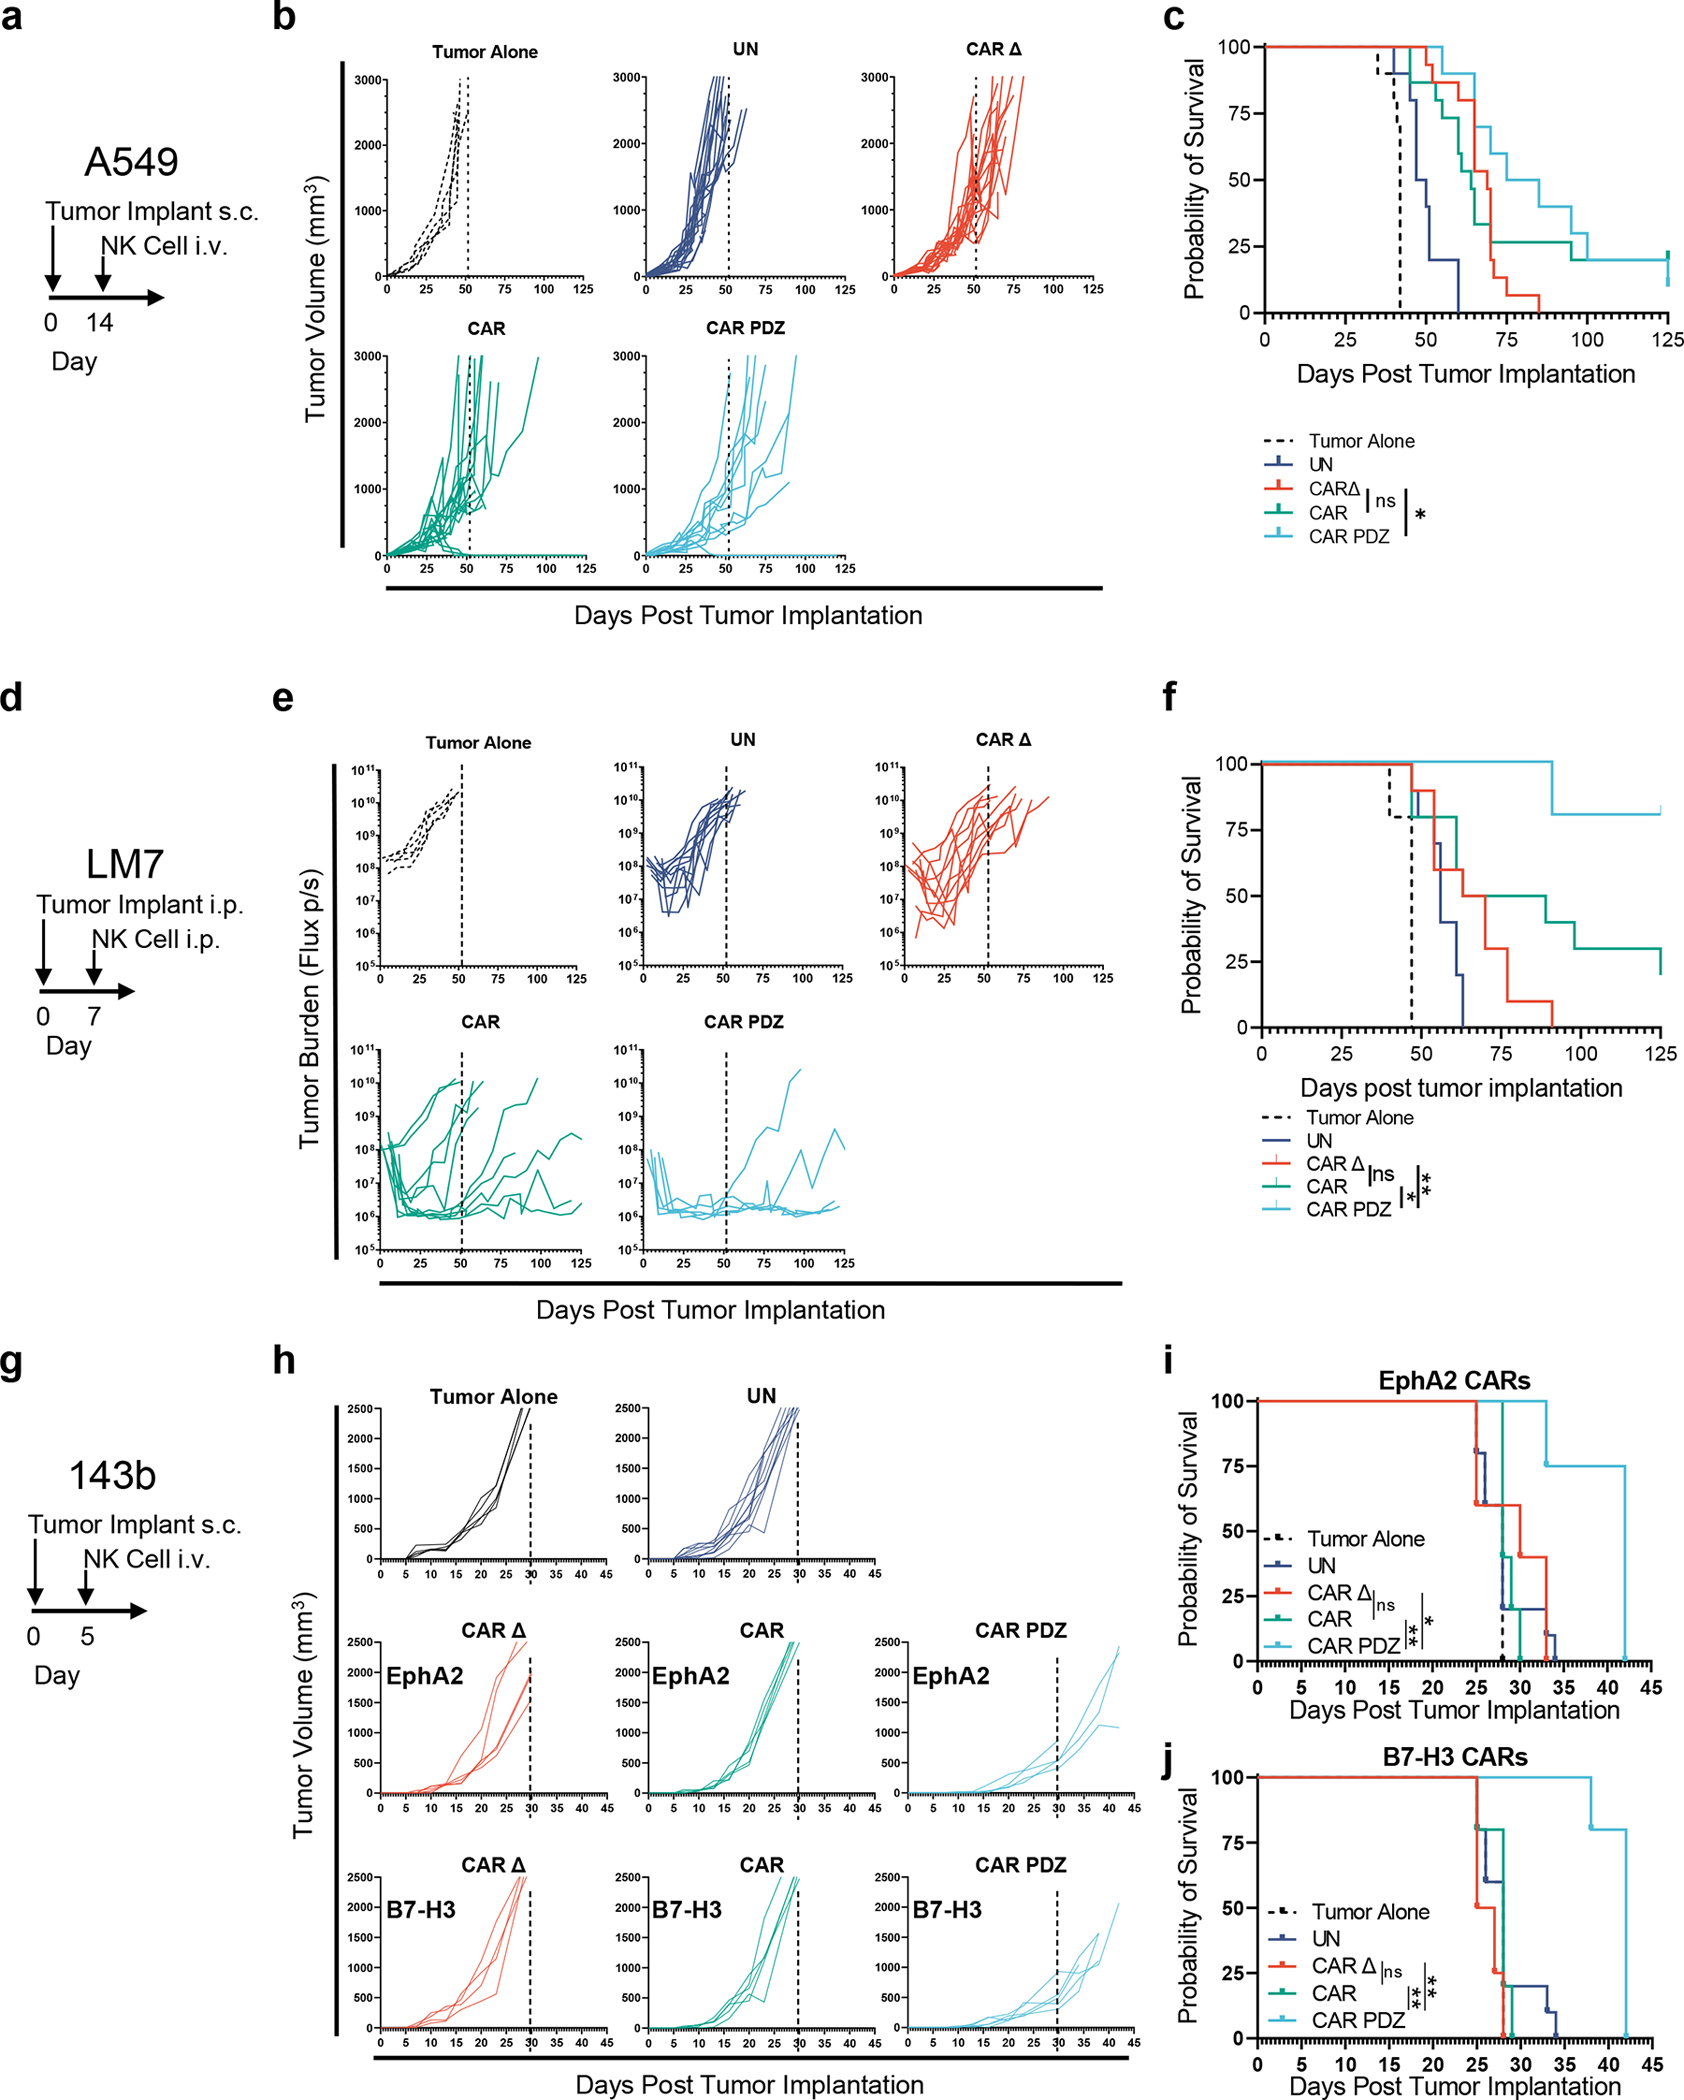
(a) A549 model timeline.
(b) 2×10⁶ A549 tumor cells were mixed in pure Matrigel and injected subcutaneously (s.c.) into the dorsal flank of male and female NSG mice. 14 days later mice were treated with a single 10×106 intravenous (i.v.) injection of NK cells. Tumor Alone: n=10, UN: n=10, CAR Δ: n=15, CAR: n=15, CAR.PDZ: n=10 mice data merged from two-three independent experiments with unique donors.
(c) Kaplan-Meier curves of mice from (a) median survival rates for each group (days): Tumor Alone: 42, UN: 48.5, CAR Δ: 69, CAR: 64, CAR.PDZ: 80. Log-rank test was used to determine significance. Statistical difference delineated by p<0.05 *.
(d) LM7 locoregional model timeline.
(e) 1×10⁶ LM7.ffluc tumor cells were injected intraperitoneally (i.p.) into NSG mice. 7 days later mice were treated with a single 10×106 i.p. dose of NK cells. Tumors were measured by bioluminescence imaging. Tumor Alone: n=10, UN: n=10, CAR Δ: n=10, CAR: n=10, CAR.PDZ: n=5 mice merged from two independent experiments with unique donors.
(f) Kaplan-Meier curves of mice from (b) median survival rates for each group (days): Tumor Alone: 47, UN: 56, CAR Δ: 66.5, CAR: 76, CAR.PDZ: undefined. Log-rank test was used to determine significance. Statistical difference delineated by p<0.05 *, <0.01 **.
(g) 143b model timeline.
(h) 1×10⁶ 143b tumor cells were injected subcutaneously (s.c.) into the dorsal flank of NSG mice. 5 days later mice were treated with a single 10×106 intravenous (i.v.) injection of NK cells. Tumor Alone: n=10, UN: n=10, EphA2 CARs: CAR Δ: n=5, CAR: n=5, CAR.PDZ: n=4. B7-H3 CARs CAR Δ: n=4, CAR: n=5, CAR.PDZ: n=5 mice
(i) Kaplan-Meier curves of EphA2 targeted CAR NK treated mice from (h) median survival rates (days): Tumor Alone: 28, UN: 28, CAR Δ:30, CAR: 28, CAR.PDZ: 42. Log-rank test was used to determine significance. Statistical difference delineated by p<0.05 *, <0.01 **.
(j) Kaplan-Meier curves of B7-H3 targeted CAR NK treated mice from (h) median survival rates (days): Tumor Alone: 28, UN: 28, CAR Δ:26, CAR: 28, CAR.PDZ: 42. Log-rank test was used to determine significance. Statistical difference delineated by p<0.01 **.
We further evaluated the functional persistence of CAR NK cell in mice that had achieved a CR in both models. In the A549 model, mice were re-challenged with the original tumor cell dose ~4 months after initial therapy. Palpable tumor nodules were measured 7 days post injection; however, large tumors never formed, and nodules had disappeared by day 14 (Extended Data Figure 7a). Likewise, LM7 tumors were rejected post rechallenge ~4 months after initial therapy (Extended Data Figure 7b,c). Thus, CAR NK cells, putatively, persisted and retained anti-tumor capabilities even though NSG mice do not endogenously produce cytokines that support NK cell survival.
CAR T cell functionality is enhanced by synapse tuning
Noting our observed increases in avidity and IFNγ secretion, we hypothesized that CAR T cells for solid tumors would especially be aided by our CAR design given the recent publication28 by Larson, et. al. 2022, that detailed that both factors are critically important for antitumor efficacy. To explore this, we utilized the same CAR constructs as before and evaluated the in vitro attributes of CAR.PDZ T cells. We found no alterations in immunophenotype of CAR.PDZ T cells (Extended Data Figure 8a–e). Upon co-culture with various solid tumor cells lines, CAR.PDZ T cells secreted more IFNγ and similar levels of TNFα, IL-6, and GMCSF (Extended Data Figure 8f). We next explored the T cell synapse formation with DIPG7c (Figure 6a,b and supplemental video 12,13) and LM7 (Extended Data Figure 9a) tumor cells using live cell imaging along with calcium flux measurements for DIPG7c (Figure 6c), LM7, U87, and DIPG007 (Extended Data Figure 9b–d). CAR.PDZ T cells had greater calcium flux and smaller synapse area compared to CAR T cells consistent with the notion of a more efficient synapse formation in all cases. These results were consistent with our previous NK cell data indicating a cell agnostic immune synapse augmentation. Further, we found no functional correlation to tumor cell surface expression of the CAR antigen (Extended Data Figure 10a). However, additional future studies are needed to further explore the role of antigen density.
Figure 6: CAR.PDZ T cells extend survival and eradicate solid tumors in vivo.
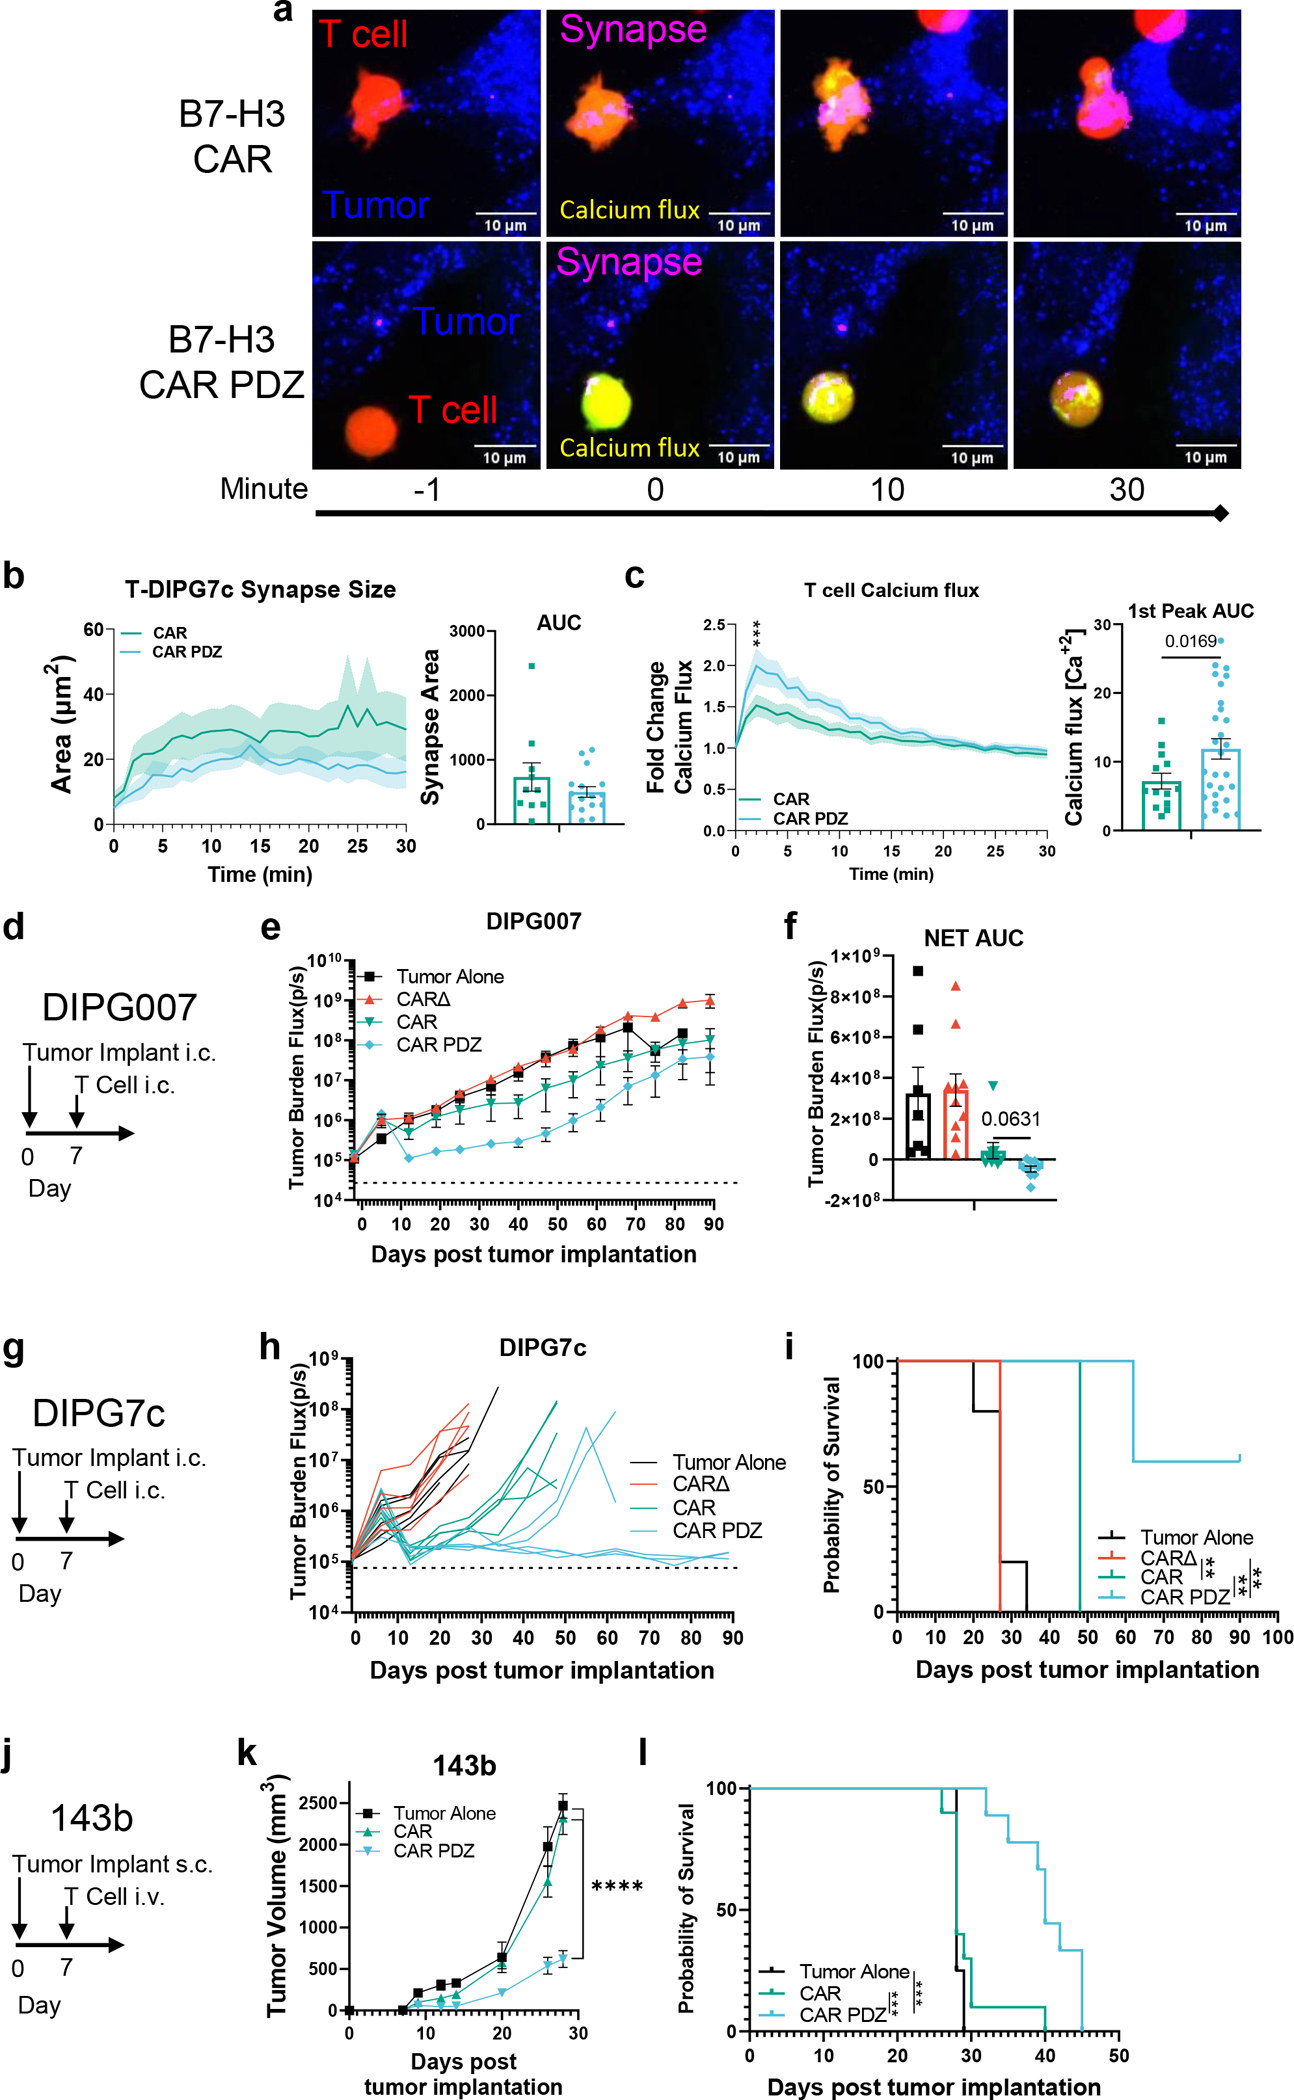
(a) Example images of B7-H3 CAR and CAR.PDZ T cells (Red), tumor cells (Blue), synapse (Magenta), calcium flux (Green).
(b) Immune synapse area quantification of B7-H3 CAR and CAR.PDZ T cells (n=10 and 16 cells) with AUC analysis with mean±SEM shown of one donor.
(c) Calcium flux quantification of B7-H3 CAR and CAR.PDZ T cells (n=14 and 28 cells) with Two-Way ANOVA was used to determine statistical significance with Two-stage linear step-up procedure of Benjamini, Krieger and Yekutieli to correct for FDR q<0.001 *** at minute 2; 1st peak AUC analysis with unpaired Student’s t-Test with Welch’s correction. mean±SEM shown of one donor.
(d) DIPG007 model timeline.
(e) 1×10⁶ DIPG007 tumor cells were injected intracranially (i.c.) into NSG mice. 7 days later mice were treated with 2×10⁶ intracranial (i.c.) injection of T cells. Tumor Alone: n=7, CAR Δ: n=10, CAR: n=9, CAR.PDZ: n=9 mice from two independent pooled experiments mean±SEM shown.
(f) Net Area Under the Curve analysis of tumor burden with One-Way ANOVA was used to determine statistical significance with Two-stage linear step-up procedure of Benjamini, Krieger and Yekutieli to correct for FDR. mean±SEM shown.
(g) DIPG7c model timeline.
(h) 1.5×10⁵ DIPG7c tumor cells were injected intracranially (i.c.) into the striatum of male and female NSG mice. 7 days later mice were treated with 2×10⁶ intracranial (i.c.) injection of T cells. Each group of mice is n=5, one donor.
(i) Kaplan-Meier curves of mice from (g) median survival rates (days): Tumor Alone: 27, CAR Δ: 27, CAR: 48, CAR.PDZ: Undefined. Log-rank test was used to determine significance. Statistical difference delineated by p<0.01 **.
(j) 143b model timeline.
(k) 1×10⁶ 143b tumor cells were injected subcutaneously (s.c.) into the dorsal flank of NSG mice. 7 days later mice were treated with10×106 intravenous (i.v.) injection of T cells. Tumor Alone: n=4, CAR: n=10, CAR.PDZ: n=9 mice merged from two unique donors. Two-stage linear step-up procedure of Benjamini, Krieger and Yekutieli to correct for FDR. Statistical difference delineated by q<0.0001 ****, mean±SEM shown.
(l) Kaplan-Meier curves of B7-H3 targeted CAR T treated mice from (k) median survival rates (days): Tumor Alone: 29, CAR Δ:29, CAR: 28, CAR.PDZ: 41. Log-rank test was used to determine significance. Statistical difference delineated by p<0.001 ***.
For our in vivo studies we elected to focus on patient derived orthotopic xenograft (PDOX) diffuse intrinsic pontine glioma (DIPG) models and our highly aggressive 143b osteosarcoma model. In both DIPG models, CAR.PDZ T cells had greater antitumor activity in comparison to standard CAR T cells (Figure 6d–i). Notably, we observed full tumor eradication in our DIPG7c model only in by CAR.PDZ T cells (Figure 6h,i). CAR.PDZ T cells also had greater antitumor activity (Figure 6j) in the 143b model, resulting in improved survival in comparison to mice treated with standard CAR T cells (Figure 6k–i). We did not observe off-target toxicities in any studies; however, directed studies will need to be performed in the future to fully ascertain this potential. Overall, adding a PDZbm to a CAR enhances not only the effector function of CAR NK but also CAR T cells.
DISCUSSION
We selected to exploit the naturally occurring cell polarity requirements for immune cell recognition of target cells. Cell polarity is a tightly regulated process that has limited targets to augment without unintended consequences. To this end, we found that the extant PDZbm of CRTAM would be an ideal candidate to explore for our synapse tuned design. Further, the current biological understanding of CRTAM is that it is a late phase polarity protein that aids in cell signaling after antigen recognition. We hypothesized that by accelerating this process we would create a more efficient signaling CAR and imbue effector cells with enhanced functionality and longevity.
Persistence has been long thought as a hurdle of NK cell therapies, and many investigators are working on deciphering and attempting to solve this problem29, including engineering NK cells to express IL-15, priming NK cells with cytokines to induce a “memory-like” phenotype, or culturing NK cells with various ligand expressing feeder cells30 to enhance persistence. Our culturing system involves low dose interleukin (IL)-2, 10IU/mL, and a single, initial feeder cell stimulation. Utilizing a low stimulation level, putatively, reduces the potential for dependence on high levels of cytokine to maintain growth and survival post adoptive transfer into a harsh environment. However, directly tracking and assessing NK cell persistence needs to be performed to fully ascertain if enhanced NK cell survival occurred in vivo. Additionally, we hypothesize that adding this domain to the C-terminal of other endogenous receptors, such as CD16, may enhance antibody-based therapeutics through antibody dependent cellular cytotoxicity.
NK cells have been derived from peripheral blood (PB)31, cord blood (CB)32, induced pluripotent stem cell (iPSC)33, or existing cell lines, e.g. NK9234. NK cells derived from these sources have been evaluated in clinical studies with an encouraging safety record to date30,35. We focused in our study on PB-derived CAR NK cells since they are readily available from healthy donors. PB has been largely overlooked as a CAR NK cell source, especially in the context of solid tumor-redirected CAR NK cell therapy36. For example, there are only a few preclinical publications that report in vivo experiments, all of which utilized repeat dosing regimens, high dose cytokine supplementation, or both36. Thus, our encouraging results should provide impetus for the active exploration of PB-derived CAR NK cells. NK cells, regardless of source, need migratory, polarization, and internal scaffolding programs to be effectively employed as anti-cancer therapeutics.
Thus, our developed CAR.PDZ should enhance the effector function of all NK cell products. Further studies to cross compare and modulate alternate NK-specific endodomain based CARs will be needed to fully define the role of PDZbms in NK CAR applications. Finally, since PDZbms and their interactions with scaffolding proteins is evolutionarily conserved, it is likely that PDZbms will enhance the effector function of other CAR-expressing immune cells, including T cells as we have shown, that are actively being explored as immunotherapeutics. We speculate that our new synapse-tuned CAR design will enhance antigen sensitivity and, putatively, reduce the risk of cancer immune evasion by antigen loss37, which contributes to the low overall response rate of CAR T cell therapies for solid tumors38,39. However, further refinement and optimization of PDZbms for CAR cell therapies will most likely be necessary to yield the optimal benefit of synapse-tuned CARs.
CONCLUSIONS
Exploration into CAR synapse tuning is at present a sparsely populated field with studies observing differences between various standard CAR designs such as bi-specific CARs40,41 and CARs with different costimulatory domains42,43. Our study reveals distinct advantages by adding a domain designed to augment the synapse. A plethora of research has been performed in optimizing CAR designs looking at external factors such as single chain variable fragment affinity and which costimulatory domain compliments the overall activation domain. However, these efforts have been in the context of an inefficient synapse. Orienting our focus to the inside of the cell to determine optimal organization of the synapse takes an orthogonal and complimentary approach to current research efforts. Re-evaluating previously discarded CAR designs with a different lens of synapse tuning may give life to previously shelved ideas. In conclusion, we demonstrate that an optimal CAR endodomain might not only have to include costimulatory and activation domains, but also a PDZbm-based ‘anchoring domain’. Thus, synapse tuning via anchor domains represents a fertile realm to explore for CAR-based immunotherapies.
METHODS
Cell Lines
143b osteosarcoma and A549 lung cancer cell lines were obtained and grown as per American Type Culture Collection (ATCC, Manassas, VA, USA) instructions. LM7, a metastatic osteosarcoma cell line, was provided by Dr. Eugenie Kleinerman (MD Anderson Cancer Center, Houston, Texas, USA) in 2011. The generation of LM7 cells expressing an enhanced green fluorescent protein firefly luciferase fusion protein (LM7.eGFP.ffLuc) was previously described44. K562 with modified membrane bound IL-15 and 4–1BB ligand45, feeder cells, were a generous gift from Dr. Dario Campana (National University of Singapore) and grown in IMDM media with 10% fetal bovine serum (FBS; Hyclone Laboratories, Chicago, IL, USA). The EphA2 KO A549 cell line was generated with CRISPR/Cas9 technology using a published method46. HSJD-DIPG007 (DIPG007) cells were cultured as described previously47. DIPG7c cells were cultured as previously described48. Cell lines were validated with short tandem repeat profiling performed by ATCC.
Generation of Retroviral Vectors
The generation of the SFG retroviral vectors encoding EphA2-CARs with a CD28 costimulatory domain (CAR), a nonfunctional EphA2-CAR without a signaling domain (CAR Δ) were previously described17. B7-H3 CARs were generated similar and previously described24. In-Fusion cloning (Takara Bio, Kusatsu, Shiga, Japan) was used to generate the CAR.PDZ with a PDZbm attached to the C-terminus of CD3ζ domain and site directed mutagenesis Q5(New England Biolabs, Ipswich, MA, USA) was used to do a point mutation to exchange the final Valine to an Alanine to create the CAR.PDZmut construct.
CAR.PDZ additional sequence containing PDZbm:
HPMRCMNYITKLYSEAKTKRKENVQHSKLEEKHIQVPESIV*
CAR.PDZ additional sequence containing mutated PDZbm:
HPMRCMNYITKLYSEAKTKRKENVQHSKLEEKHIQVPESIA*
The sequence of the final construct was verified by Sanger sequencing (Hartwell Center, St. Jude Children’s Research Hospital). Retroviral particles were generated as previously described49 by transient transfection of HEK293T cells (ATCC) with the EphA2-CAR encoding SFG retroviral vectors, Peg-Pam-e plasmid encoding MoMLV gag-pol, and a plasmid encoding the RD114 envelope protein. Supernatants were collected after 48 hours, filtered, and snap-frozen for later transduction of NK cells.
NK cell Activation, Expansion, and Genetic Modification
Human peripheral blood mononuclear cells (PBMCs) were obtained from whole blood of healthy donors under an IRB approved protocol at St. Jude Children’s Research Hospital (St. Jude), after informed consent was obtained in accordance with the Declaration of Helsinki, or from de-identified elutriation chambers of leukapheresis products obtained from St. Jude donor center. Donors were less than haplo-identically matched by HLA typing. Cells were subjected to ACK Red Blood cell lysis and Ficoll Hypaque (Sigma-Aldrich, St. Louis, MO, USA) gradient separation. Cellular subtype analysis was performed with BD whole blood analysis kit on a BD Lyric flow cytometer (Becton-Dickinson, Franklin Lakes, NJ, USA). PBMCs were depleted of CD4 and CD8 using standard MACs magnetic beads (CD4: 130-045-101, CD8: 130-045-201, Miltenyi Biotec, Bergisch Gladbach, North Rhine-Westphalia, Germany). Cells were aliquoted in freezing media with 10% DMSO at 1×10⁷ cells per mL and stored in liquid nitrogen vapor phase until use. 150 Gray cesium-irradiated feeder cells were added to thawed CD4/8-depleted PBMCs at a ratio of 5–10:1 feeder to NK cells. Cells were grown in Stemcell Genix (20802-0500, Cellgenix, Portsmouth, MA, USA) growth media with 20% FBS and 10 units/mL of IL-2, (Peprotech, Rocky Hill, NJ, USA) (complete growth media). After 5–7 days cells were phenotyped and used for downstream experiments.
Genetically modified NK cells were generated as follows: Supernatants containing retroviral particles encoding CAR constructs were spun at 2000g in retronectin (T100B, Takara Bio) coated non-tissue culture 24-well plates for 90 minutes. Supernatants were removed and 250,000 NK cells were seeded per well in a volume of 1 mL of complete growth media. NK cells were incubated for 24 hours and then removed and cultured in complete growth media. Modified NK cells were expanded in G-Rex 6 well plates for 10–14 days (#80240MWilson Wolf, New Brighton, MN, USA). NK cell transgene expression was assessed 3–7 days post-transduction.
T cell Activation, Expansion, and Genetic Modification
CAR T cells were generated via isolating PBMCs by Lymphoprep (Abbott Laboratories) gradient centrifugation and then stimulated on precoated non–tissue culture–treated 24-well plates with CD3 and CD28 antibodies (αCD3/αCD28; CD3: OKT3, CD28: 15E8; Miltenyi Biotec). The following day, rhIL-7 and rhIL-15 (IL-7: 10 ng/mL; IL-15: 5 ng/mL; PeproTech) were added in complete growth media RPMI (Gibco) with 10% FBS (Hyclone) and 1% Glutamax (Gibco). T cells were transduced in the same manner as NK cells detailed previously. On day 5, transduced T cells were transferred into new tissue culture 24-well plates and subsequently expanded with IL-7 and IL-15. Untransduced T cells were prepared in the same way except for the addition of retrovirus. CAR T cell expression was determined using flow cytometry on numerous days post-transduction.
Flow Cytometry
250,000 NK or T cells were collected and washed twice in DPBS. Surface EphA2 or B7-H3-CAR detection was determined via immunolabeling with anti-F(ab’)2-AF647 (109-606-006, Jackson Labs, Bar Harbor, ME, USA; 1:100), was utilized for detection on a BD FACS Lyric or CANTO machine and analyzed with FlowJo v10 (BD). Immunophenotyping antibodies are listed in supplemental table 1.
Single Cell Secretomics Assay
Briefly, 100,000 NK cells were labeled with cell trace violet 1:500 (ThermoFisher Scientific, Waltham, MA, USA), and co-cultured at a 2:1 ratio with A549 targets for 4-hours in a 48 well plate. We found that 24-hour co-cultures resulted in increased tumor cell death and reduced cytokine detection. NK cells were removed and washed twice with PBS and resuspended in complete growth media without IL-2. These cells were loaded onto a IsoCode single cell secretomic chip and run on the IsoLight machine that detects 32 distinct proteins50. Results were analyzed on IsoSpeak version 2.8.1.0 (IsoPlexis, Branford, CT, USA).
Cytokine Analysis
CAR T cells were incubated with various cancer cell lines for 24-hours at a 2:1 ratio. The supernatant from these co-cultures were then assessed using MILLIPLEX (MilliporeSigma, CAT: HCYTA-60K) and run on a FLEXMAP 3D (Luminex, Austin Texas, USA)
Cytotoxicity Assays
NK cells were cytokine starved for 24-hours prior to co-culture with target cells to reduce non-specific killing of target cells. 3,000 target (A549) cells were cocultured with effectors at indicated effector to target (E:T) ratios for 24-hours in a 96 well plate. Cytotoxicity was quantified by a chromogenic MTS assay measured on a plate reader (Tecan, Männedorf, Switzerland) detecting remaining viable adherent tumor cells.
Peptide Blockade
Peptides were synthesized by the Macromolecular Synthesis Core (Harwell Center, St. Jude) purity was 97% and 95% via HPLC, respectively:
Negative Control Sequence: NH2-RQIKIWFQNRRMKWKKRSWFEAWA-COOH
Scribble PDZ Blocking Sequence: NH2-RQIKIWFQNRRMKWKKRSWFETWV-COOH
Underlined portions of sequences are from the Antennapedia protein which has been shown to allow peptide shuttling into cells and effectively block CRTAM binding51. NK cells were treated with 10micromolar of peptides for 24-hours prior to co-culture.
Confocal Microscopy
Ag-coated coverslip preparation and NK activation:
Antigen coated coverslips were prepared using N1 coverslips (Fischer Scientific: #12-545-80P), which were coated with 0.5 μg/mL of rhEphA2 (R&D Systems, Minneapolis, MN, USA: #3035-A2-100) or poly-L-lysine (Sigma: #P4707) overnight at 4°C. Then, they were washed with PBS and filled with media until NK cell seeding. 200,000 NK cells were plated onto the precoated coverslips at different time points in a cell culture incubator (37°C/5%CO2). After activation, NK cells were washed with cold PBS and fixed with 4% paraformaldehyde (PFA, Electron microscopy sciences #15710) for 10 minutes at room temperature. Fixed cells were washed twice with PBS and the remaining PFA was inactivated with blocking buffer (PBS-2% BSA (Sigma: #A9418), 1.5M Glycine (Sigma: #G8898)) for 10 min at room temperature. Cells were permeabilized by adding permeabilization buffer (PBS, 0.2%BSA, 0.05%Saponin; Sigma: #47036) for 20 minutes at room temperature. Cells were washed twice with permeabilization buffer prior primary antibody incubation diluted in permeabilization buffer, following manufacturer instructions. All the primary antibodies were incubated at 4°C overnight. Cells were washed with permeabilization buffer and incubated with secondary antibodies for 2-hours at room temperature. Finally, cells were washed with permeabilization buffer and PBS before to let them dry for 1-hour at room temperature. Then, coverslips were mounted onto slides using fluoromount (Thermofisher Scientific: #00-4958-02).
Antibodies and probes:
Primary antibodies and probes with their dilutions: Anti-human Lamp1 (1:50) (Abcam: #ab25630), Anti-Human pZAP70 (1:50) (Cell Signaling Technology: #2701L), (Abcam: Ab6160), Phalloidin-AlexaFluor647 (1:200) (Thermofisher Scientific: #A22287), Anti-Human CD3e-AlexaFluor 647 (1:100) (Biolegend: #300422), Anti-Human Scribble (1:100) (Cell Signaling Technology, Danvers, MA, USA: #4475), Anti-WASp (1:100) (AbCam: #ab75830). Secondary antibodies with their dilutions: Anti-Rabbit AlexaFluor 488 (1:200) (Thermofisher Scientific, #A32731), Anti-Mouse AlexaFluor 568 (1:200) (Thermofisher Scientific, #A-11004).
Image acquisition and analysis:
Images were acquired in a spinning disc confocal microscope (Zeiss Axio Observer with CSU-X spinning disc), and the processing and analysis was performed with FIJI (ImageJ) software52. Single cell images shown in the figures were cropped from larger field. Image brightness and contrast was manually adjusted. To analyze lysosome and pZAP70 distribution in the immune synapse, cell borders were automatically delimited by using WEKA53. To segmentate every single cell using F-actin signal as a template (CellTemp), an ellipse was automatically determined (CenterTemp) at the center of the CellTemp, which had a third of the CellTemp area. The recruitment at the center of the IS was calculated by dividing the fluorescence normalized by its area from CenterTemp and CellTemp, subtracting 1. Therefore, positive values mean that the fluorescence is enriched at the center, whereas negative values mean peripheral enrichment. NK cells were normalized to the unstimulated conditions to achieve pZAP70 and Lamp1 scores.
Live cell Calcium imaging:
150,000 tumor cells were seeded onto μ-slide 8 well chambers (ibidi, Gräfelfing, Germany) (ibidi#80807) and incubated overnight at 37°C and 5% CO2. Tumor cells were labeled with CellBrite® Green membrane dye (Biotium Inc, Fremont, CA, USA) (1:2000) (biotum#30021) for 30 min and then washed and maintained in RPMI until image acquisition. 2×10⁶ CAR NK or T cells were resuspended in 1mL of PBS and labeled with CAL520 (1:500) (ATTbioquest#21130) and celltrace violet (1:1000) (Thermofisher #C34557) for 1 hour and then washed and maintained in RPMI until image acquisition.
3×10⁵ CAR immune cells were added to each well preloaded with tumor cells, and the image acquisition was initiated upon immune cellsdetection in the visual field. Images were acquired in a spinning disc confocal microscope (Zeiss Axio Observer with CSU-X spinning disc), using a 63X objective. The acquisition parameters were a 4D image (60 min of acquisition with 1 min of frame, and 20μm of height with a Z-step of 1μm).
The processing and analysis were performed with FIJI (ImageJ) software. Cell tracking and calcium influx were performed by using Trackmate plugin54 with WEKA segmentation. All tumor and CAR immune cell interaction were recorded, and calcium influx was measured as the maximum fluorescence emitted by CAL520 signal, and it was normalized by its value before the first peak of calcium influx upon tumor interaction.
Live cell Synapse imaging:
Similar to the calcium flux analyses previously described, tumor cells were labeled with cell trace FarRed (Thermofisher) (1:1000) for 20minutes. Individual fluorescent channel image stacks were isolated and a synaptic channel was created by assessing the overlap of the tumor and immune cells through time and space. This new channel was then quantified for total synapse surface area.
Single Cell Avidity Assay
Briefly, A549 or LM7 cells were seeded into a poly-L-lysine (Sigma) coated piezo chip from LUMICKS. A549 and LM7 cells adhered for 2-hours. NK cells were labelled with celltrace FarRed (ThermoFisher) at 1:1000 dilution. The A549 or LM7 laden piezo chip was loaded onto the z-MOVI single cell avidity analyzer. Labelled NK cells were injected into the chip and allowed to incubate on the A549 or LM7 cells for 5 minutes. After this time, NK cells were subjected to increasing acoustic force ramp from 0 to 1000pN over 2 minutes and 30 seconds. Individual cells were observed and the exact force requirement for detachment was recorded based on the individual cell leaving the focal plane.
Halo Tumor Invasion Assay
Briefly, NK cells were stained with CellBrite® Green membrane dye (Biotium Inc) according to manufacturer’s instructions. They were then resuspended in a 4:3 vol:vol mixture of reduced-growth factor Matrigel (Corning, Glendale, AZ, USA) and complete RPMI without cytokines (halo matrix) at a concentration of 2×10⁵ effector cells per 5μL halo matrix. The halo matrix and resuspended cells were plated manually in a ring around the periphery of a 96-well tissue-culture treated plate (Corning) Next, 1.5% rat-tail collagen I was prepared from 3% stock (ThermoFisher Scientific), 1N NaOH, 10X PBS, and complete RPMI. 143B cells expressing mCherry were then resuspended in 1.5% collagen at a concentration of 1×10⁵ cells/1μL 1.5% collagen. An E3X Repeater® pipette (Eppendorf) with a 0.1mL Combitip advanced pipette tip was used to dispense 1μL of resuspended 143B cells in a droplet in the center of each well. After collagen and gel solidification, complete media was then layered on top for imaging with an Incucyte S3 live-cell analysis system (Sartorius, Göttingen, Germany). Imaging was performed every hour at 4X magnification using red, green, and bright field channels. For analysis, homing of effector cells was defined as the total green area in μm2 per image; the central tumoroid control was defined as percent total red area (μm2) per image normalized to hour 1 post initiation of scanning.
In Vivo Tumor Models
Animal experiments followed a protocol approved by the St. Jude Institutional Animal Care and Use Committee. All experiments used 8- to 9-week female or male NSG mice obtained from the St. Jude NSG colony. Mice were euthanized when they reached our tumor burden limit or when they met physical euthanasia criteria (significant weight loss, signs of distress) or when recommended by St. Jude veterinary staff.
Sub-cutaneous tumor models:
A549 cells were injected subcutaneously at 2×10⁶ cells per 100μL of Matrigel(Corning #356230) into the dorsal flanks of NSG mice. 10×106 NK cells per mouse were injected intravenously on day 14. Tumor volume was calculated with the modified ellipsoidal equation (LxWxW)/2 every 5 days and mice were euthanized upon reaching a tumor volume limit of 3000mm3 or for humane reasons determined by St Jude veterinarians. 143b cells were injected subcutaneously at 1×10⁶ cells per 100μL of Matrigel into the dorsal flanks of NSG mice. 10×106 cells per mouse were injected intravenously on day 5 or 7 when tumors were established. Tumor volume was calculated with the modified ellipsoidal equation (LxWxW)/2 every 5 days and mice were euthanized upon reaching a tumor volume limit of 2500mm3 or for humane reasons determined by St. Jude veterinarians.
Locoregional LM7 osteosarcoma model:
1×10⁶ LM7.eGFP.ffLuc expressing cells were injected intraperitoneally (i.p.) into the peritoneal cavity of NSG mice. 10×106 NK cells per mouse were injected intraperitoneally on day 7. Mice were then imaged weekly. For imaging, mice were injected i.p. with 150 mg/kg of D-luciferin 5–10 minutes before imaging, anesthetized with isoflurane, and imaged with a Xenogen IVIS-200 imaging system (PerkinElmer, Waltham, MA, USA). The photons emitted from the luciferase-expressing tumor cells were quantified using Living Image software (Caliper Life Sciences). Total emitted photon flux (photons per second: p/s) was used to determine tumor burden and mice were euthanized upon reaching 1×10¹⁰ p/s.
Locoregional patient derived orthotopic xenograft models DIPG00755 and DIPG7c48:
Briefly, PDOX models were implanted intracranially with a stereotactic device into the right hemisphere cerebral striatum of NSG mice in 2μL of Matrigel(Corning). Mice were then imaged weekly for tumor establishment and treated 7 days later. 2×10⁶ T cells were injected intracranially in 2 μL of PBS at the tumor site location. DIPG007 NET AUC indicates the area under the curve from the baseline tumor flux value to day 47. Thus, negative values indicate tumor control and positive values are tumor growth.
Used Software
IsoSpeak v2.8.1.0, GraphPad Prism v9, FlowJo v10, Fiji, Incucyte 2020A, Living Image, Oceon 1.2.1, WEKA, Trackmate v7
Statistical Analysis
Statistical analysis was performed using Graphpad Prism v9.4.1. Comparisons between two groups were determined by unpaired, two-tailed, Student’s t-Test if deviations were significantly different Welch’s Correction was used. Three or more group comparisons were performed with One-Way ANOVA or Two-Way ANOVA with Brown-Forsthye and Welch’s Correction or Uncorrected Fisher’s LSD or Two-stage linear step-up procedure of Benjamini, Krieger and Yekutieli to correct for false discovery rates (FDR). The FDR method includes the p value variance to help control for false positives and determine true discoveries based on a q value threshold <0.05. Tests are indicated in each figure legend and what value is being shown along with exact values indicated in the graphs.
Extended Data
Extended Data Figure 1: Primary NK cell transduction efficiency.
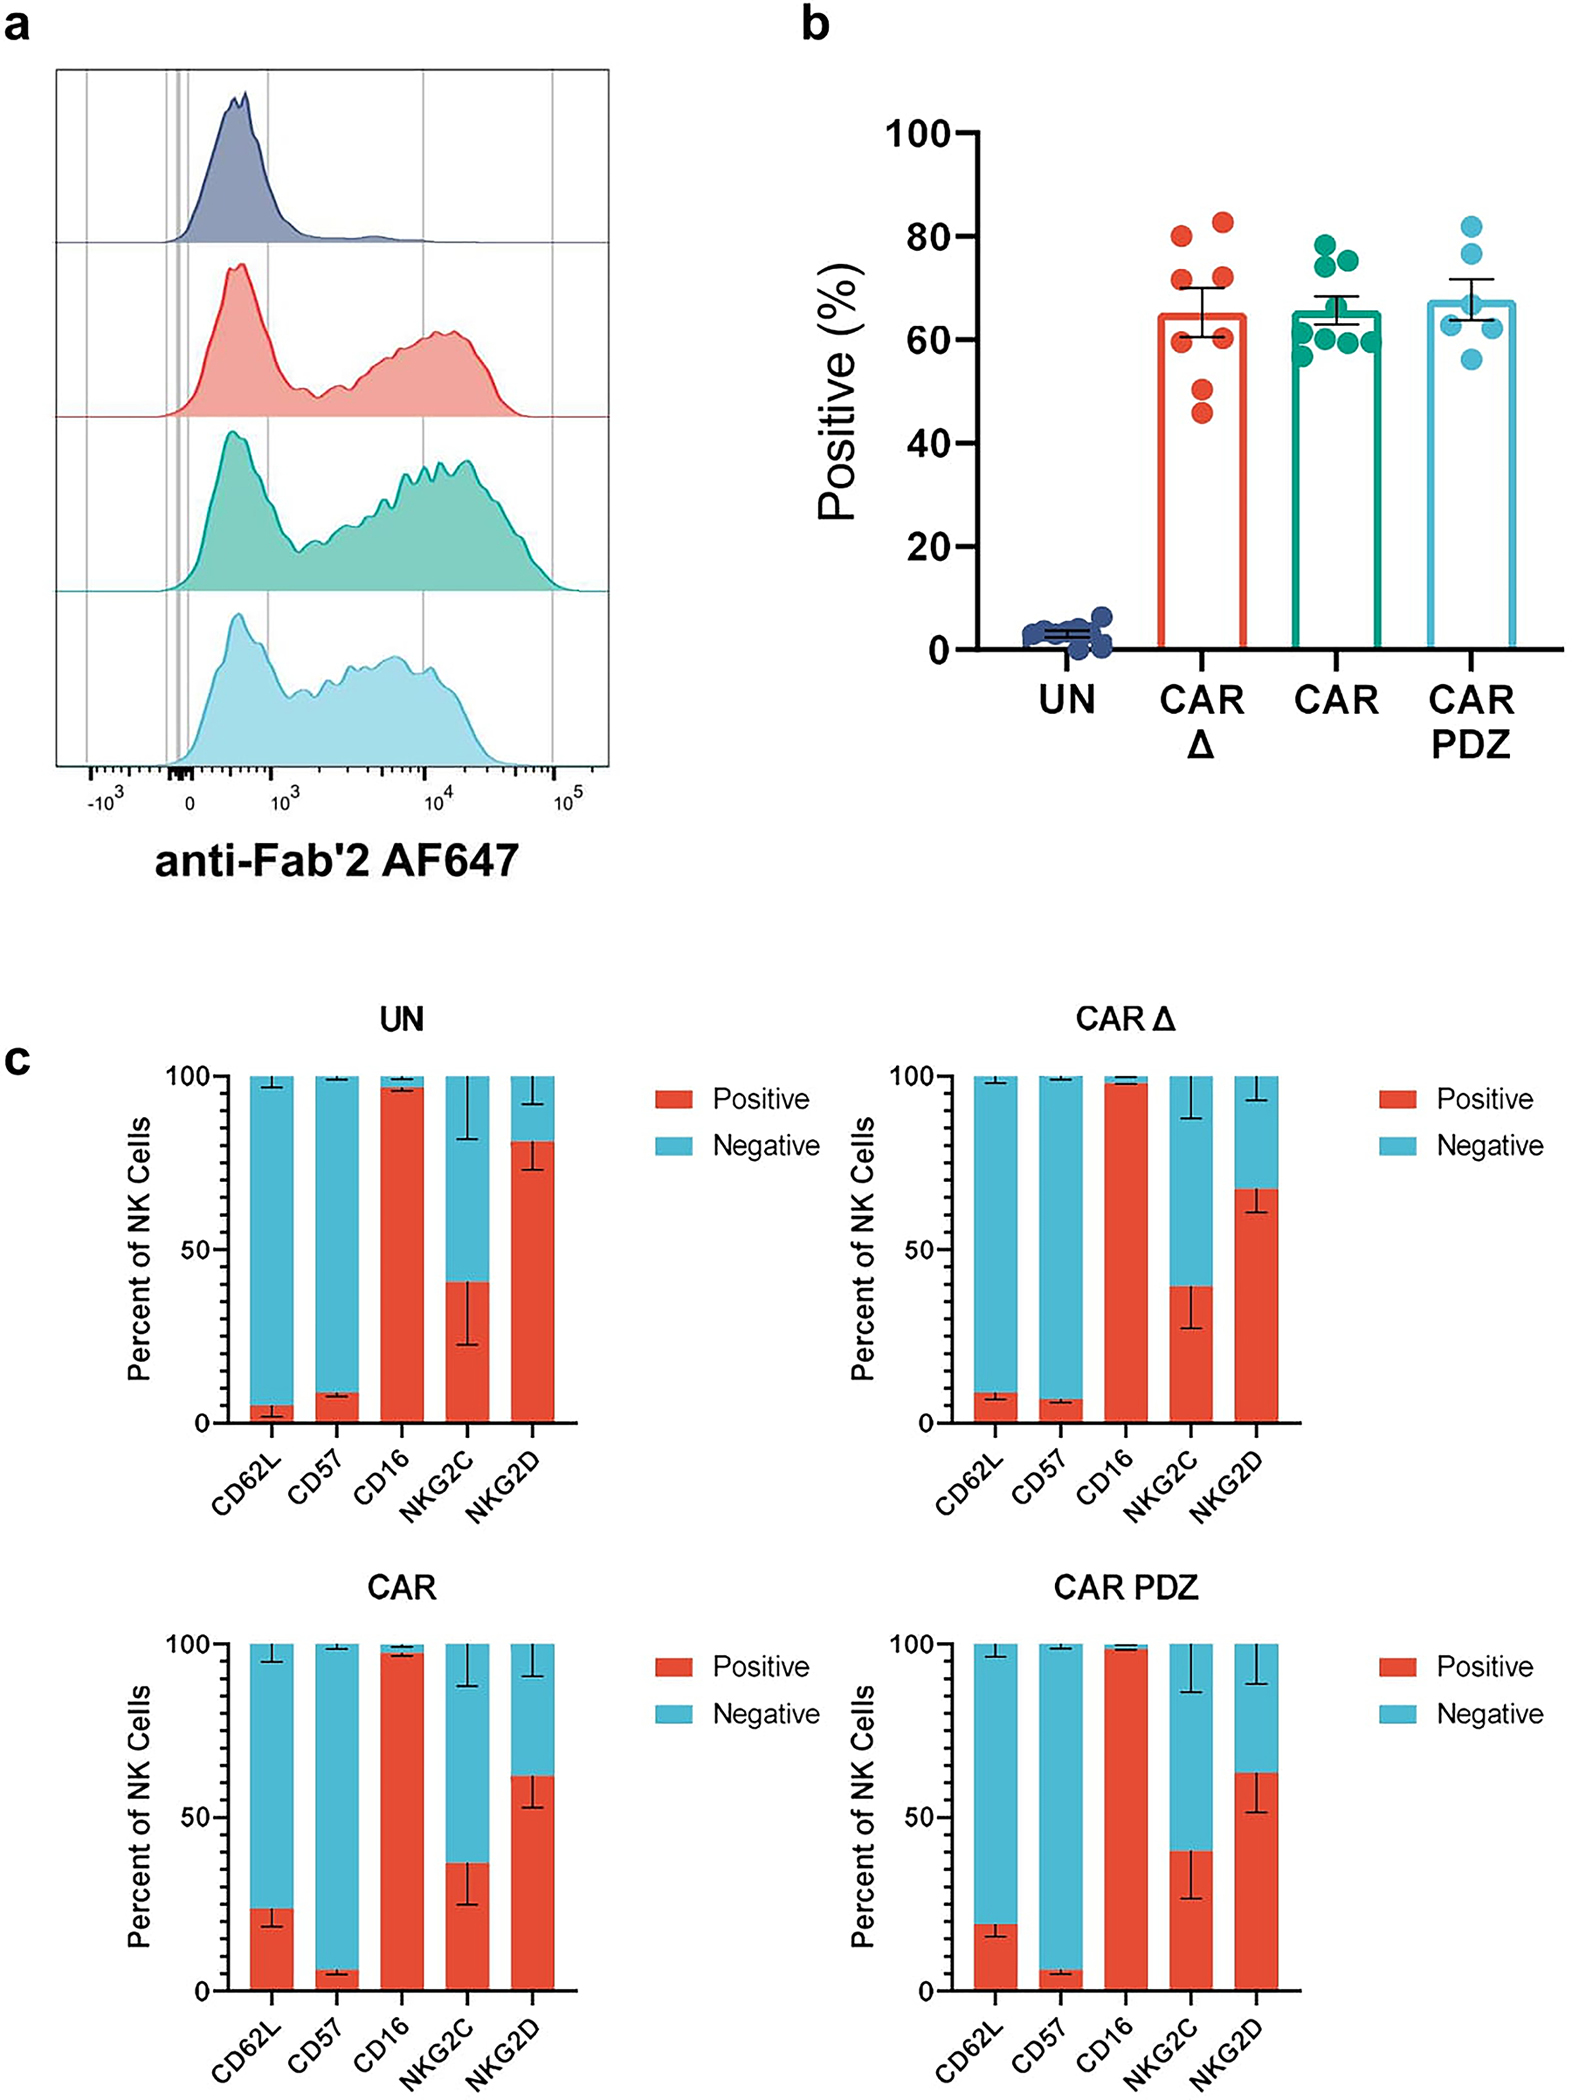
(a) Representative flow cytometry histogram plots detailing surface CAR expression.
(b) Quantified flow cytometry data showing percent CAR positive NK cells of various donors. UN: n=9, CAR Δ: n=8, CAR: n=9, CAR.PDZ: n=6 donors, mean±SEM shown.
(c) Immunophenotype of NK cells via flow cytometry. n=4 donors, mean±SEM shown.
Extended Data Figure 2: Scribble Polarization at 30 minutes.
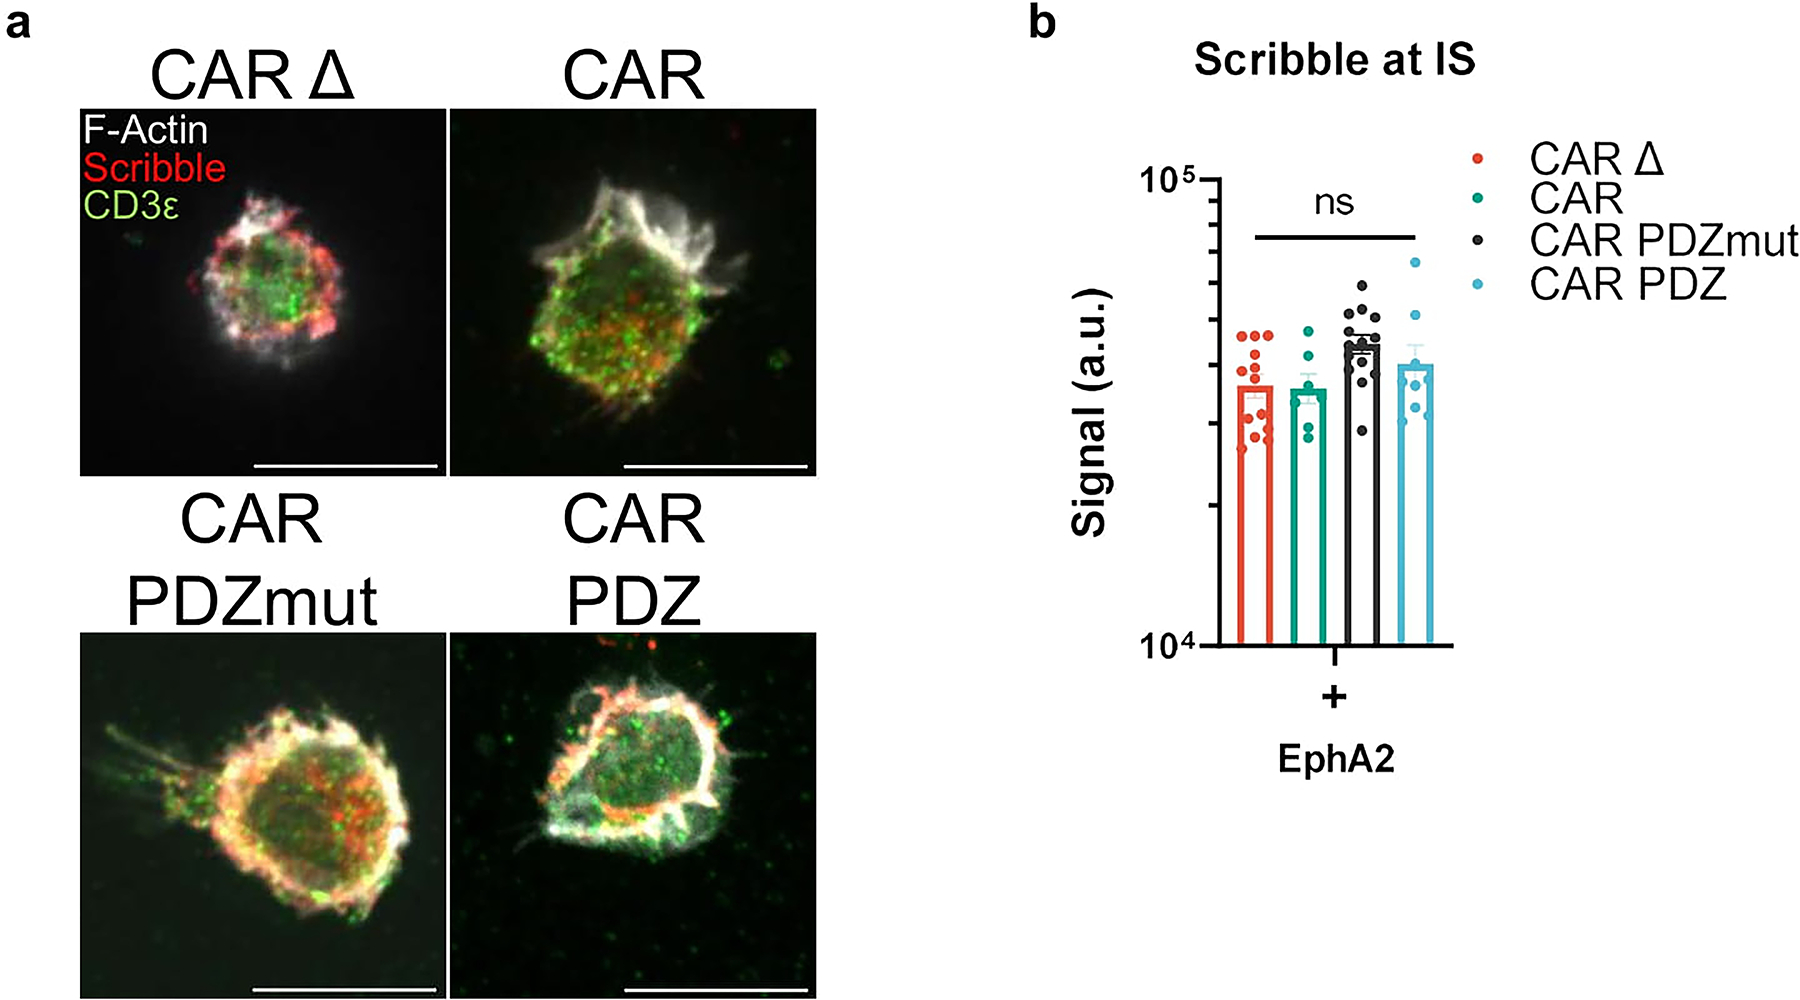
(a) Confocal images as prepared in (Figure 1) incubated for 30minutes with NK cells in various groups quantified in (b). White bars indicate 10microns. Immunolabelling of Scribble in red, CD3ε in green, and filamentous actin (F-actin) in white.
(b) Scribble polarization and accumulation at the immune synapse (IS). CAR Δ; n=13, CAR; n=7, CAR.PDZmut: n=14, CAR.PDZ n=9, One-Way ANOVA was used to determine statistical significance with Two-stage linear step-up procedure of Benjamini, Krieger, and Yekutieli to correct for FDR. mean±SEM shown of one donor.
Extended Data Figure 3: WASp Polarization at 15 and 30 minutes.
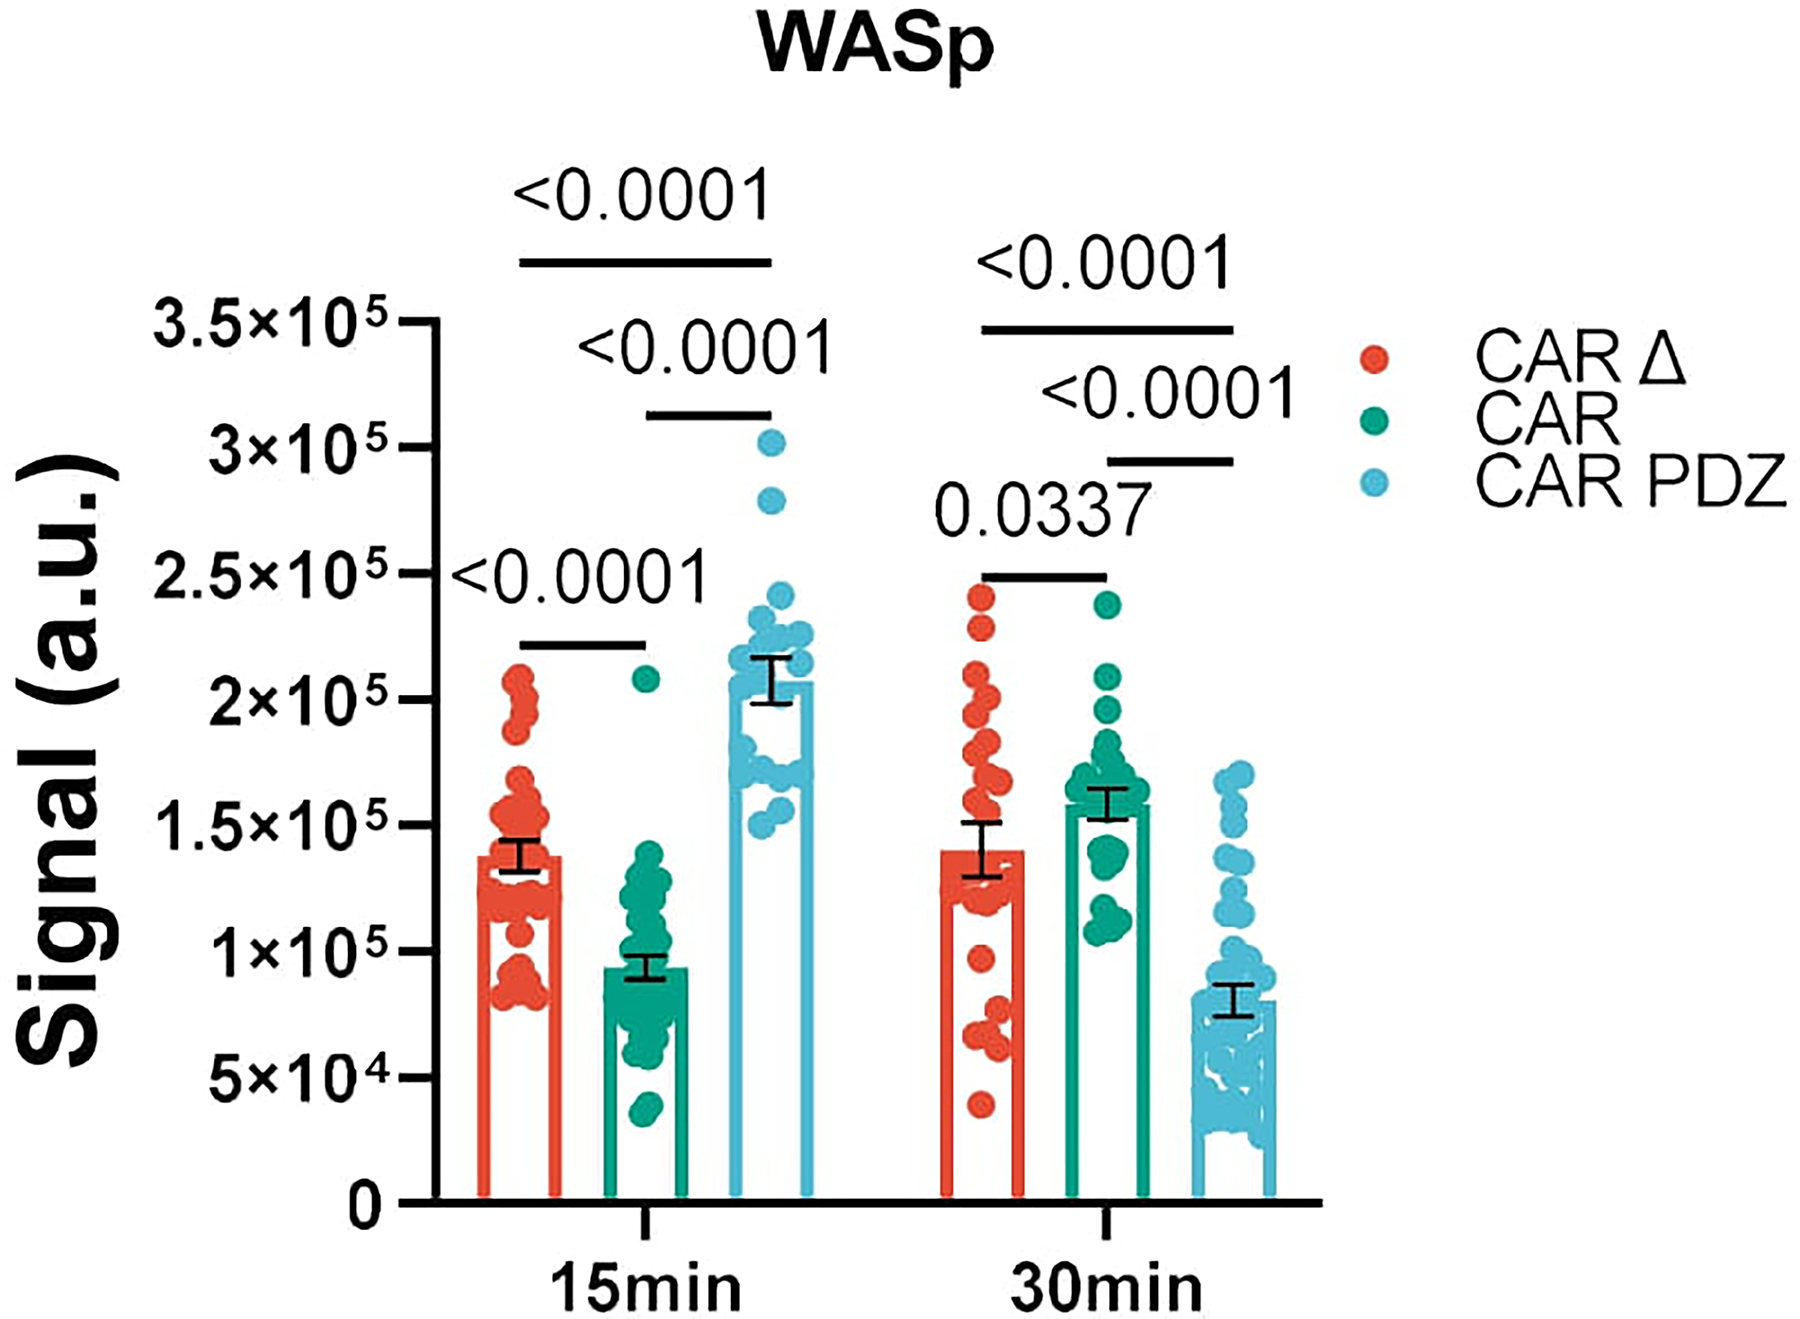
Confocal images as prepared in (Figure 1) incubated for 15 and 30 minutes with NK cells in various groups. Quantified WASp polarization and accumulation at the immune synapse (IS). CAR Δ; n=34 and 25, CAR; n=42 and 25, CAR.PDZ n=19 and 39, for 15 and 30 minutes, respectively. Two-Way ANOVA was used to determine statistical significance with Two-stage linear step-up procedure of Benjamini, Krieger, and Yekutieli to correct for FDR. Statistical difference delineated by q<0.01 *, q<0.0001 ****; mean±SEM shown of one donor.
Extended Data Figure 4: Live NK cell imaging reveals lysosomal condensing and enhanced synapse formation with increased calcium Flux.
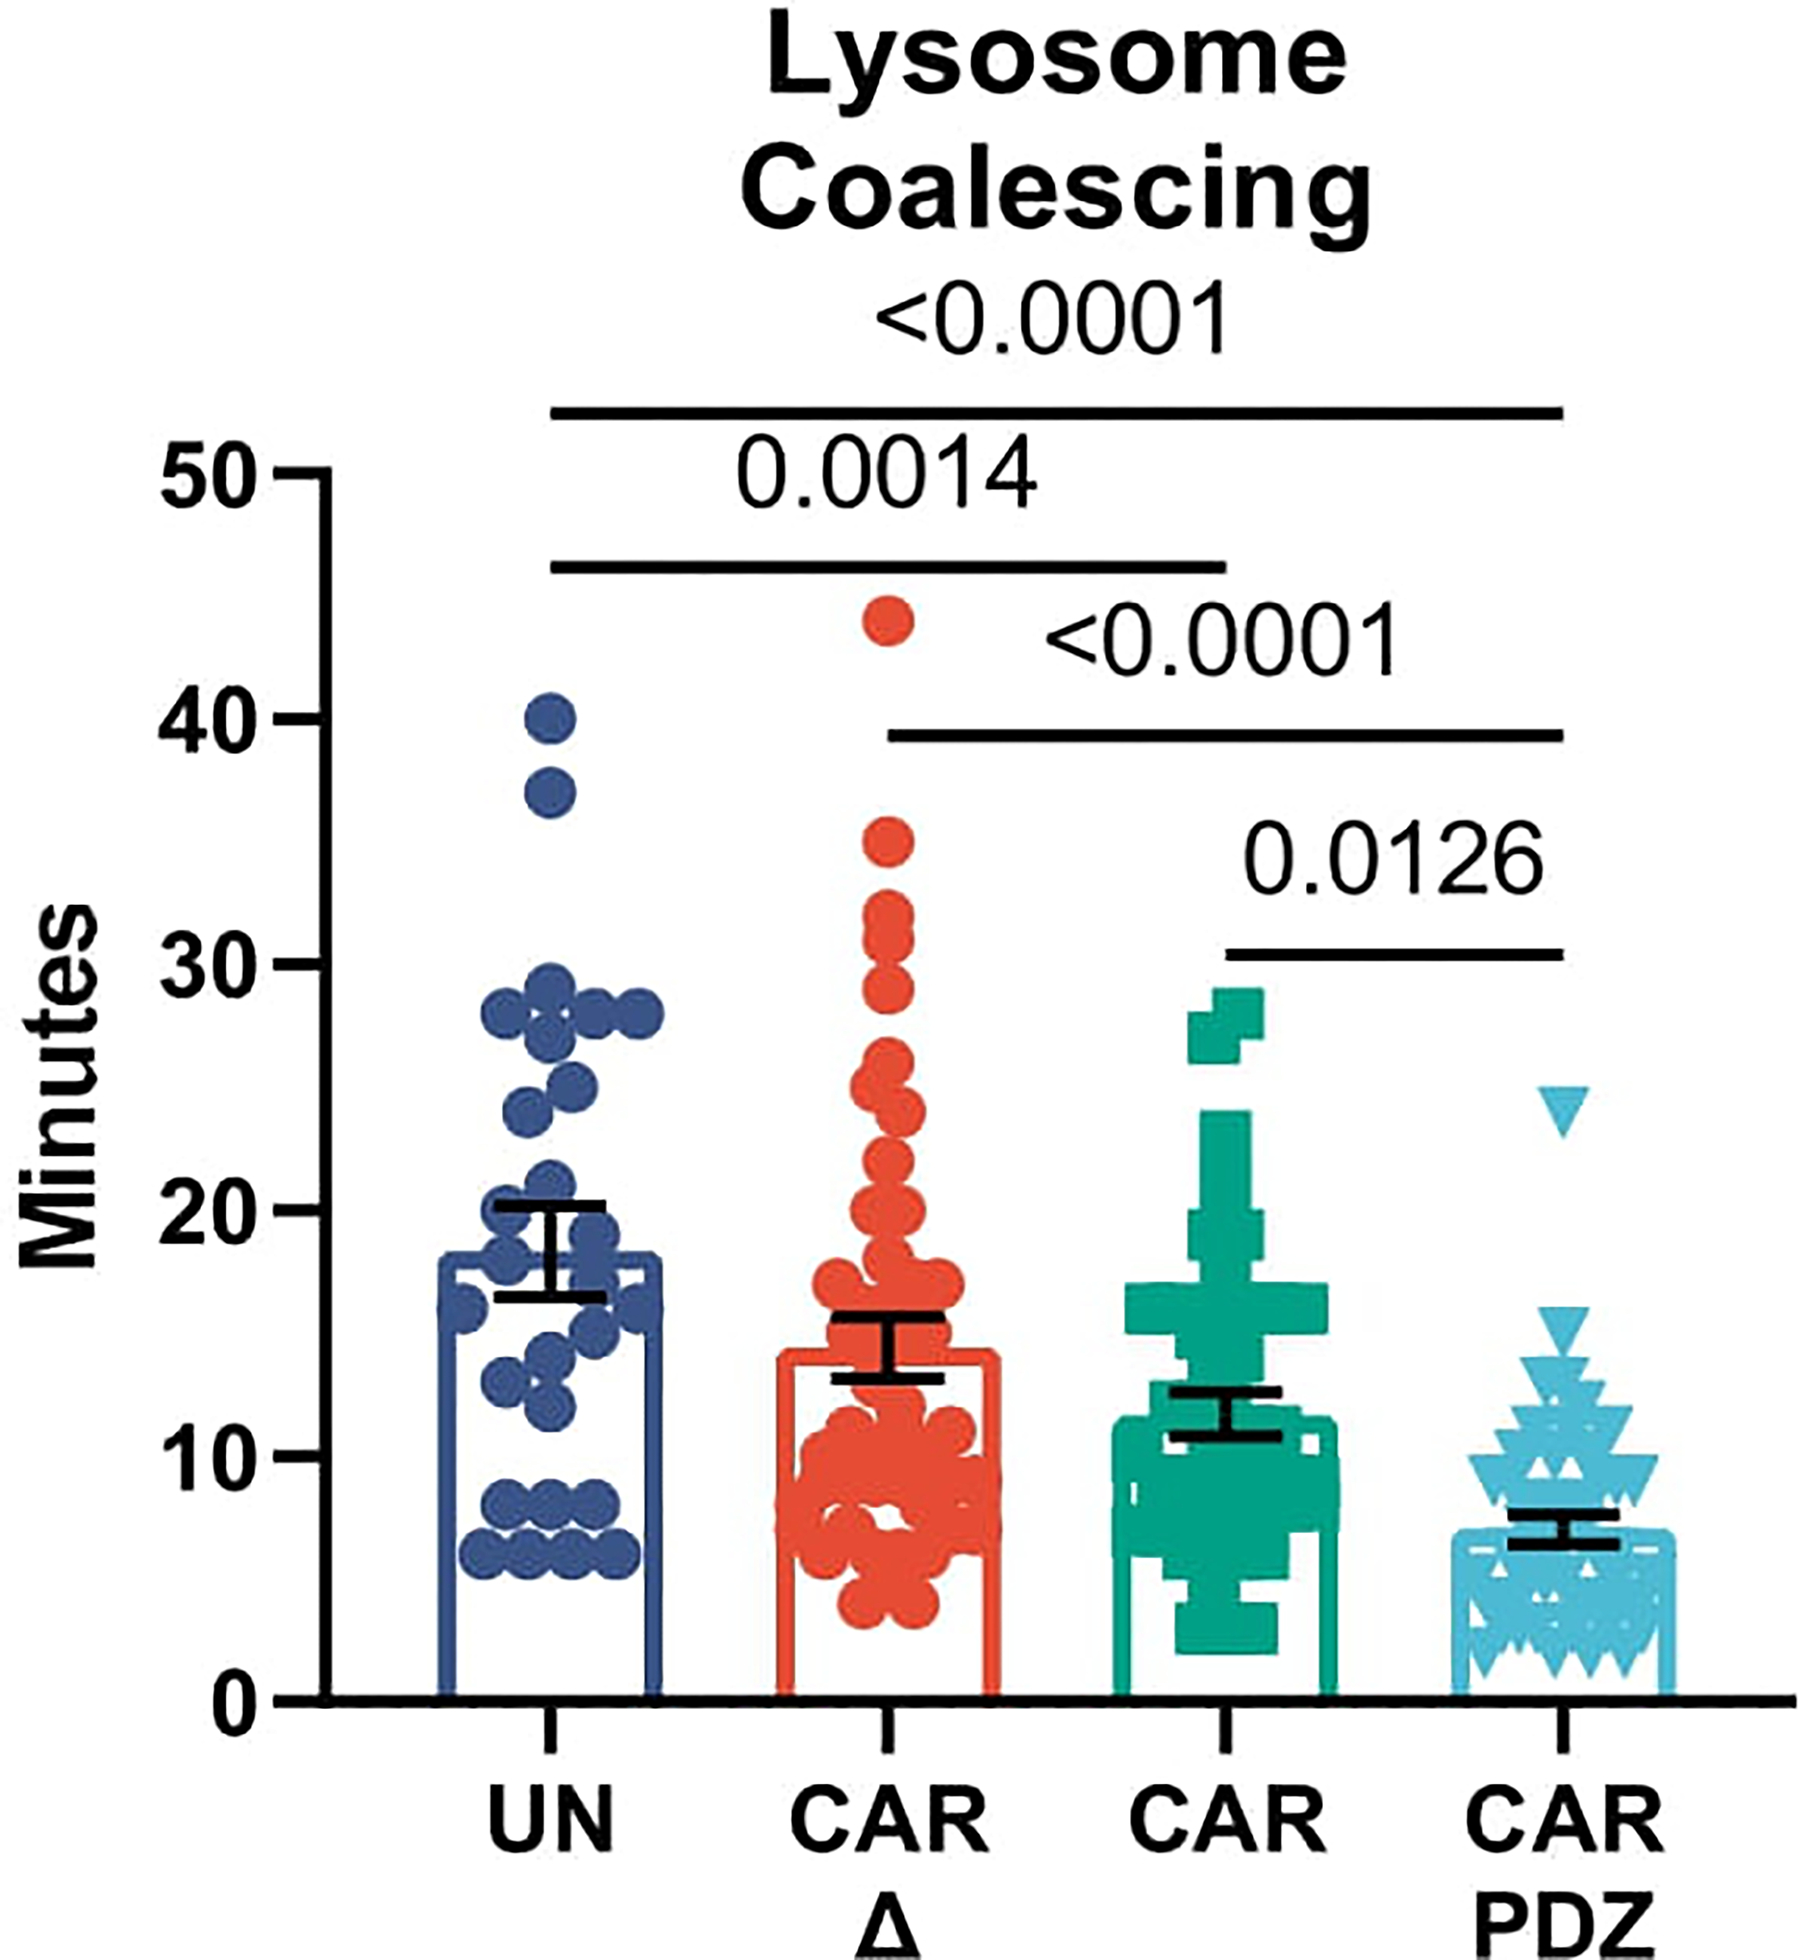
Lysosomal coalescing from live cell imaging in Figure 2g EphA2 targeting CARs UN; n=27, CARΔ; n=48, CAR; n=44, CAR.PDZ; n=48 cells. Peak lysosome signal was measured from the first calcium flux peak in each condition. One-Way ANOVA was used to determine statistical significance with Two-stage linear step-up procedure of Benjamini, Krieger and Yekutieli to correct for FDR; mean±SEM shown of one donor.
Extended Data Figure 5: LM7 Avidity assessment with EphA2 targeting CARs.
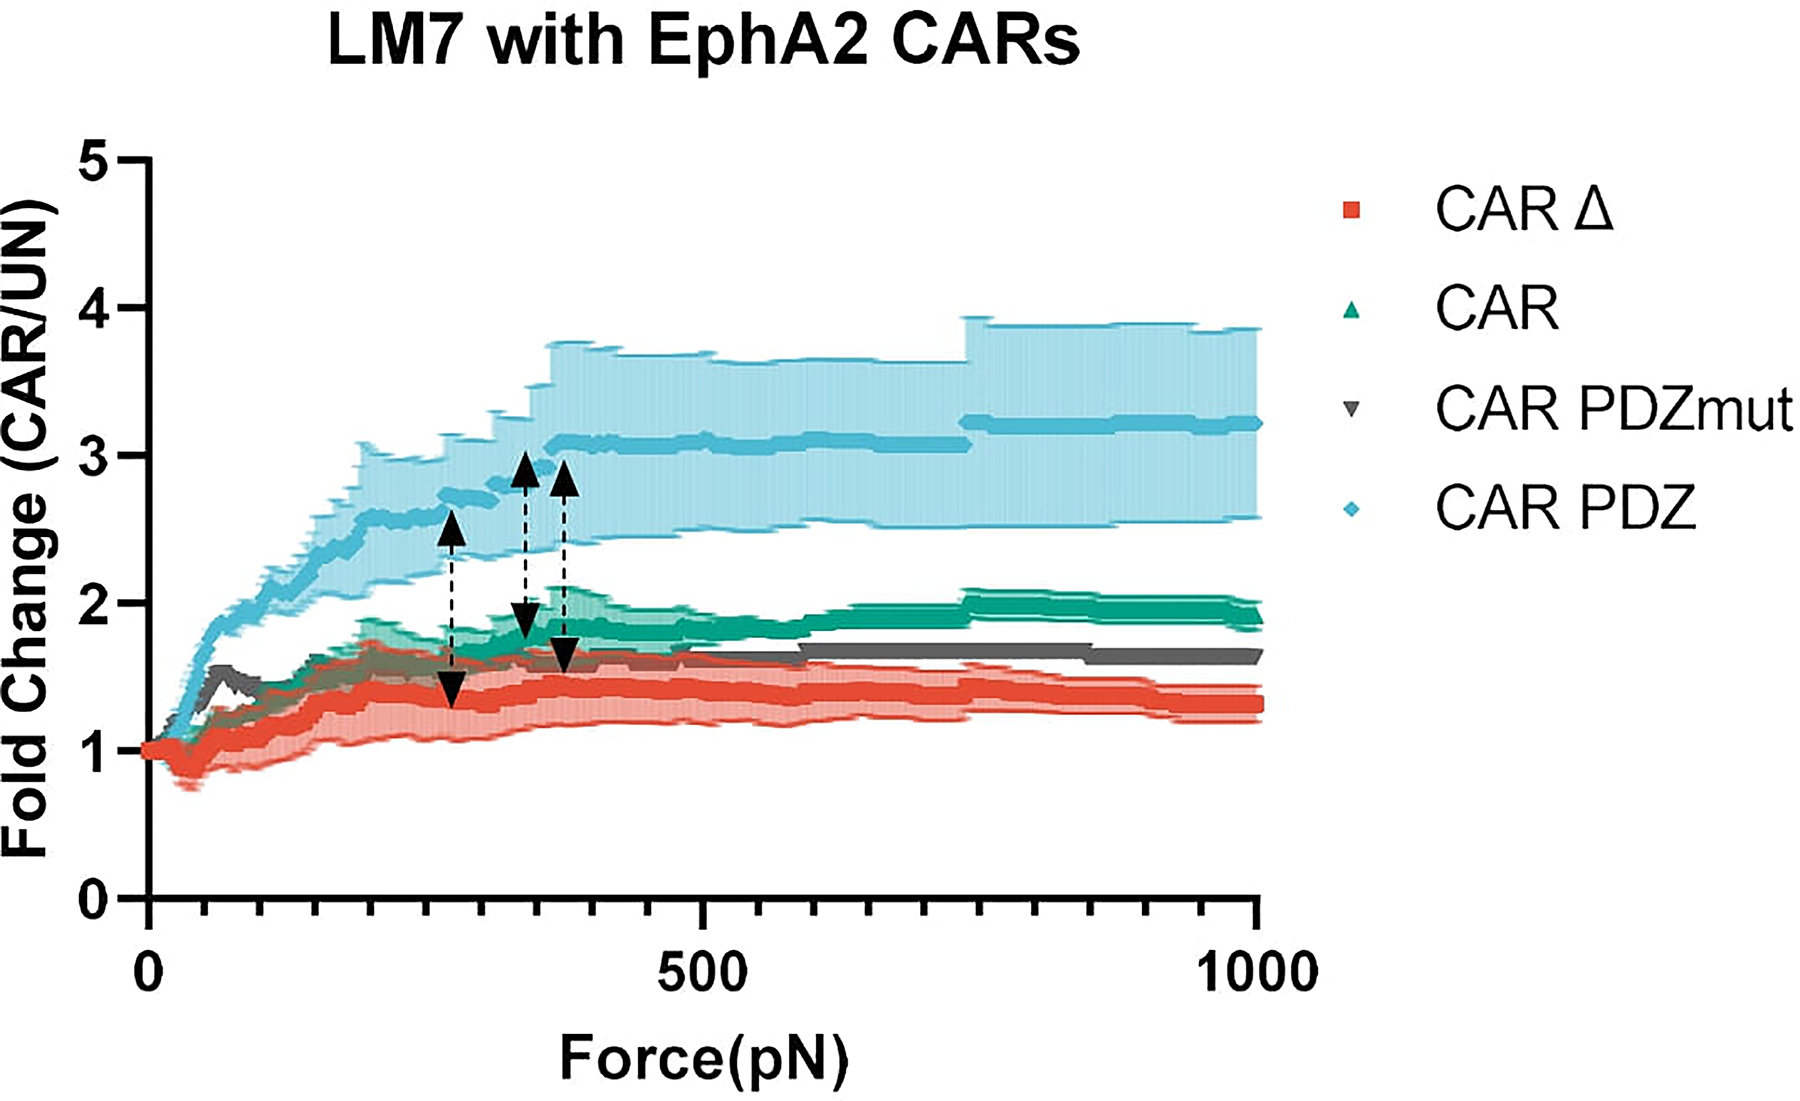
Normalized fold change of CAR NK cell binding compared to untransduced NK cells. Arrowed lines indicate the point of statistical difference at CAR.PDZ vs. CAR Δ at 268pN, CAR.PDZ vs CAR at 343pN, CAR.PDZ vs CAR.PDZmut at 363pN which continued to 1000pN indicated by dashed arrow lines. The only exception to this significance was from 650 to 738pN for CAR.PDZ vs CAR.PDZmut. Two-Way ANOVA was used to determine statistical significance with Two-stage linear step-up procedure of Benjamini, Krieger and Yekutieli to correct for FDR; n=1–3 donors, mean±SEM shown.
Extended Data Figure 6: B7-H3 CAR design with avidity, synapse, and calcium flux analyses.
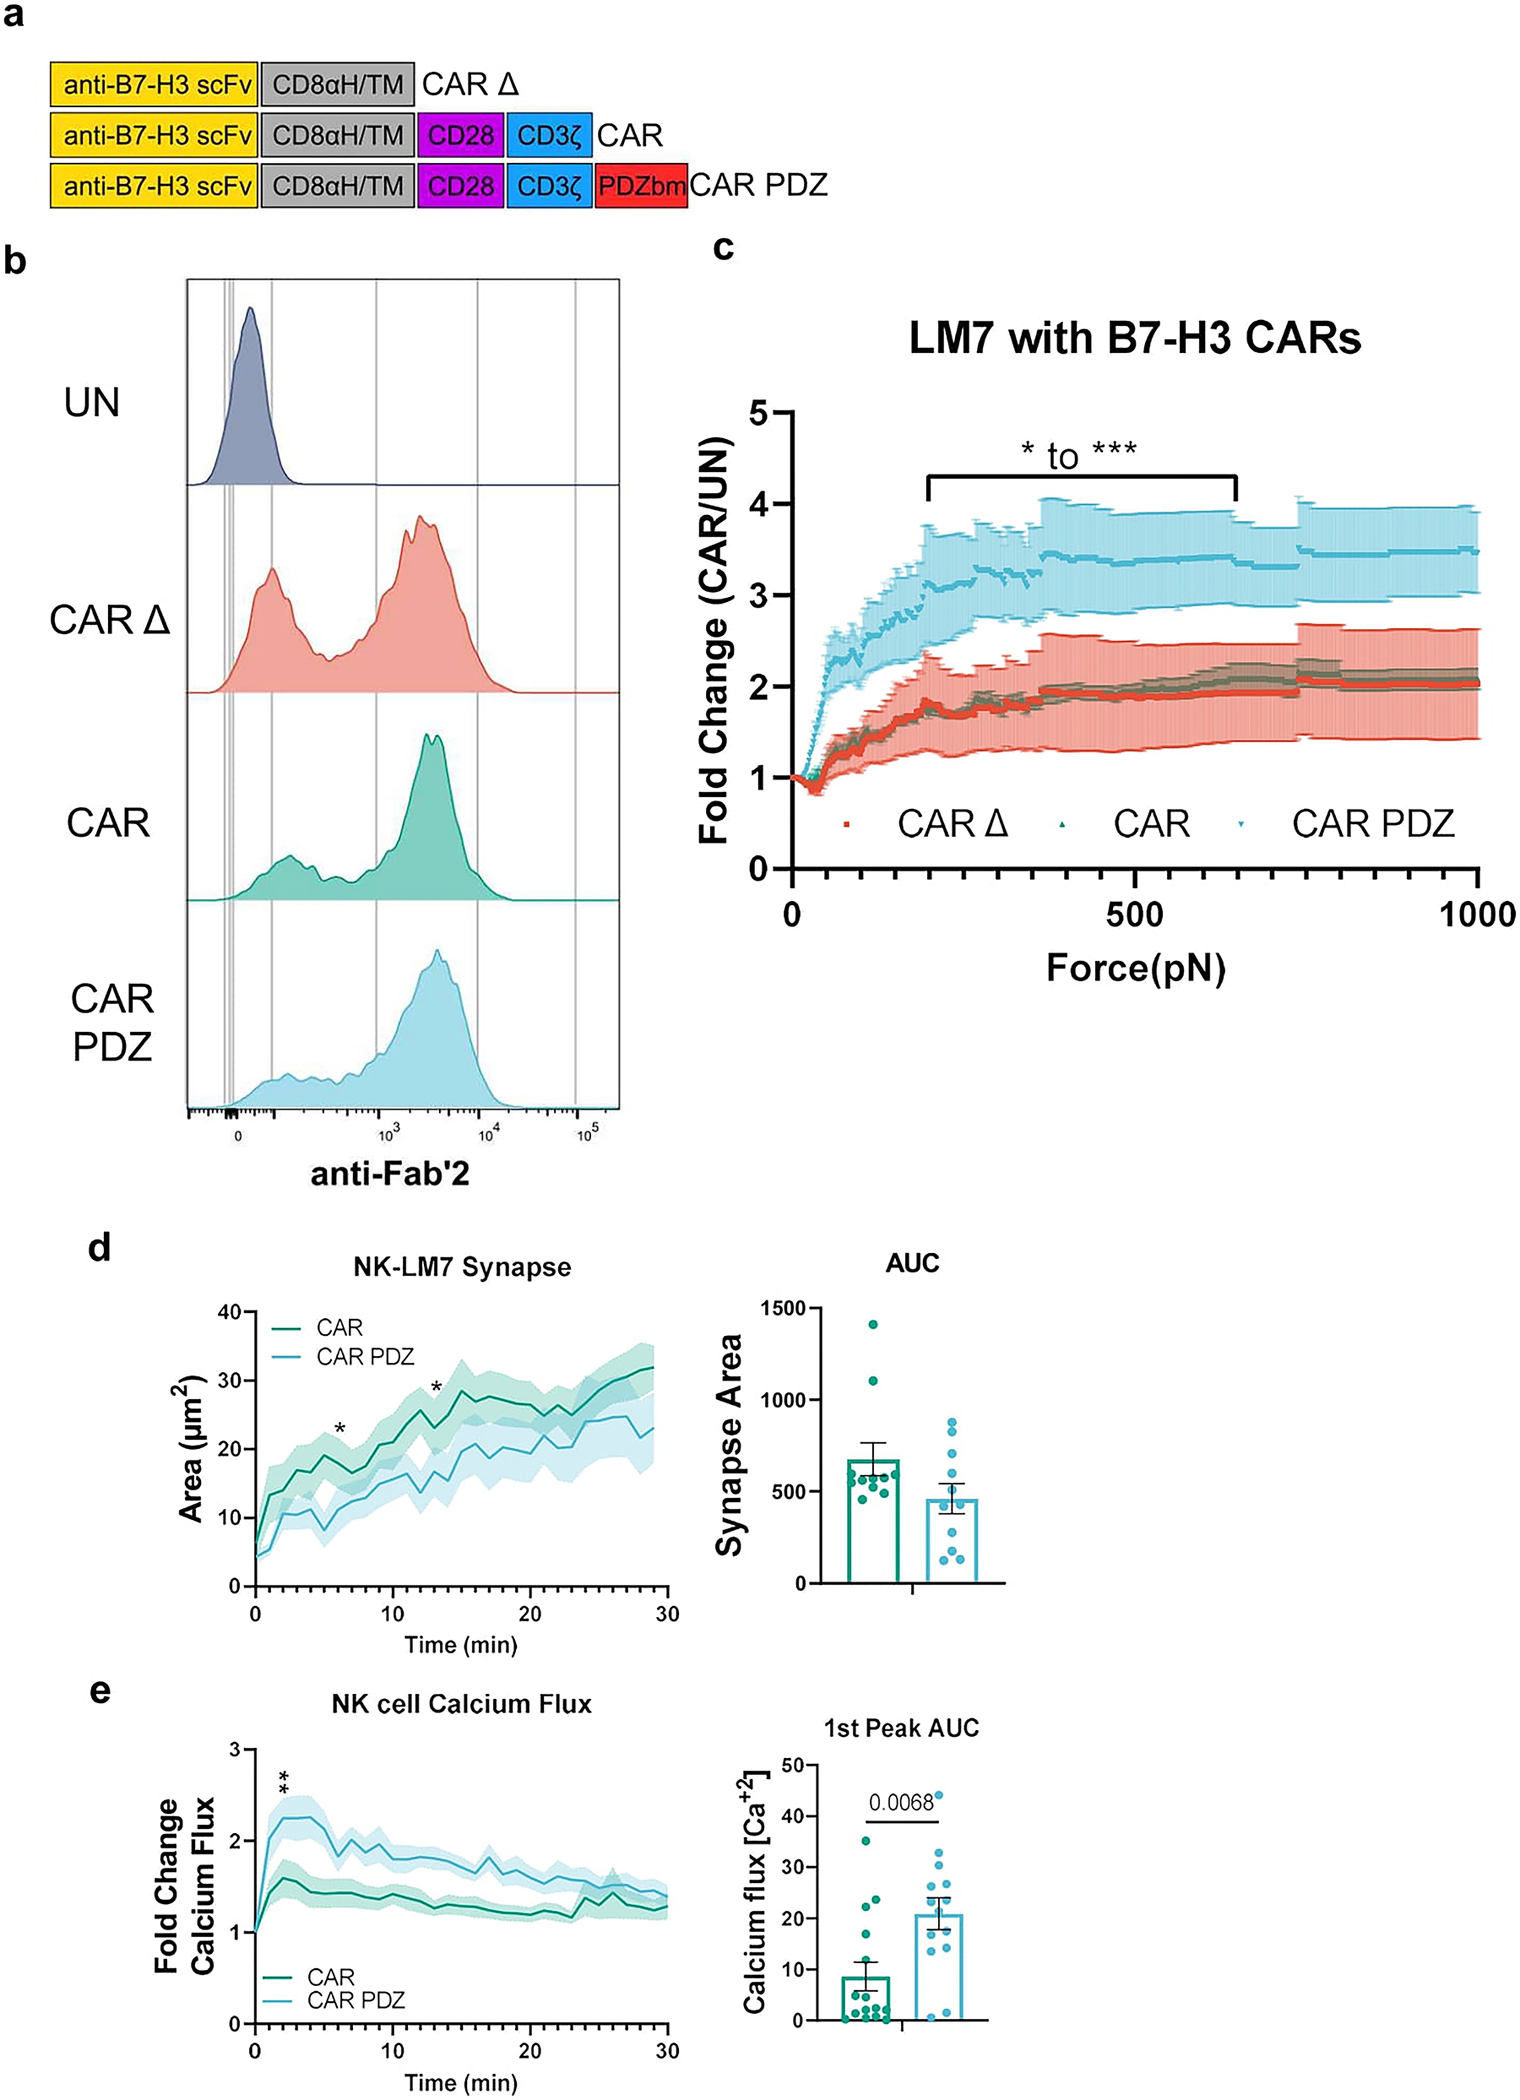
(a) Chimeric antigen receptor design schemes. Antigen recognition domain (anti-B7-H3 scFv): goldenrod, hinge and transmembrane domains (CD8αH/TM): grey, CD28 co-stimulatory domain: purple, CD3ζ activation domain: blue, PDZbm scaffolding anchor domain: red.
(b) Example flow cytometry plot detailing B7-H3 CAR expression.
(c) Normalized fold change of CAR NK cell binding compared to untransduced NK cells. Bracketed line indicates the scale of statistical difference at CAR.PDZ vs. CAR Δ and CAR from 194 to 646pN for both comparisons except for 205–215pN. Two-Way ANOVA was used to determine statistical significance with Two-stage linear step-up procedure of Benjamini, Krieger and Yekutieli to correct for FDR; q<0.05 *, <0.001 ***, n=3 donors, mean±SEM shown.
(d) Immune synapse area quantification of B7-H3 CAR and CAR.PDZ NK cells (n=11 and 11 cells) Two-Way ANOVA was used to determine statistical significance with Uncorrected Fisher’s LSD test p<0.05 * at minute 5 and 12 with area under the curve analysis.
(e) Calcium flux quantification of B7-H3 CAR and CAR.PDZ NK cells (n=15 and 14 cells) with Two-Way ANOVA was used to determine statistical significance with Uncorrected Fisher’s LSD test p<0.05 * starting at minute 2; 1st peak AUC analysis with unpaired Student’s t-Test, mean±SEM shown of one donor.
Extended Data Figure 7: A549 and LM7 tumor rechallenge rejection.
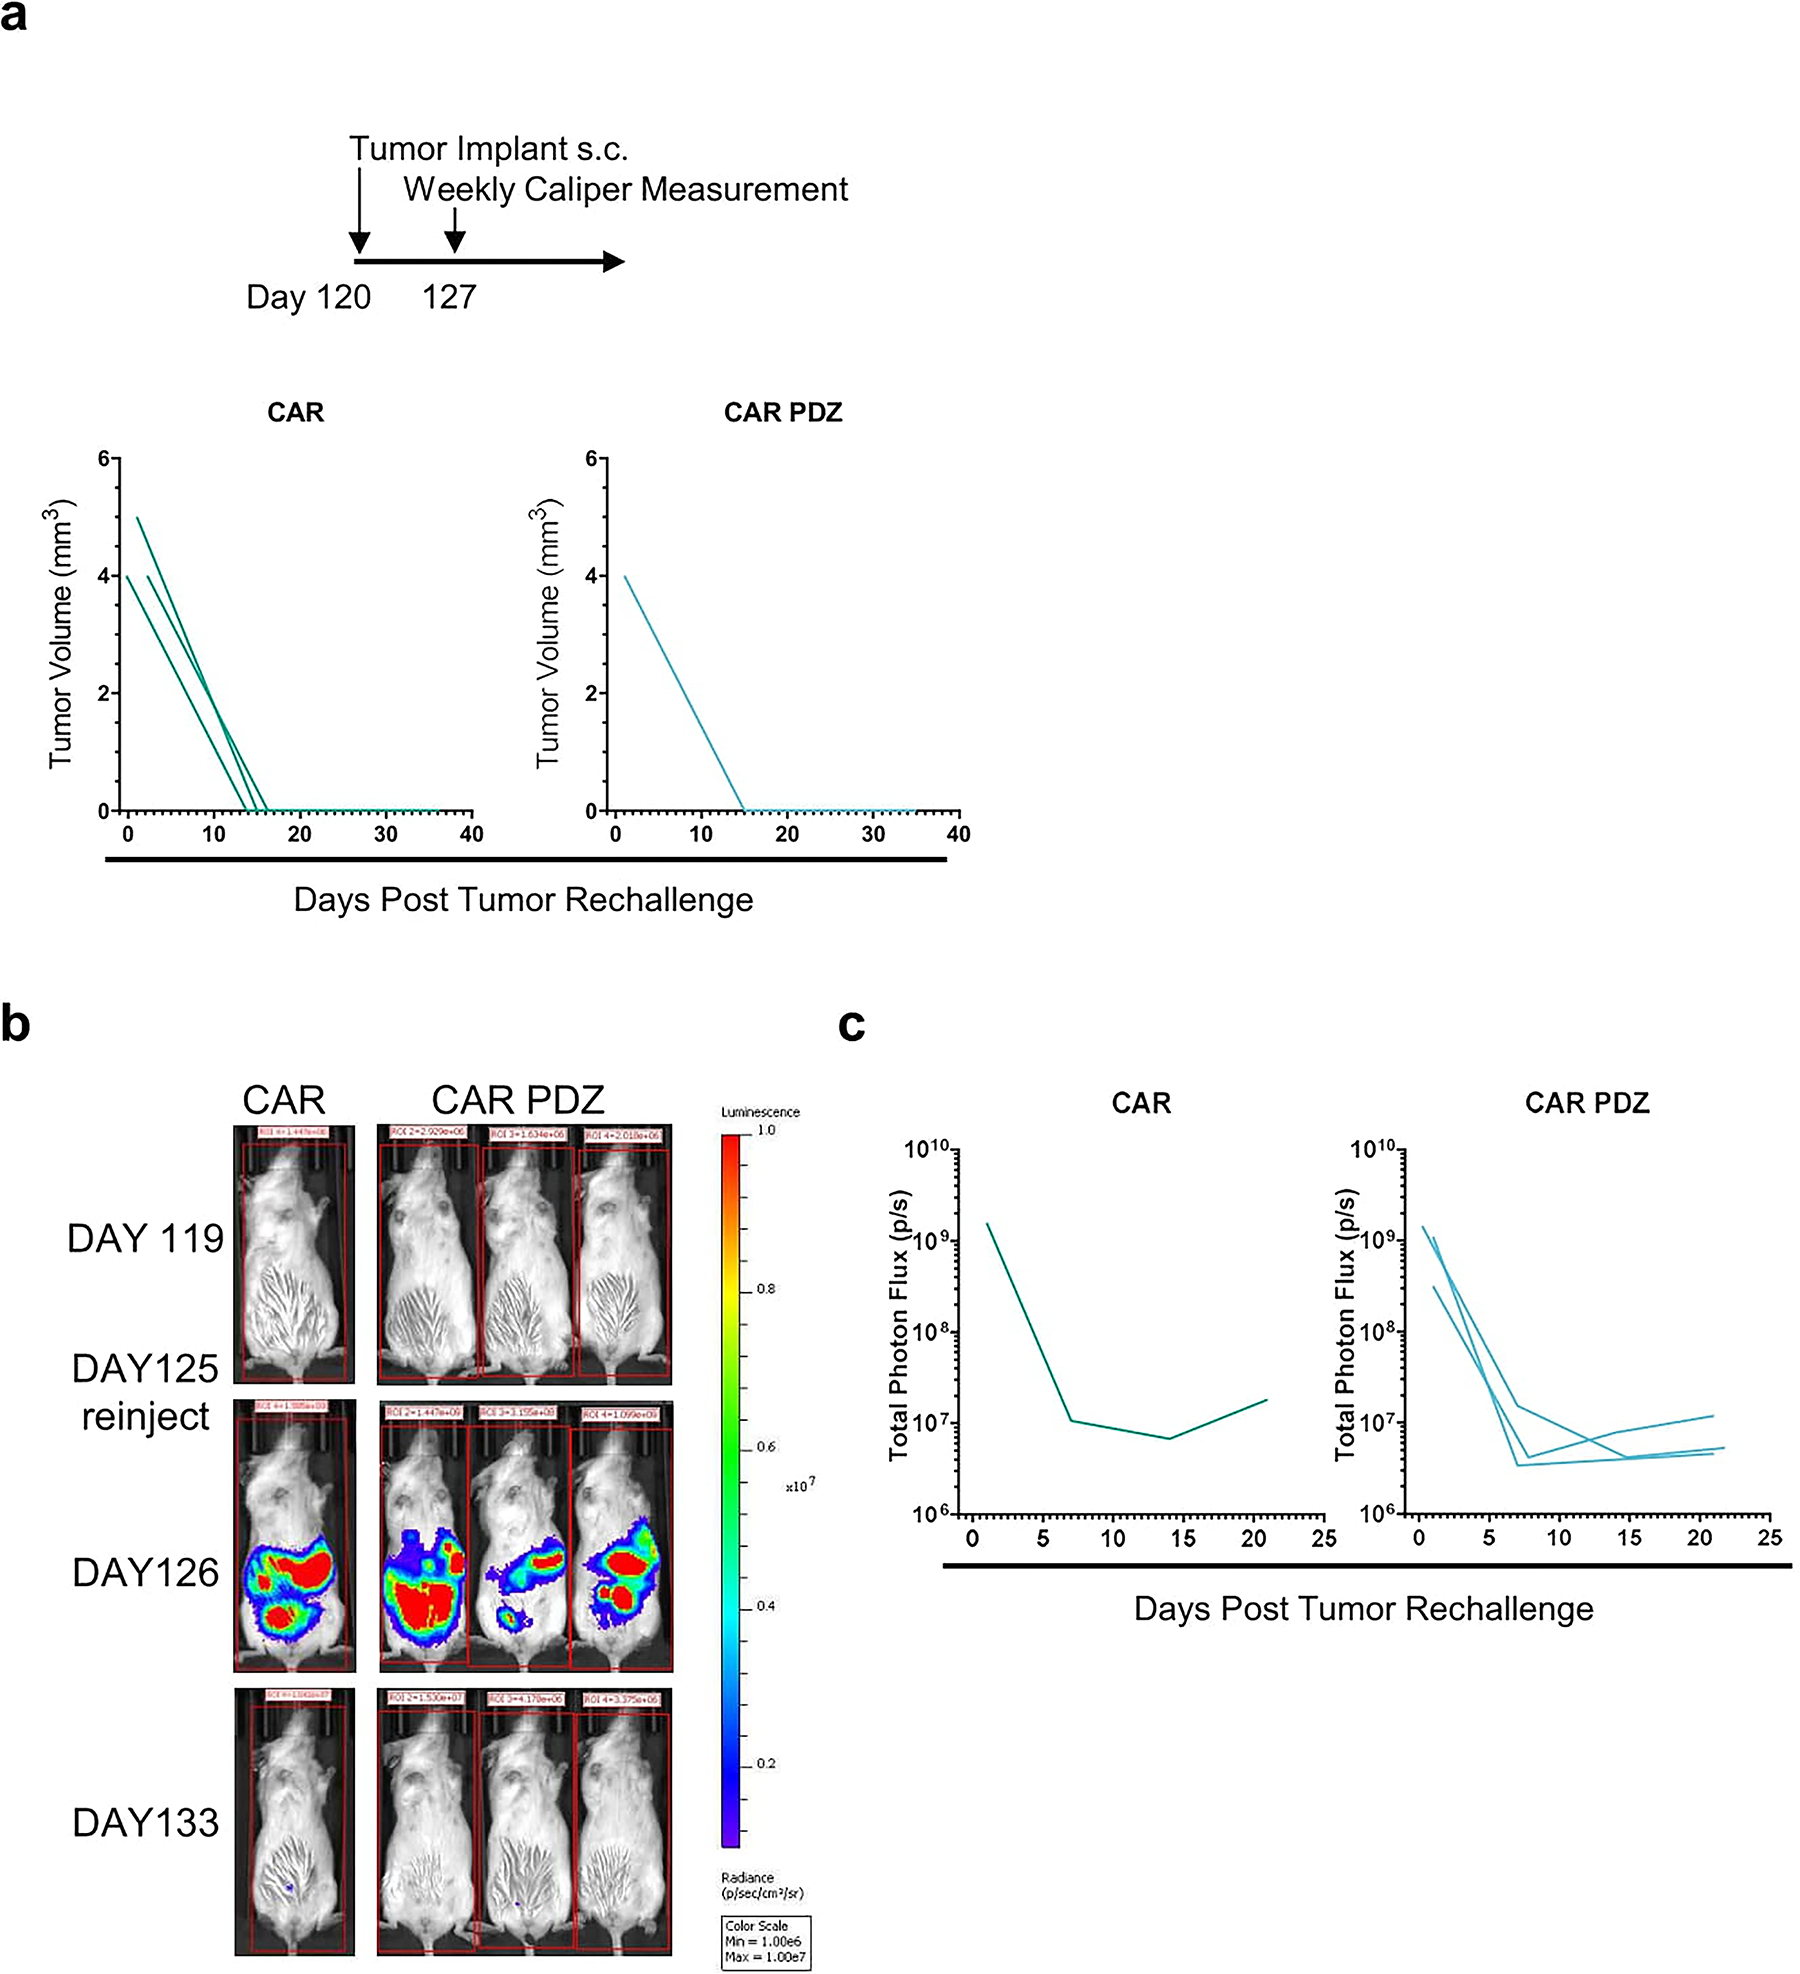
(a) A549 tumor rechallenge timeline with identical initial cancer cell numbers. Indicated tumor volumes from palpable nodules overtime.
(b) Intravital imaging of LM7 rechallenge with identical initial cancer cell numbers in complete responder mice. Color scale 1e6 to 1e7 of total photon flux(p/s).
(c) Tumor flux values of weekly measurements.
Extended Data Figure 8: CAR T cell phenotyping and cytokine production.
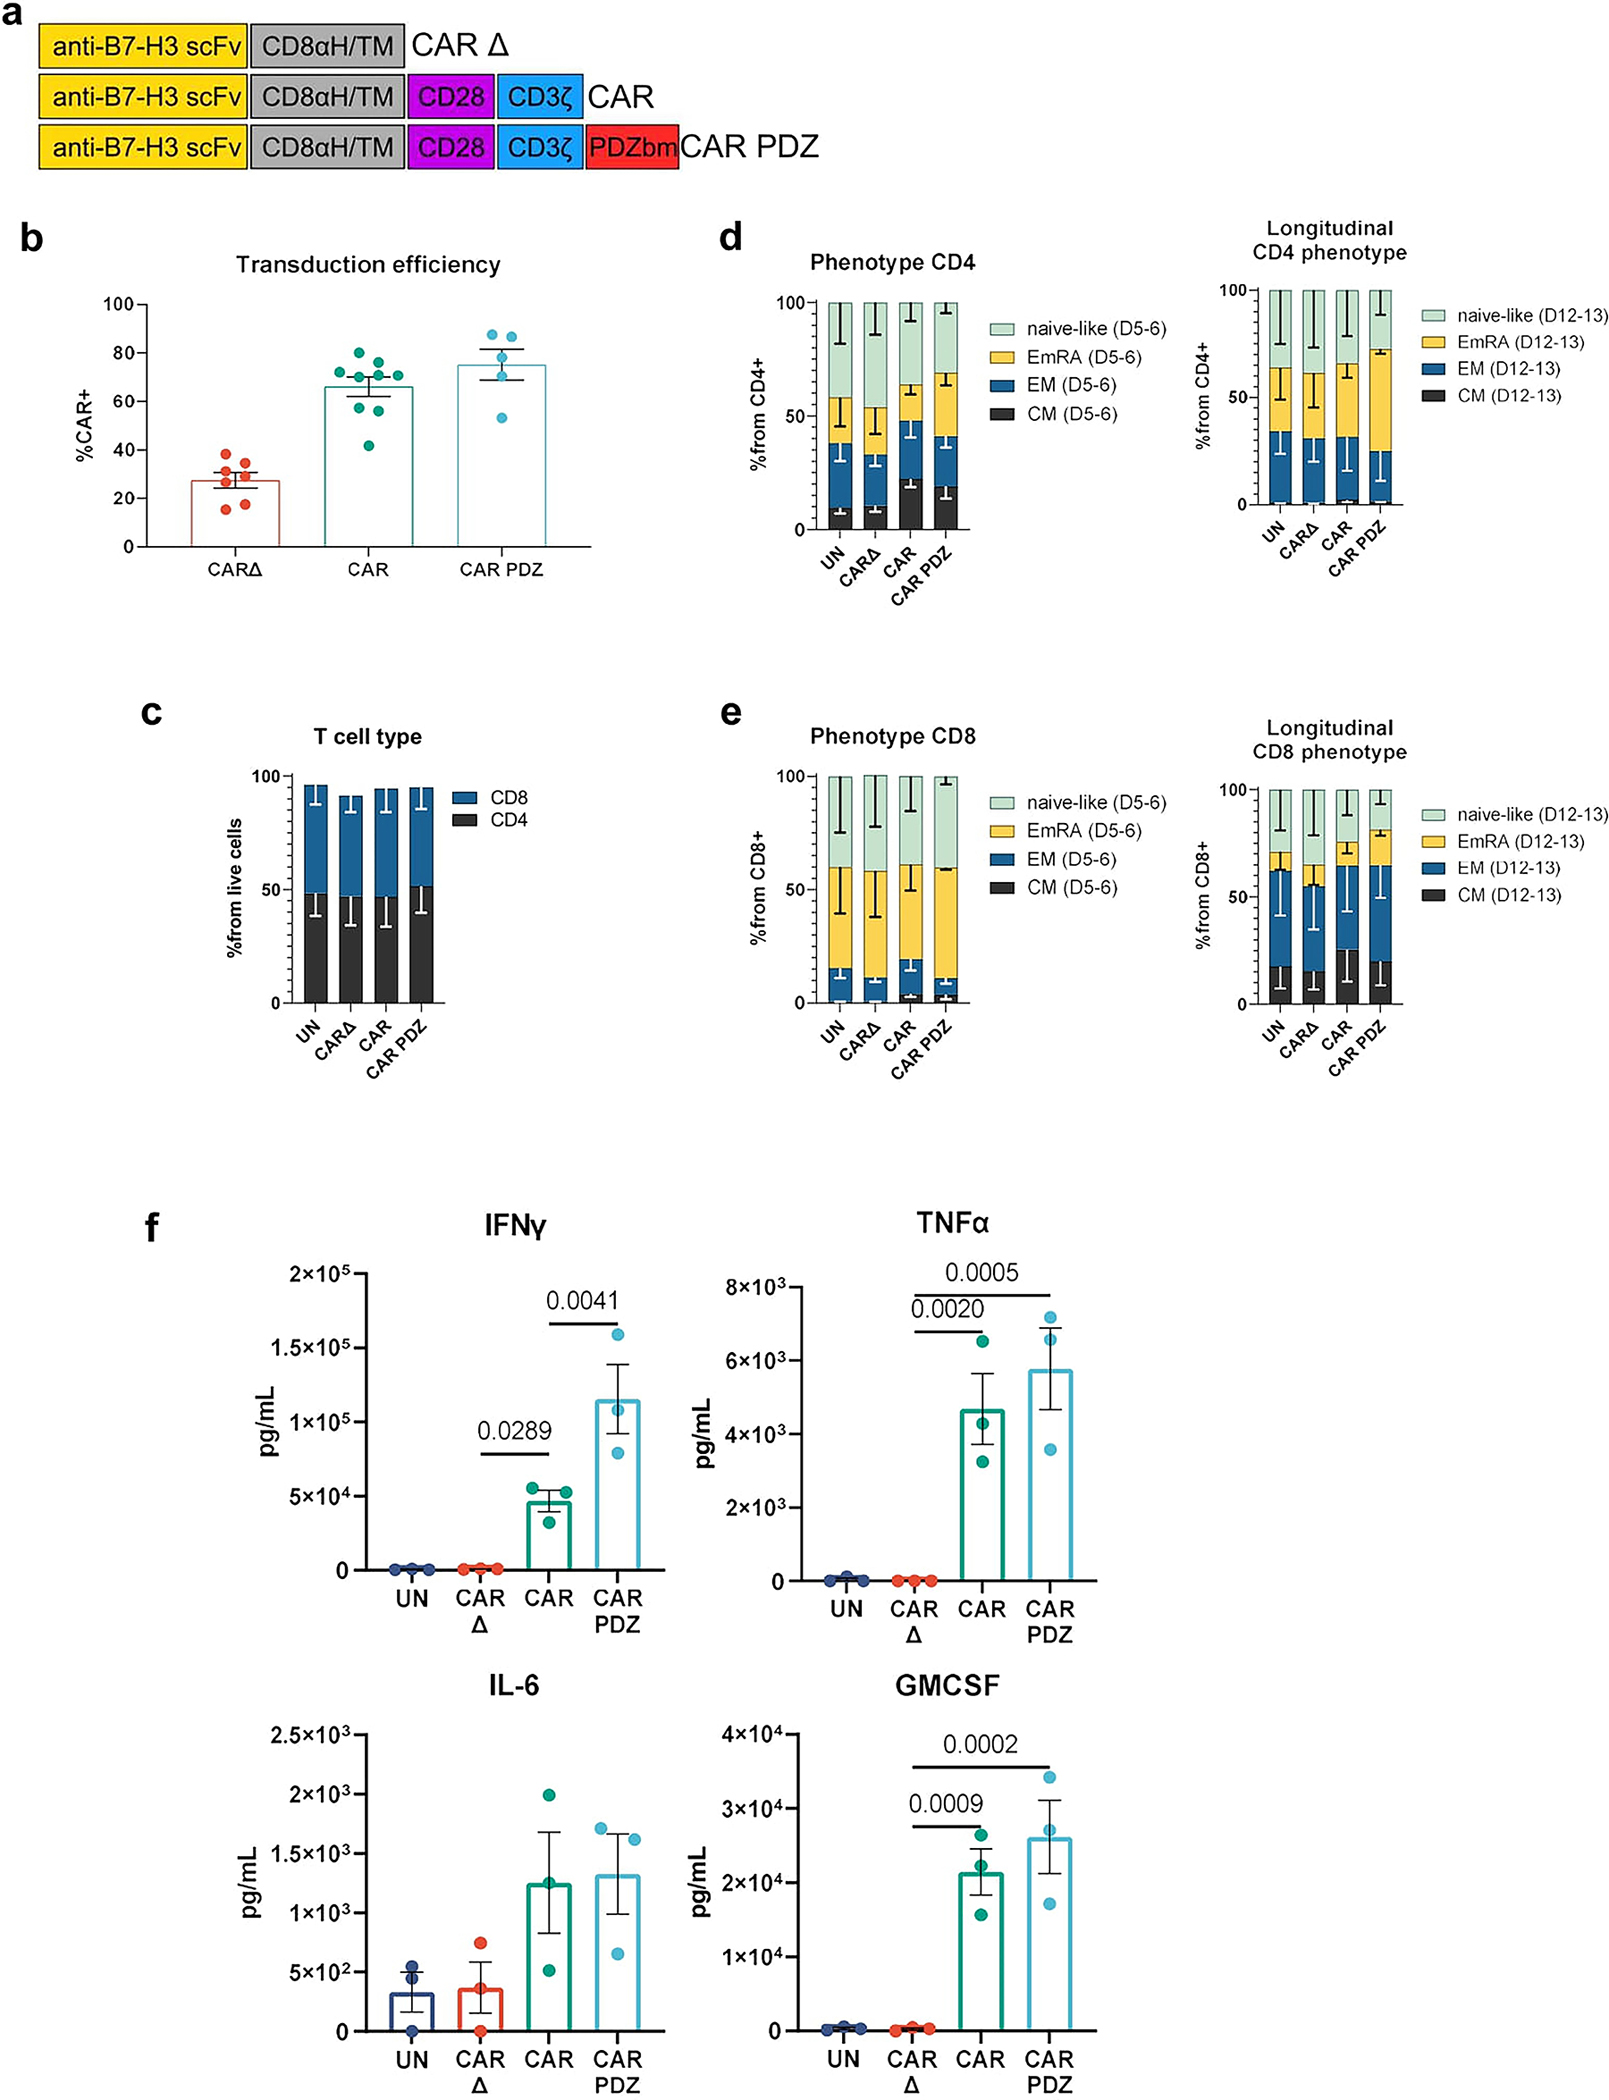
(a) Chimeric antigen receptor design schemes. Antigen recognition domain (anti-B7-H3 scFv): goldenrod, hinge and transmembrane domains (CD8αH/TM): grey, CD28 co-stimulatory domain: purple, CD3ζ activation domain: blue, PDZbm scaffolding anchor domain: red.
(b) Transduction efficiencies of various CAR constructs in T cells CAR Δ; n=7, CAR; n=8, CAR.PDZ n=5 donors mean±SEM shown
(c) CD4/8 T cell analysis post transduction at Day 5–6, n=2 donors mean±SEM shown.
(d) Immunophenotype of CD4 CAR T cells Day 5–6 and longitudinally Day 12–13, n=2 donors mean±SEM shown.
(e) Immunophenotype of CD8 CAR T cells Day 5–6 and longitudinally Day 12–13, n=2 donors mean±SEM shown.
(f) B7-H3 CAR T cells were co-cultured with A549, LM7, and 143b cancer cells lines at a 2:1 ratio for 24 hours for n=3 experiments. Supernatant was collected and multiplex cytokine assessment was performed. One-Way ANOVA was used to determine statistical significance with Two-stage linear step-up procedure of Benjamini, Krieger and Yekutieli to correct for FDR mean±SEM.
Extended Data Figure 9: B7-H3 CAR T cell synapse and calcium flux analyses.
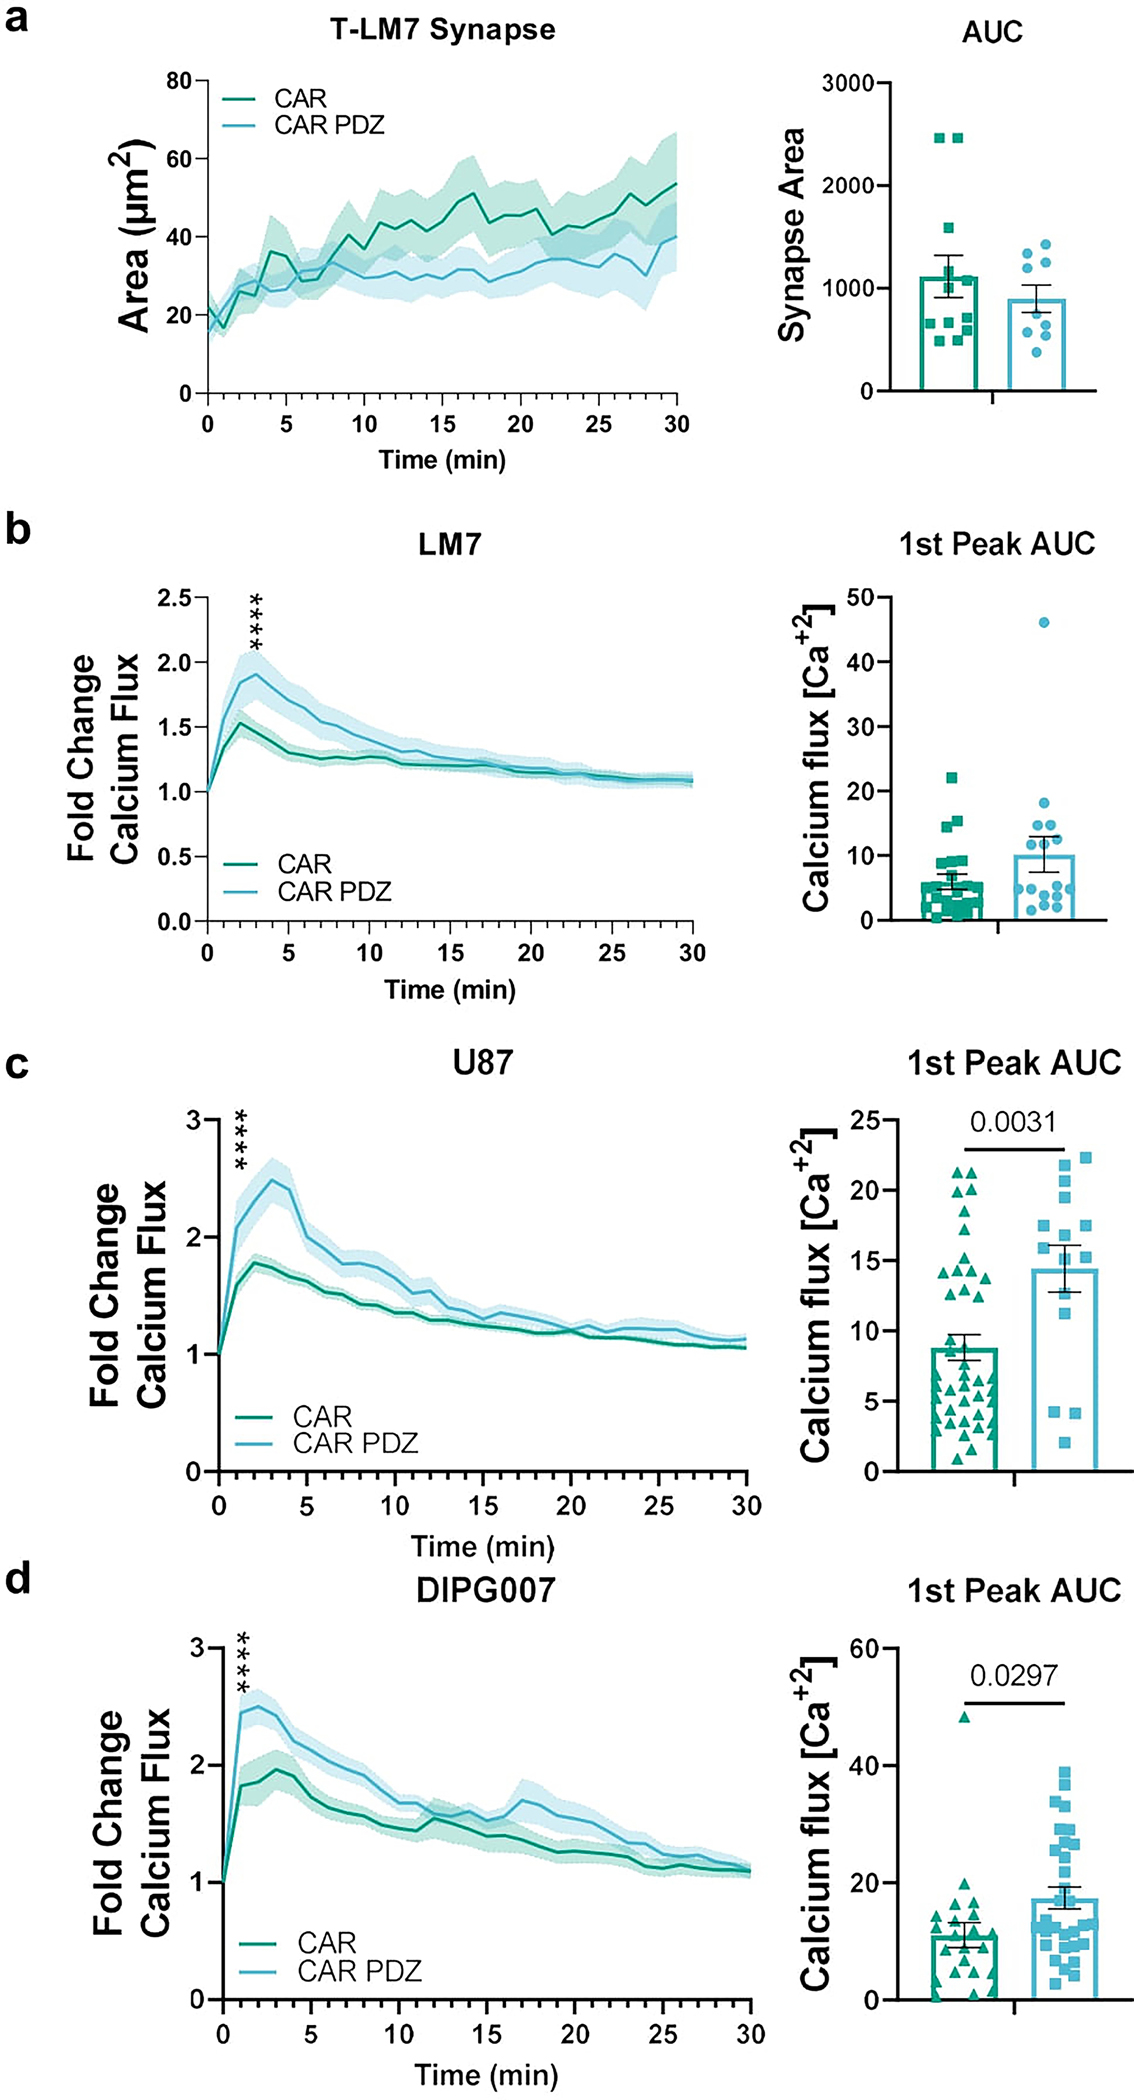
(a) Immune synapse area quantification of B7-H3 CAR and CAR.PDZ T cells (n=12 and 9 cells) co-cultured with LM7 cells with Area Under the Curve analysis.
(b) Calcium flux quantification of B7-H3 CAR and CAR.PDZ T cell (n=16 and 22 cells) co-cultured with LM7 cells with Two-Way ANOVA was used to determine statistical significance with Uncorrected Fisher’s LSD test p<0.0001 **** at minute 4; 1st peak AUC analysis. mean±SEM shown of one donor.
(c) Calcium flux quantification of B7-H3 CAR and CAR.PDZ T cells (n=42 and 15 cells) co-cultured with U87 cells. Two-Way ANOVA was used to determine statistical significance with Uncorrected Fisher’s LSD test p<0.0001 **** starting at minute 1; 1st peak AUC analysis with unpaired Student’s t-Test. mean±SEM shown of one donor.
(d) Calcium flux quantification of B7-H3 CAR and CAR.PDZ T cells (n=22 and 31 cells) co-cultured with DIPG007 cells. Two-Way ANOVA was used to determine statistical significance with Uncorrected Fisher’s LSD test p<0.0001 **** starting at minute 1; 1st peak AUC analysis with unpaired Student’s t-Test. mean±SEM shown of one donor.
Extended Data Figure 10: B7-H3 expression on tumor cells.
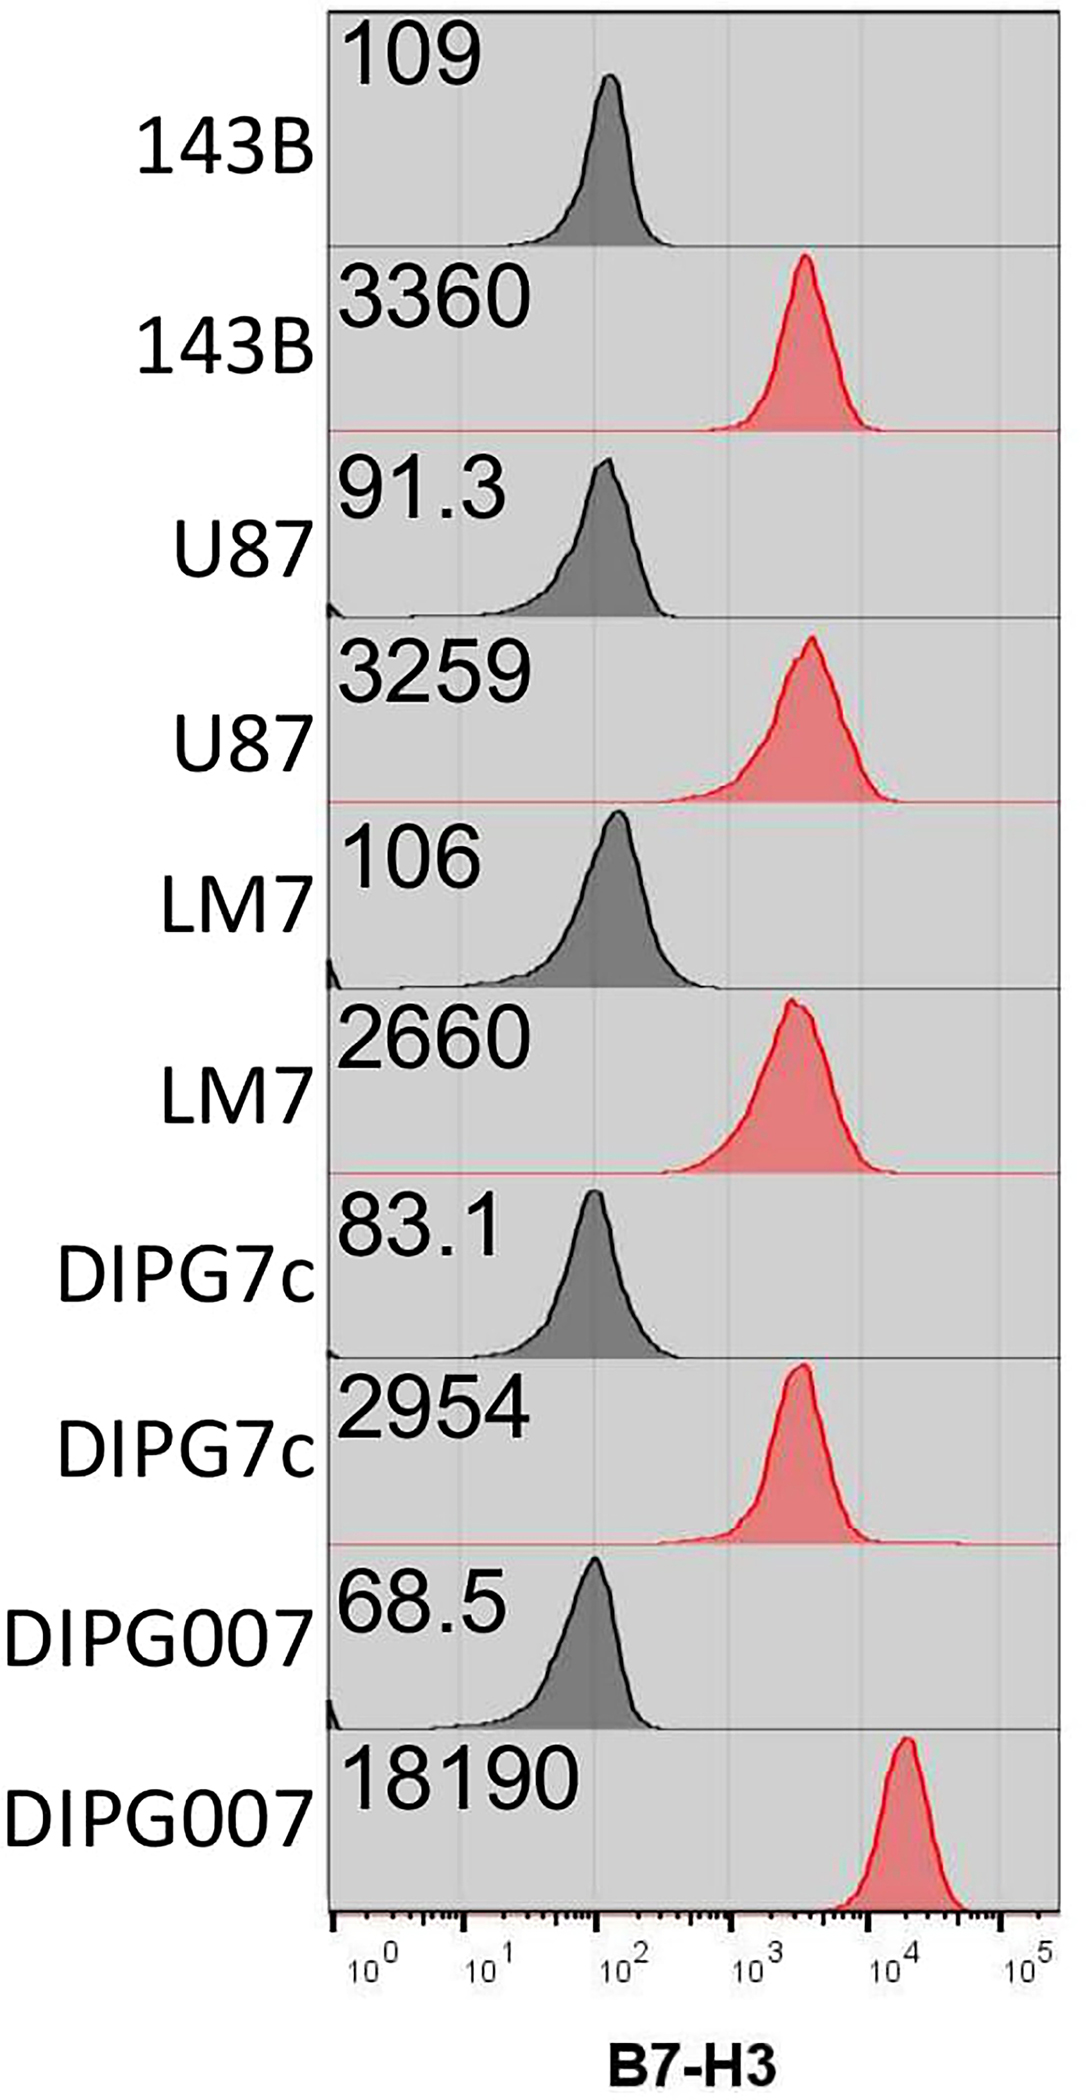
143B, U87, LM7, DIPG7c, and DIPG007 tumor cells were analyzed for B7-H3 expression. Black histograms indicate Isotype controls and red histograms are immunolabeled cells. Each sample is 100% positive and the indicated gMFI values are delineated.
Supplementary Material
ACKNOWLEDGEMENTS
We would like to acknowledge the technical support from Haley Houke, Carla O’Reilly, and Ashley Chabot. The work was supported by the St. Jude Sumara Fellowship (PC), the American Lebanese Syrian Associated Charites (SG), ChadTough Defeat DIPG Foundation (GK), (NINDS) Grant R01NS121249 (GK), the Rally Foundation for Childhood Cancer Research (LJT), The Garwood PostDoctoral Fellowship (JIV) and the National Institutes of Health (NIH)/National Cancer Institute (NCI) grant P30 CA021765. Animal imaging was performed by the Center for In Vivo Imaging and Therapeutics, which is supported in part by NIH grants P01CA096832 and R50CA211481. Cellular images were acquired at SJCRH Cell & Tissue Imaging Center which is supported by St. Jude and NCI P30 CA021765. Gene editing of cell lines was performed by the Center for Advanced Genome Engineering (CAGE), which is supported in part by NCI P30 CA021765. The content is solely the responsibility of the authors and does not necessarily represent the official views of the NIH.
Footnotes
CONFLICT OF INTEREST
S.G. and P.J.C. have patent applications in the fields of NK and T-cell and/or gene therapy for cancer. S.G. has a research collaboration with TESSA Therapeutics, is a DSMB member of Immatics, and was on the scientific advisory board of Tidal. P.J.C is a technical consultant for LUMICKS.
Code Availability
Imaging analysis code is available in GitHub (https://github.com/Jorge-Ibanez-StJude/AutomatedImageAnalysis.git).
Data Availability
Data is available upon request and source data is provided.
REFERENCES
- 1.Maude SL et al. Tisagenlecleucel in Children and Young Adults with B-Cell Lymphoblastic Leukemia. N Engl J Med 378, 439–448, doi: 10.1056/NEJMoa1709866 (2018). [DOI] [PMC free article] [PubMed] [Google Scholar]
- 2.Schuster SJ et al. Chimeric Antigen Receptor T Cells in Refractory B-Cell Lymphomas. N Engl J Med 377, 2545–2554, doi: 10.1056/NEJMoa1708566 (2017). [DOI] [PMC free article] [PubMed] [Google Scholar]
- 3.Kingwell K CAR T therapies drive into new terrain. Nat Rev Drug Discov 16, 301–304, doi: 10.1038/nrd.2017.84 (2017). [DOI] [PubMed] [Google Scholar]
- 4.Chiossone L, Dumas PY, Vienne M & Vivier E Natural killer cells and other innate lymphoid cells in cancer. Nat Rev Immunol 18, 671–688, doi: 10.1038/s41577-018-0061-z (2018). [DOI] [PubMed] [Google Scholar]
- 5.Davenport AJ et al. Chimeric antigen receptor T cells form nonclassical and potent immune synapses driving rapid cytotoxicity. Proc Natl Acad Sci U S A 115, E2068–E2076, doi: 10.1073/pnas.1716266115 (2018). [DOI] [PMC free article] [PubMed] [Google Scholar]
- 6.Watanabe K, Kuramitsu S, Posey AD Jr. & June CH Expanding the Therapeutic Window for CAR T Cell Therapy in Solid Tumors: The Knowns and Unknowns of CAR T Cell Biology. Front Immunol 9, 2486, doi: 10.3389/fimmu.2018.02486 (2018). [DOI] [PMC free article] [PubMed] [Google Scholar]
- 7.Lin J & Weiss A The tyrosine phosphatase CD148 is excluded from the immunologic synapse and down-regulates prolonged T cell signaling. J Cell Biol 162, 673–682, doi: 10.1083/jcb.200303040 (2003). [DOI] [PMC free article] [PubMed] [Google Scholar]
- 8.Roda-Navarro P & Alvarez-Vallina L Understanding the Spatial Topology of Artificial Immunological Synapses Assembled in T Cell-Redirecting Strategies: A Major Issue in Cancer Immunotherapy. Front Cell Dev Biol 7, 370, doi: 10.3389/fcell.2019.00370 (2019). [DOI] [PMC free article] [PubMed] [Google Scholar]
- 9.Nourry C, Grant SG & Borg JP PDZ domain proteins: plug and play! Sci STKE 2003, RE7, doi: 10.1126/stke.2003.179.re7 (2003). [DOI] [PubMed] [Google Scholar]
- 10.Yeh JH, Sidhu SS & Chan AC Regulation of a late phase of T cell polarity and effector functions by Crtam. Cell 132, 846–859, doi: 10.1016/j.cell.2008.01.013 (2008). [DOI] [PubMed] [Google Scholar]
- 11.Humbert PO, Dow LE & Russell SM The Scribble and Par complexes in polarity and migration: friends or foes? Trends Cell Biol 16, 622–630, doi: 10.1016/j.tcb.2006.10.005 (2006). [DOI] [PubMed] [Google Scholar]
- 12.Arase N et al. Heterotypic interaction of CRTAM with Necl2 induces cell adhesion on activated NK cells and CD8+ T cells. Int Immunol 17, 1227–1237, doi: 10.1093/intimm/dxh299 (2005). [DOI] [PubMed] [Google Scholar]
- 13.Chockley PJ et al. Epithelial-mesenchymal transition leads to NK cell-mediated metastasis-specific immunosurveillance in lung cancer. J Clin Invest 128, 1384–1396, doi: 10.1172/JCI97611 (2018). [DOI] [PMC free article] [PubMed] [Google Scholar]
- 14.Gwalani LA & Orange JS Single Degranulations in NK Cells Can Mediate Target Cell Killing. J Immunol 200, 3231–3243, doi: 10.4049/jimmunol.1701500 (2018). [DOI] [PMC free article] [PubMed] [Google Scholar]
- 15.Lafouresse F et al. Stochastic asymmetric repartition of lytic machinery in dividing CD8(+) T cells generates heterogeneous killing behavior. Elife 10, e62691, doi: 10.7554/eLife.62691 (2021). [DOI] [PMC free article] [PubMed] [Google Scholar]
- 16.Vivier E, Tomasello E, Baratin M, Walzer T & Ugolini S Functions of natural killer cells. Nat Immunol 9, 503–510, doi: 10.1038/ni1582 (2008). [DOI] [PubMed] [Google Scholar]
- 17.Yi Z, Prinzing BL, Cao F, Gottschalk S & Krenciute G Optimizing EphA2-CAR T Cells for the Adoptive Immunotherapy of Glioma. Mol Ther Methods Clin Dev 9, 70–80, doi: 10.1016/j.omtm.2018.01.009 (2018). [DOI] [PMC free article] [PubMed] [Google Scholar]
- 18.Pasquale EB Eph receptors and ephrins in cancer: bidirectional signalling and beyond. Nat Rev Cancer 10, 165–180, doi: 10.1038/nrc2806 (2010). [DOI] [PMC free article] [PubMed] [Google Scholar]
- 19.Wykosky J & Debinski W The EphA2 receptor and ephrinA1 ligand in solid tumors: function and therapeutic targeting. Mol Cancer Res 6, 1795–1806, doi: 10.1158/1541-7786.MCR-08-0244 (2008). [DOI] [PMC free article] [PubMed] [Google Scholar]
- 20.Lanier LL, Chang C, Spits H & Phillips JH Expression of cytoplasmic CD3 epsilon proteins in activated human adult natural killer (NK) cells and CD3 gamma, delta, epsilon complexes in fetal NK cells. Implications for the relationship of NK and T lymphocytes. J Immunol 149, 1876–1880 (1992). [PubMed] [Google Scholar]
- 21.Zigmond SH How WASP regulates actin polymerization. J Cell Biol 150, F117–120, doi: 10.1083/jcb.150.6.f117 (2000). [DOI] [PMC free article] [PubMed] [Google Scholar]
- 22.Guillerey C, Huntington ND & Smyth MJ Targeting natural killer cells in cancer immunotherapy. Nat Immunol 17, 1025–1036, doi: 10.1038/ni.3518 (2016). [DOI] [PubMed] [Google Scholar]
- 23.Molon B, Liboni C & Viola A CD28 and chemokine receptors: Signalling amplifiers at the immunological synapse. Front Immunol 13, 938004, doi: 10.3389/fimmu.2022.938004 (2022). [DOI] [PMC free article] [PubMed] [Google Scholar]
- 24.Nguyen P et al. Route of 41BB/41BBL Costimulation Determines Effector Function of B7-H3-CAR.CD28zeta T Cells. Mol Ther Oncolytics 18, 202–214, doi: 10.1016/j.omto.2020.06.018 (2020). [DOI] [PMC free article] [PubMed] [Google Scholar]
- 25.Majzner RG et al. CAR T Cells Targeting B7-H3, a Pan-Cancer Antigen, Demonstrate Potent Preclinical Activity Against Pediatric Solid Tumors and Brain Tumors. Clin Cancer Res 25, 2560–2574, doi: 10.1158/1078-0432.CCR-18-0432 (2019). [DOI] [PMC free article] [PubMed] [Google Scholar]
- 26.Fauriat C, Long EO, Ljunggren HG & Bryceson YT Regulation of human NK-cell cytokine and chemokine production by target cell recognition. Blood 115, 2167–2176, doi: 10.1182/blood-2009-08-238469 (2010). [DOI] [PMC free article] [PubMed] [Google Scholar]
- 27.Barreda D et al. The Scribble Complex PDZ Proteins in Immune Cell Polarities. J Immunol Res 2020, 5649790, doi: 10.1155/2020/5649790 (2020). [DOI] [PMC free article] [PubMed] [Google Scholar]
- 28.Larson RC et al. CAR T cell killing requires the IFNγR pathway in solid but not liquid tumours. Nature 604, 563–570, doi: 10.1038/s41586-022-04585-5 (2022). [DOI] [PubMed] [Google Scholar]
- 29.Molgora M, Cortez VS & Colonna M Killing the Invaders: NK Cell Impact in Tumors and Anti-Tumor Therapy. Cancers (Basel) 13, 595, doi: 10.3390/cancers13040595 (2021). [DOI] [PMC free article] [PubMed] [Google Scholar]
- 30.Rafei H, Daher M & Rezvani K Chimeric antigen receptor (CAR) natural killer (NK)-cell therapy: leveraging the power of innate immunity. Br J Haematol 193, 216–230, doi: 10.1111/bjh.17186 (2021). [DOI] [PMC free article] [PubMed] [Google Scholar]
- 31.Lee DA Cellular therapy: Adoptive immunotherapy with expanded natural killer cells. Immunol Rev 290, 85–99, doi: 10.1111/imr.12793 (2019). [DOI] [PubMed] [Google Scholar]
- 32.Liu E et al. Use of CAR-Transduced Natural Killer Cells in CD19-Positive Lymphoid Tumors. N Engl J Med 382, 545–553, doi: 10.1056/NEJMoa1910607 (2020). [DOI] [PMC free article] [PubMed] [Google Scholar]
- 33.Li Y, Hermanson DL, Moriarity BS & Kaufman DS Human iPSC-Derived Natural Killer Cells Engineered with Chimeric Antigen Receptors Enhance Anti-tumor Activity. Cell Stem Cell 23, 181–192 e185, doi: 10.1016/j.stem.2018.06.002 (2018). [DOI] [PMC free article] [PubMed] [Google Scholar]
- 34.Oelsner S et al. Continuously expanding CAR NK-92 cells display selective cytotoxicity against B-cell leukemia and lymphoma. Cytotherapy 19, 235–249, doi: 10.1016/j.jcyt.2016.10.009 (2017). [DOI] [PubMed] [Google Scholar]
- 35.Myers JA & Miller JS Exploring the NK cell platform for cancer immunotherapy. Nat Rev Clin Oncol 18, 85–100, doi: 10.1038/s41571-020-0426-7 (2021). [DOI] [PMC free article] [PubMed] [Google Scholar]
- 36.Gong Y, Klein Wolterink RGJ, Wang J, Bos GMJ & Germeraad WTV Chimeric antigen receptor natural killer (CAR-NK) cell design and engineering for cancer therapy. J Hematol Oncol 14, 73, doi: 10.1186/s13045-021-01083-5 (2021). [DOI] [PMC free article] [PubMed] [Google Scholar]
- 37.Majzner RG & Mackall CL Tumor Antigen Escape from CAR T-cell Therapy. Cancer Discov 8, 1219–1226, doi: 10.1158/2159-8290.Cd-18-0442 (2018). [DOI] [PubMed] [Google Scholar]
- 38.Wagner J, Wickman E, DeRenzo C & Gottschalk S CAR T Cell Therapy for Solid Tumors: Bright Future or Dark Reality? Mol Ther 28, 2320–2339, doi: 10.1016/j.ymthe.2020.09.015 (2020). [DOI] [PMC free article] [PubMed] [Google Scholar]
- 39.Yu WL & Hua ZC Chimeric Antigen Receptor T-cell (CAR T) Therapy for Hematologic and Solid Malignancies: Efficacy and Safety-A Systematic Review with Meta-Analysis. Cancers (Basel) 11, doi: 10.3390/cancers11010047 (2019). [DOI] [PMC free article] [PubMed] [Google Scholar]
- 40.Tong C et al. Optimized tandem CD19/CD20 CAR-engineered T cells in refractory/relapsed B-cell lymphoma. Blood 136, 1632–1644, doi: 10.1182/blood.2020005278 (2020). [DOI] [PMC free article] [PubMed] [Google Scholar]
- 41.Hegde M et al. Tandem CAR T cells targeting HER2 and IL13Ralpha2 mitigate tumor antigen escape. J Clin Invest 126, 3036–3052, doi: 10.1172/JCI83416 (2016). [DOI] [PMC free article] [PubMed] [Google Scholar]
- 42.Majzner RG et al. Tuning the Antigen Density Requirement for CAR T-cell Activity. Cancer Discov 10, 702–723, doi: 10.1158/2159-8290.CD-19-0945 (2020). [DOI] [PMC free article] [PubMed] [Google Scholar]
- 43.Xiong W et al. Immunological Synapse Predicts Effectiveness of Chimeric Antigen Receptor Cells. Mol Ther 26, 963–975, doi: 10.1016/j.ymthe.2018.01.020 (2018). [DOI] [PMC free article] [PubMed] [Google Scholar]
- 44.Mata M et al. Inducible Activation of MyD88 and CD40 in CAR T Cells Results in Controllable and Potent Antitumor Activity in Preclinical Solid Tumor Models. Cancer Discov 7, 1306–1319, doi: 10.1158/2159-8290.CD-17-0263 (2017). [DOI] [PMC free article] [PubMed] [Google Scholar]
- 45.Imai C, Iwamoto S & Campana D Genetic modification of primary natural killer cells overcomes inhibitory signals and induces specific killing of leukemic cells. Blood 106, 376–383, doi: 10.1182/blood-2004-12-4797 (2005). [DOI] [PMC free article] [PubMed] [Google Scholar]
- 46.Gundry MC et al. Highly Efficient Genome Editing of Murine and Human Hematopoietic Progenitor Cells by CRISPR/Cas9. Cell Rep 17, 1453–1461, doi: 10.1016/j.celrep.2016.09.092 (2016). [DOI] [PMC free article] [PubMed] [Google Scholar]
- 47.Taylor KR et al. Recurrent activating ACVR1 mutations in diffuse intrinsic pontine glioma. Nat Genet 46, 457–461, doi: 10.1038/ng.2925 (2014). [DOI] [PMC free article] [PubMed] [Google Scholar]
- 48.He C et al. Patient-derived models recapitulate heterogeneity of molecular signatures and drug response in pediatric high-grade glioma. Nat Commun 12, 4089, doi: 10.1038/s41467-021-24168-8 (2021). [DOI] [PMC free article] [PubMed] [Google Scholar]
- 49.Chow KK et al. T cells redirected to EphA2 for the immunotherapy of glioblastoma. Mol Ther 21, 629–637, doi: 10.1038/mt.2012.210 (2013). [DOI] [PMC free article] [PubMed] [Google Scholar]
- 50.Liu D, Paczkowski P, Mackay S, Ng C & Zhou J Single-Cell Multiplexed Proteomics on the IsoLight Resolves Cellular Functional Heterogeneity to Reveal Clinical Responses of Cancer Patients to Immunotherapies. Methods Mol Biol 2055, 413–431, doi: 10.1007/978-1-4939-9773-2_19 (2020). [DOI] [PubMed] [Google Scholar]
- 51.Tonikian R et al. A specificity map for the PDZ domain family. PLoS Biol 6, e239, doi: 10.1371/journal.pbio.0060239 (2008). [DOI] [PMC free article] [PubMed] [Google Scholar]
- 52.Schindelin J et al. Fiji: an open-source platform for biological-image analysis. Nat Methods 9, 676–682, doi: 10.1038/nmeth.2019 (2012). [DOI] [PMC free article] [PubMed] [Google Scholar]
- 53.Witten IH, Frank E, Hall MA & Pal CJ Data Mining Practical Machine Learning Tools and Techniques Fourth Edition Preface. Data Mining: Practical Machine Learning Tools and Techniques, 4th Edition, Xxiii-+ (2017). [Google Scholar]
- 54.Ershov D et al. Bringing TrackMate into the era of machine-learning and deep-learning. bioRxiv, 2021.2009.2003.458852, doi: 10.1101/2021.09.03.458852 (2021). [DOI] [Google Scholar]
- 55.Haydar D et al. Cell-surface antigen profiling of pediatric brain tumors: B7-H3 is consistently expressed and can be targeted via local or systemic CAR T-cell delivery. Neuro Oncol 23, 999–1011, doi: 10.1093/neuonc/noaa278 (2021). [DOI] [PMC free article] [PubMed] [Google Scholar]
Associated Data
This section collects any data citations, data availability statements, or supplementary materials included in this article.
Supplementary Materials
Data Availability Statement
Data is available upon request and source data is provided.


