

Abstract
Tobacco use and heavy alcohol consumption are risk factors for head and neck cancer (HNC), including oral, pharynx, and larynx cancer. No study has investigated the preventable burden of HNC attributable to tobacco and alcohol in China. We extracted data from 1990 to 2019 from the Global Burden of Disease. The preventable burden attributable to tobacco and alcohol was estimated by subtracting the overlapping fraction derived from a literature search. Descriptive analyses were performed initially, followed by joinpoint regression and age‐period‐cohort (APC) analysis. The future burden was forecasted using a Bayesian APC model. The crude burden increased significantly, while the age‐standardized rates showed a downward trend from 1990 to 2019 in China. Both all‐age and age‐standardized population attributable fractions rose significantly, potentially due to the poor prognosis of tobacco‐ and alcohol‐associated HNC. The absolute burden would continue to climb in the next 20 years from 2019, largely due to population aging. For site‐specific burden, compared with total, pharynx, and larynx cancer burden, the substantial upward trend of oral cancer burden indicated a strong interaction with risk factors such as genetic susceptibility, betel nut chewing, oral microbiota, and human papillomavirus. The burden of oral cancer attributable to tobacco and alcohol is a major concern and is anticipated to become more severe than cancer in other anatomic sites. Altogether, our study provides useful information to rethink the current restrictions on tobacco and alcohol, lean healthcare resources, and develop effective HNC prevention and control strategies.
Keywords: age‐period‐cohort analysis, decomposition analysis, head and neck cancer, preventable burden, tobacco and alcohol
The absolute burden will continue to climb in the next 20 years from 2019, largely due to population aging. The substantial upward trend of oral cancer indicates a strong interaction with other risk factors.

Abbreviations
- AAPC
average annual percent change
- APC
age‐period‐cohort
- ASDR
age‐standardized DALY rate
- ASMR
age‐standardized mortality rate
- CI
confidence interval
- DALY
disability‐adjusted life years
- GBD
global burden of disease
- HNC
head and neck cancer
- HPV
human papillomavirus
- INLA
integrated nested Laplace approximations
- PAF
population attributable fraction
- PC
percent change
- PLCO
prostate, lung, colorectal, and ovarian
- pRb
retinoblastoma protein
- RR
rate ratio
- RW2
second‐order random walk
- SE
standard error
- SEV
summary exposure value
- WHO
world health organization
1. INTRODUCTION
Head and neck cancer (HNC) refers to a cluster of devastating neoplasms arising from the anatomic sites of the upper aerodigestive tract, including oral, pharynx, and larynx cancer, over 90% of which are squamous cell carcinomas. Globally, there are an estimated 878,000 individuals diagnosed with HNC and approximately 444,000 deaths from HNC annually, with both ranking seventh highest among all cancers. 1 Despite the availability of diverse treatment options, the overall 5‐year survival rate is only around 50%. 2 There are an estimated 128,000 new cases of HNC and 65,000 deaths from HNC in China each year, and the recent several years have witnessed a steady upward trend of HNC, which poses a tremendous challenge to the healthcare system. 3 , 4
Tobacco use and heavy alcohol consumption are two well‐established modifiable risk factors for HNC, constituting at least 75% of all cases. 5 , 6 , 7 Tobacco‐specific carcinogenic agents include primarily nitrosamines and polycyclic aromatic hydrocarbons to disrupt the DNA structure and weaken the immune system. 8 With respect to alcohol, the toxic by‐product acetaldehyde could bind with DNA to disrupt cell replications and increase the body's susceptibility to other carcinogens. 9 It is worth noting that there is a synergistic effect of tobacco and alcohol, and the combined risk is more than multiplicative. 10 In addition, the two behavioral risks are normally concomitant and correlated with each other. 11
Given the carcinogenic effect of tobacco is evident from numerous population‐based studies, tobacco production and sales are strictly controlled by legislation, and “Healthy China 2030” was launched to reduce the adult smoking rate in China. 12 , 13 , 14 Alcohol, in contrast, is an indispensable aspect of Chinese culture from ancient times and its rising consumption is neglected. 15 The influence of this dichotomous consumption on the preventable burden of HNC attributable to tobacco and alcohol use is unknown. Moreover, the time trend of the tobacco‐ and alcohol‐related HNC burdens in the next several decades remains relatively understudied.
To address the aforementioned questions, we resorted to the 2019 Global Burden of Disease (GBD 2019) study, which is a comprehensive database that estimates the disease burden attributable to a diversity of risk factors worldwide, dating back to 1990. 16 , 17 In our context, we elucidated the preventable burden of tobacco‐ and alcohol‐related HNC including cancer deaths and disability‐adjusted life years (DALYs) in China, then forecasted the disease burden until 2039 using a Bayesian age‐period‐cohort (APC) model and ultimately decomposed the origins of the changing burden. This study provides useful information for policymakers to rethink the current restrictions on tobacco and alcohol and lean healthcare resources and develop effective HNC prevention and control strategies.
2. MATERIALS AND METHODS
2.1. Data source
The data regarding the HNC burden attributable to tobacco and alcohol use could be directly extracted from the GBD 2019, which collected and estimated global disease burden from data sources, including censuses, civil registration and vital statistics, and disease registries. To note, China‐specific data were obtained mainly from the China Center for Disease Control and Prevention and the Maternal and Child Health Surveillance System. 18 A detailed user guide for the GBD database is provided by Zhou et al. (2019). 19 Briefly, “China” was selected as the location. “Lip and oral cavity cancer,” “nasopharynx cancer,” “larynx cancer,” and “other pharynx cancer” were chosen as the cause, “Death” and “DALYs” as the measure, and “tobacco” and “alcohol use” as the risk. All data were downloaded from the Global Health Data Exchange website (https://ghdx.healthdata.org/gbd‐results‐tool (accessed October 1, 2022). No ethical approval was required to use the open‐access database to perform secondary analysis.
2.2. Exposure and disease metrics
To measure the net exposure level of tobacco and alcohol use, both all‐age and age‐standardized summary exposure values (SEVs) were obtained from the GBD 2019 database. The SEV is a GBD study‐specific term to measure the exposure extent and severity of a risk factor. The value ranges from 0% to 100%, where 0 represents no excess risk for a population, and 100% represents a population at greatest risk.
Disease burden metrics for HNC anatomic sites, including the annual death number, the mortality rate, the age‐standardized mortality rate (ASMR), DALYs, the all‐age DALY rate, and the age‐standardized DALY rate (ASDR), were extracted from the GBD 2019 database. The tobacco and alcohol population attributable fraction (PAF) and the age‐standardized PAF were estimated by dividing the respective death and DALY rate of HNC anatomic sites by the total death and DALY rates. To estimate the total preventable burden of HNC attributable to a combination of tobacco and alcohol, we adjusted the total burden through subtraction of the concomitant fraction due to the strong correlation between tobacco and alcohol use. A simple mathematical sum‐up cannot reflect the real‐world preventable burden.
The overlapping fractions of the tobacco and alcohol‐attributable burdens at each HNC anatomic site are also different (33.4% in larynx cancer, 41.6% in pharynx cancer, and 39.9% in oral cancer, respectively). 10 To note, we assumed the overlapping fraction of nasopharynx cancer was equal to the average HNC fraction due to a lack of such data. For instance, the detailed formula for the adjusted total death calculation at each HNC anatomic site was as follows:
The same overlapping fractions and similar formulas were applied to estimate total DALYs. To further simplify our study, we assumed the overlapping fractions of the tobacco and alcohol burdens at each anatomic site remained unchanged for all age groups and year by year.
2.3. Statistical analysis
We performed descriptive analyses on the combined HNC deaths and DALYs attributable to tobacco and alcohol use and by anatomic subsite represented by their 95% confidence interval (CI) from 1990 to 2019 in China. Joinpoint regression analysis was conducted to assess the yearly and overall trends on a log scale due to the Poisson distribution of the disease measures. 20 Both the average annual percent change (AAPC) and total percent change (PC) were calculated to depict the yearly and overall trends of the burdens, respectively.
Z‐tests were used to assess whether AAPC was significantly different from 0. The standard error (SE) for the PC was calculated to determine whether the total PC was significant or not, as follows:
Then the corresponding lower and upper bounds of the 90% CI were calculated as follows:
If both lower and upper bounds were positive or negative, then the percent change was statistically significant.
Age‐period‐cohort analysis was then performed to dissect the effects of age, period, and cohort on the above disease metrics. 21 The APC analysis was based on a log‐linear model with the additive effects from three components, including age, period, and birth cohort, the formula of which is:
where represents the age effect, represents the period effect, and represents the cohort effect.
The essential indicators of interest included: (1) net drift (the PC of the age‐adjusted rates per year); (2) local drifts (annual PC of the age‐specific rates over time); (3) longitudinal age curve (fitted longitudinal age‐specific rates adjusted for period deviations); (4) period rate ratios (RR), the ratio of the period‐specific rate relative to the reference period; and (5) cohort RR, a ratio of each cohort rate relative to the reference cohort. The last three indicators reflected the effects of age, period, and cohort, respectively.
Based on the HNC burden from 1990 to 2019, we predicted the future trend from 2019 to 2039 using a Bayesian APC model with integrated nested Laplace approximations (INLA). For age, period, and cohort effect smoothing priors, the second‐order random walk (RW2) was applied, assuming the inverse gamma prior distribution of these three effects. 22 The prediction analyses were achieved using the software R (version 4.2.1). 23 The versions of Bayesian APC and INLA packages were BAPC_0.0.36 and INLA_2022.09.15, respectively. We deliberately chose to consider only the next 20 years due to the risk of less accuracy in assessing longer periods. 24 The predicted population of China from 2020 onwards was obtained from the United Nations’ World Population Prospects 2022. We used the World Standard (World Health Organization, WHO 2000–2025) for our standard age structure.
Finally, we decomposed the tobacco and alcohol‐attributable changes in the number of HNC deaths and DALYs into three components between 1990 and 2039: population growth, population aging, and age‐specific changes. 25 , 26 The disease metrics in 1990 were used as the reference and compared with the subsequent years, from which both the absolute and relative contributions of the three components were calculated. A positive contribution indicated an increase in the disease burden. To note, the age‐specific changes represented the proportion of the net changes, which cannot be explained by population growth and population aging. A two‐sided p‐value less than 0.05 for all analyses was considered statistically significant.
3. RESULTS
3.1. Trends of the preventable burden of head and neck cancer attributable to tobacco and alcohol
The all‐age and age‐standardized SEVs of tobacco decreased from 1990 to 2019 in China with a PC of −25.57% (90% CI: −29.71%, −21.43%) and − 4.41% (90% CI: −9.60%, 0.78%; Table 1). In contrast, the SEVs of alcohol increased, and the all‐age and age‐standardized PCs were 60.87% (90% CI: −1.48%, 123.52%) and 58.78% (90% CI: −5.96%, 123.52%), respectively. Notably, both age‐standardized deaths and DALYs attributable to tobacco or alcohol declined (Table S1). When pooling the preventable burden together, there were a total of 47,363 deaths and 1,323,652 DALYs in 2019. The total number, PAF, age‐standardized PAF, and the mortality rate ascended significantly, while ASMR dropped significantly, with a PC of −14.57% (90% CI: −27.31%, −1.84%). A similar pattern was observed in the total DALYs. All site‐specific results are detailed in Table S2. Briefly, the preventable burden of each anatomic site showed a similar pattern to the total burden except for oral cancer, for which both ASMR and ASDR increased significantly.
TABLE 1.
The SEV and burden of HNC attributable to tobacco and alcohol from 1990 to 2019.
| Metrics | Measure | Year | AAPC (%, 95% CI) | PC (%, 90% CI) | ||
|---|---|---|---|---|---|---|
| 1990 | 2019 | |||||
| SEV | Tobacco | All ages (%) | 41.02 (39.20–42.84) | 30.53 (29.02–32.01) | −1.02 (−1.03—‐1.00) | −25.57 (−29.71—‐21.43) |
| Age‐standardized (%) | 39.24 (37.57–40.96) | 37.51 (35.73–39.32) | −0.16 (−0.17—‐0.14) | −4.41 (−9.60–0.78) | ||
| Alcohol | All ages (%) | 5.29 (3.65–7.26) | 8.51 (6.09–11.35) | 1.63 (1.49–1.78) | 60.87 (−1.48–123.21) | |
| Age‐standardized (%) | 5.41 (3.75–7.40) | 8.59 (5.94–11.91) | 1.57 (1.43–1.71) | 58.78 (−5.96–123.52) | ||
| Death | Number (n) | 24,358 (21,230‐27,488) | 47,363 (41,878‐52,848) | 2.27 (2.17–2.37) | 94.45 (66.13–122.76) | |
| PAF (all ages, %) | 50.26 (43.49–57.04) | 61.39 (53.86–68.93) | 0.67 (0.62–0.73) | 22.14 (3.40–40.89) | ||
| Age‐standardized PAF (%) | 49.73 (43.33–56.13) | 59.97 (52.70–67.25) | 0.63 (0.58–0.69) | 20.59 (2.64–38.55) | ||
| Mortality (all ages, 1/105) | 2.06 (1.79–2.32) | 3.33 (2.94–3.72) | 1.62 (1.53–1.72) | 61.65 (37.98–85.32) | ||
| ASMR (1/105) | 2.47 (2.15–2.80) | 2.11 (1.86–2.36) | −0.59 (−0.72—‐0.47) | −14.57 (−27.31—‐1.84) | ||
| DALY | Number (n) | 759,858 (654,457–865,258) | 1,323,652 (1,167,451–1,479,853) | 1.88 (1.79–1.98) | 74.2 (47.49–100.90) | |
| PAF (all ages, %) | 48.57 (41.46–55.67) | 62.10 (54.30–69.91) | 0.84 (0.77–0.92) | 27.86 (7.10–48.62) | ||
| Age‐standardized PAF (%) | 49.49 (42.68–56.41) | 60.74 (53.14–68.35) | 0.70 (0.63–0.77) | 22.73 (3.42–42.04) | ||
| All‐age rate (1/105) | 64.19 (55.29–73.10) | 93.06 (82.08–104.04) | 1.25 (1.16–1.33) | 44.98 (22.75–67.20) | ||
| ASDR (1/105) | 78.95 (68.46–89.43) | 63.58 (56.09–71.07) | −0.79 (−0.90—‐0.68) | −19.47 (−31.50—‐7.43) | ||
Abbreviations: AAPC, average annual percent change; ASDR, age‐standardized DALY rate; ASMR, age‐standardized mortality rate; CI, confidence interval; DALY, disability‐adjusted life year; PAF, population attributable fraction; PC, percent change; SEV, summary exposure value.
Joinpoint regression analysis showed that the AAPC of the number, all‐age and age‐standardized PAF, and the mortality rate were 2.27% (95% CI: 2.17%, 2.37%), 0.67% (95% CI: 0.62%, 0.73%), 0.63% (95% CI: 0.58%, 0.69%), and 1.62% (95% CI: 1.53%, 1.72%), respectively. In addition, the respective metrics of DALYs were 1.88% (95% CI: 1.79%, 1.98%), 0.84% (95% CI: 0.77%, 0.92%), and 0.70% (95% CI: 0.63%, 0.77%), and 1.25% (95% CI: 1.16%, 1.33%). However, the ASMR and ASDR showed a similar decreasing trend, of which the AAPCs were negative (−0.59%, 95% CI: −0.72%, 0.47% and −0.79%, 95% CI: −0.9%, −0.68%). The site‐specific joinpoint regression results are illustrated in Figures S1 and S2.
3.2. Age‐period‐cohort analysis of the preventable burden of head and neck cancer attributable to tobacco and alcohol
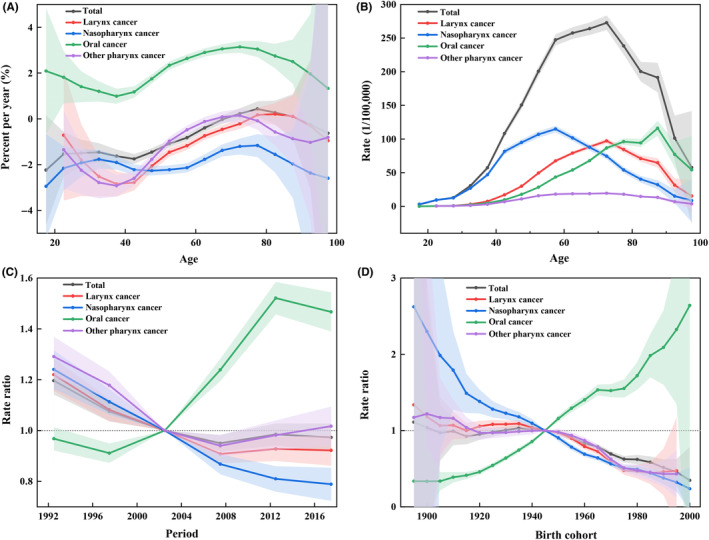
We used the APC model to analyze the preventable deaths of HNC attributable to tobacco and alcohol from 1990 to 2019. The overall annual PC (net drift) resulting from the APC model was −0.89% (95% CI: −1.09%, −0.70%), indicating a significantly decreasing trend across the study period (Table S3). More specifically for age groups (local drift), the local drifts in all age groups declined, except for the 75–79 age group, which rose significantly (Figure 1A). When further divided by HNC anatomic subsite, the net drifts of the larynx, nasopharynx, and other pharynx cancers showed a similar downward trend. Surprisingly, the net drift of oral cancer surged significantly, with an annual PC of 2.17% (95% CI: 1.92%, 2.41%). The rise was more prominent among the 60‐ to 80‐year populations, with local drifts ranging from 2.89% to 3.10%.
FIGURE 1.

Effects of age, period, and cohort and the resulting local drifts on head and neck cancer death attributable to tobacco and alcohol from 1990 to 2019 by anatomic site. (A) Local drifts of different age groups. (B) Fitted longitudinal age curves of mortality. (C) Relative risks of each time period referenced with 2000–2004. (D) Relative risk of each cohort compared with the reference cohort 1945–1949. The solid lines and shaded areas represent each metric and their 95% confidence interval (CI).
The effects of age, period, and cohort on preventable deaths were scrutinized (Figure 1B‐D). The risk of death increased monotonically along with the age and culminated in the 85–89 age group, followed by a drop in the over 90 age groups. The trend was similar at each HNC anatomic subsite. With respect to the period effect, the time‐period RRs of deaths from HNC and its subsites, including larynx, nasopharynx, and other pharynx cancers, experienced a downward trend. The RR of oral cancer, in contrast, showed an upward trend. A similar pattern was observed for the cohort effect.
We then utilized the APC model to analyze the DALYs attributable to tobacco and alcohol between 1990 and 2019. The overall net drift also declined (−0.76%, 95% CI: −1.09%, −0.44%; Table S4). The local drift in the 75–79 age group was above 0, which indicated an upward trend across the study period (Figure 2A). The net drift of oral cancer was ascending at an accelerating rate of 2.21% (95% CI: 1.91%–2.51%), while that of other anatomic subsites declined. More specifically for each age group, the upward trend was also observed among all age groups for oral cancer, 75–79 and above for larynx cancer, and 74–90 for other pharynx cancers. In contrast to only one summit for death, the age effect of DALYs plateaued from 60‐ to 74‐year‐old populations, followed by a gradual downward trend. The pattern of period and cohort effects on DALYs was similar to that on death (Figure 2B‐D).
FIGURE 2.
Effects of age, period, and cohort and the resulting local drifts on head and neck cancer DALYs attributable to tobacco and alcohol from 1990 to 2019 by anatomic site. (A) Local drifts of different age groups. (B) Fitted longitudinal age curves of disability‐adjusted life year (DALY) rate. (C) Relative risks of each time period referenced with 2000–2004. (D) Relative risk of each cohort compared with the reference cohort 1945–1949. The solid lines and shaded areas represent each metric and their 95% confidence interval (CI).
3.3. Projection and decomposition analysis of the preventable head and neck cancer burden
To predict the preventable deaths and DALYs of HNC attributable to tobacco and alcohol use from 2020 to 2039 in China, we applied the Bayesian APC model with INLA. The total ASMR was expected to decline gradually, while the ASDR was predicted to remain relatively stable between 2020 and 2039 (Figure 3). The downward trends of ASMR of each HNC anatomic site varied considerably, with the most notable decrease in larynx cancer (Figure S3). For site‐specific DALYs, the ASDR of the nasopharynx and other pharynx cancers will ascend, while that of larynx and oral cancers will descend (Figure S4). The predicted age‐specific rates of total death and DALYs by anatomic site are detailed in Figures S5–S14.
FIGURE 3.

The time trends of age‐standardized mortality rate (ASMR) and average annual percent change (ASDR) for head and neck cancer attributable to tobacco and alcohol between 1990 and 2019 and their forecasts until 2039. (A) ASMR. (B) ASDR. The dotted lines show the observed values, and the solid lines represent the predicted mean values. The fan demonstrates the predictive distribution between 5% and 95% quintiles. The shaded bands represent the intervals in an increment of 10%.
Despite the downward and unchanged trend of age‐standardized rates over the next 20 years from 2019, both the number of preventable deaths and DALYs are expected to increase dramatically (Figure 4A,C). There are an additional 42,276 deaths and 1,308,830 DALYs resulting from the combined attribution of tobacco and alcohol in 2039 compared to 1990, an increase of 186.41% and 176.50%, respectively (Tables S5 and S6). The decomposition analysis indicated the increase in death was predominantly driven by population aging (207.53%) despite the negative contribution of the age‐specific mortality rate (−52.01%; Figure 4B). The increased DALYs resulted from population aging (150.13%) and population growth (28.10%; Figure 4D). The negative contribution of the age‐specific rate was negligible (−1.73%). All site‐specific decomposition results are demonstrated in Figures S15 and S16. The percentage of death from oral cancer overtakes all other subsites in 2033 and reaches 36.78% by 2039 (Figure 5A). The percentage of DALYs from nasopharynx cancer is dominant across the whole period, despite declining from 53.99% to 40.74% (Figure 5B).
FIGURE 4.
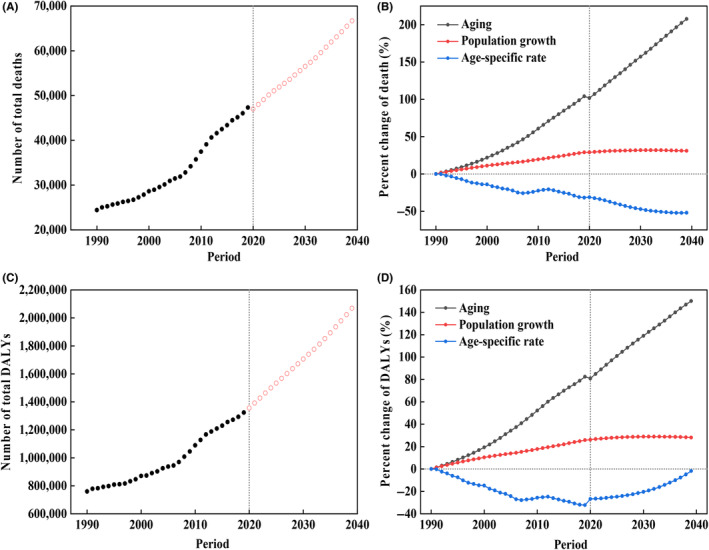
The temporal trends and contribution changes of the number of head and neck cancer death and disability‐adjusted life years (DALYs) attributable to tobacco and alcohol between 1990 and 2019 and their forecasts until 2039. (A) The trend of the total death number. (B) Contribution of changes in population aging, population growth, and age‐specific rate in the total death number. The solid and empty dots represent observed and predicted values. (C) The trend of the total DALY. (D) Contribution of changes in population aging, population growth, and age‐specific rate in the total DALY. The solid dots and empty dots represent observed and predicted values.
FIGURE 5.

The proportion of the absolute burden for each anatomic site attributable to tobacco and alcohol between 1990 and 2019 and their forecasts until 2039. (A) Changes in the proportion of the death number at each anatomic site. (B) Changes in the proportion of disability‐adjusted life year (DALY) at each anatomic site. The solid dots and empty dots represent observed and predicted values.
4. DISCUSSION
To the best of our knowledge, this is the first study to thoroughly investigate the preventable HNC burden attributable to tobacco and alcohol use by anatomic site in China. Our study provides a landscape of the estimated preventable HNC burden with the greatest approximation and its temporal trend across the study period. Based on a literature review, there are three pertinent studies worldwide. Hashibe et al. 27 indicated that the proportion of HNC cases attributable to tobacco or alcohol was 66% from the Prostate, Lung, Colorectal, and Ovarian Cancer Screening Trial. Laaksonen et al. 28 estimated the joint future PAF of HNC attributable to tobacco and alcohol was 38.5% in Australia. Kfouri et al. 29 examined the fractions of HNC attributable to tobacco and alcohol in three Brazilian regions. The fractions ranged from 86% to 90% for tobacco and 62% to 78% for alcohol, respectively. The geographical distinction existing in these international studies and our domestic study could be due to differences in culture, religion, implementation of the tobacco and alcohol control policies, and socioeconomic status.
The SEVs derived from the GBD 2019 study confirmed a substantial downward trend of tobacco use in the past three decades due to state‐level tobacco control and aroused public awareness of the detrimental role of tobacco. 30 , 31 The upward trend of alcohol consumption was largely because of the economic growth and transition from a low‐income to an upper‐middle‐income country. 32 However, the respective age‐standardized attributable mortality and DALY rates declined irrespective of the bi‐directional trend, which might result from the concomitance between tobacco and alcohol and the dominant role of tobacco. 5
When pooling the preventable burden of tobacco and alcohol use, the total number of deaths and DALYs and mortality and DALY rates still increased, with diverse statistical significance between 1990 and 2019, except for a downward trend for ASMR and ASDR. The dichotomous trends of crude and age‐standardized rates could be explained by the age effect and the positive local shifts of the older populations from our APC analysis. It is well acknowledged that age is the most common risk factor for non‐communicable diseases, especially cancer. 33 , 34 Along with aging, biological, behavioral, and environmental risks will accumulate and jeopardize population health. The compelling justification is the strong association between the mortality rate and older age, which was also confirmed by our results. In light of the downward trend of the age effect in more advanced age groups, the elderly population was subject to competing risks from other causes, which gave rise to a loss of anticipated cases. 35 In addition, the decomposition analysis indicated that the HNC burden was attributable to population aging (104.12% for death and 82.44% for DALY) and population growth (28.88% for death and 25.80% for DALY). The crude burden is anticipated to increase in the next 20 years largely due to population aging. Similarly, ASMR will continue to drop while the ASDR will remain relatively unchanged instead of following a downward trend. The decomposition analysis results revealed the negative age‐specific rate of DALY was decreasing gradually, which indicated the DALYs might rise more rapidly sooner rather than later. Therefore, the future healthcare resources for HNC prevention and control should be centered on premature mortality and disability resulting from tobacco and alcohol use.
It is worth noting that the past 30‐year period, starting from 1990, has witnessed a significant upward trend in both PAF and age‐standardized PAF for death and DALY attributable to tobacco and alcohol. The increased proportion of HNC cases attributable to tobacco and alcohol could be potentially explained by a worse prognosis of tobacco‐ and alcohol‐associated HNC compared to human papillomavirus (HPV)‐associated HNC. HPV infection is present not only in cervical cancer but also associated with a large proportion of anal, penile, vulvar, and vaginal cancer and HNC. 36 A climbing incidence of HPV‐positive HNC has been noted in recent decades, especially in developed countries. 37 Moreover, HPV‐positive HNC patients are normally associated with wild‐type p53 tumor suppressor protein, low retinoblastoma protein (pRb) levels, an improved outcome, and better response to radiation and chemotherapy. 37 In contrast, p53 is mutant, and pRb level is high in tobacco‐ and alcohol‐associated HNC, the 3‐year rate of overall survival of which was lower from retrospective clinical trials and prospective studies. 38 Our results provide additional evidence to support the discourse from a different lens. In contrast, the climbing incidence and better prognosis of HPV‐positive HNC would pose an inevitable challenge for the healthcare system to manage these cases in the near future.
With respect to the preventable burden of HNC anatomic subsites, the ASMR and ASDR of non‐oral cancers declined by different percentages across the study period. The most remarkable change (−39.52% for death and −38.08% for DALY, respectively) was observed in nasopharynx cancer, which is nearly endemic in Southern China. 39 The significant downward trend suggested the joint effort of Chinese multidisciplinary teams to effectively manage nasopharynx patients. 40 However, the number of DALY for nasopharynx cancer is still increasing remarkably and is predicted to represent 40.74% of total DALY in 2039.
Notably, all descriptive disease metrics of oral cancer increased significantly between 1990 and 2019 despite the statistically significant downward trend of tobacco SEV and no significant upward trend of alcohol SEV. Compared to non‐oral cancers, the RRs of both period and cohort effects on oral cancer demonstrated reversed trends, increasing with time. These findings indicated a potential interaction among tobacco, alcohol, and other risk factors. Furthermore, the reversed increasing trends of oral cancer revealed that these interacting risk factors were confined to oral cancer, ruling out general risk factors of HNC and further narrowing down our search scope. First, genetic copy‐number alterations in predisposition specifically to oral cancer were reported to be crucial for fueling tobacco‐ and alcohol‐associated HNC. 41 , 42 There could be an interaction between tobacco, alcohol, and genetic susceptibility, but this area remains relatively understudied. Second, betel nut chewing, highly prevalent in Asian countries, is another major risk factor for oral cancer. However, there was a lack of awareness of its carcinogenic effects and related regulation. 43 The interaction among tobacco, alcohol, and betel nut has been studied in other cancers, such as esophageal cancer, in which betel nut chewing added to the carcinogenic effect of smoking and alcohol. 44 A similar pattern was also anticipated to exist in HNC. Third, oral microbiota, such as Porphyromonas gingivalis, human herpes virus, and Candida albicans, were associated with oral cancer. 45 Interaction among tobacco, alcohol, and HPV is also possible. Their interactions with tobacco and alcohol might partially explain the aforementioned upward trend of the oral cancer burden.
Our study was not free from limitations, as highlighted in previous GBD‐based studies. The most notable limitation is data quality since the major limitation of GBD is the availability of primary data. 46 We also compared our results with the data from the Cancer Registry and found that we marginally overestimated the preventable burden. However, the patterns of trends are similar. In addition, we made several assumptions to simplify the analysis. For instance, we assumed the overlapping fractions of the tobacco and alcohol burden remained unchanged throughout our study, which might not be appropriate in a real‐world setting. However, this was the most reasonable estimation method we could use because of the unavailability of the data. Finally, the precision level of the 20‐year projection was low, which resulted in the uncertainty of the future preventable burden.
To conclude, our study provided a comprehensive understanding of the preventable HNC burden attributable to tobacco and alcohol. The combined burden of HNC could reflect the current status quo of tobacco and alcohol control for cancers, given HNC is nearly exclusively attributable to tobacco and alcohol. Although the predicted ASMR and ASDR of HNC declined, the crude burden still increased between 1990 and 2019 and is predicted to continue to increase in the next 20 years largely due to population aging. More specifically, for each anatomic site, the burden of oral cancer climbed exceptionally and was anticipated to become dominant in HNC in 2039, potentially due to a strong interaction with other risk factors. All these results were useful for policymakers to rethink the current tobacco and alcohol control policies, lean healthcare resources and develop effective prevention and control strategies for HNC.
AUTHOR CONTRIBUTIONS
Cheng Song and Youlin Qiao: Conceptualization; Cheng Song: data curation; Cheng Song and Yahan Chen: formal analysis; Cheng Song: writing—original draft; Yahan Chen and Youlin Qiao: writing—review and editing. All authors have agreed to the published version of the manuscript.
FUNDING INFORMATION
Funding for this research was provided by Merck Sharp & Dohme Corp (Grant Number: NIS009274), a subsidiary of Merck & Co., Inc., Kenilworth, NJ, USA.
CONFLICT OF INTEREST STATEMENT
Prof. Youlin Qiao is an associate editor of Cancer Science. The other authors have no conflicts of interest to declare.
ETHICS STATEMENT
Approval of the research protocol by an Institutional Review Board: N/A.
Informed Consent: N/A.
Registry and the Registration No. of the study/trial: N/A.
Animal Studies: N/A.
Supporting information
Appendix S1
ACKNOWLEDGMENTS
We appreciate the prestigious work by the GBD 2019 study collaborators.
Song C, Chen Y, Qiao Y. Preventable burden of head and neck cancer attributable to tobacco and alcohol between 1990 and 2039 in China. Cancer Sci. 2023;114:3374‐3384. doi: 10.1111/cas.15877
REFERENCES
- 1. Sung H, Ferlay J, Siegel RL, et al. Global cancer statistics 2020: GLOBOCAN estimates of incidence and mortality worldwide for 36 cancers in 185 countries. CA Cancer J Clin. 2021;71(3):209‐249. [DOI] [PubMed] [Google Scholar]
- 2. Pignon JP, le Maître A, Maillard E, Bourhis J. Meta‐analysis of chemotherapy in head and neck cancer (MACH‐NC): an update on 93 randomised trials and 17,346 patients. Radiother Oncol. 2009;92(1):4‐14. [DOI] [PubMed] [Google Scholar]
- 3. Zhang S, Sun K, Zheng R, et al. Cancer incidence and mortality in China, 2015. J Natl Cancer Center. 2021;1(1):2‐11. [DOI] [PMC free article] [PubMed] [Google Scholar]
- 4. Guo K, Xiao W, Chen X, Zhao Z, Lin Y, Chen G. Epidemiological trends of head and neck cancer: a population‐based study. Biomed Res Int. 2021;2021:1738932. [DOI] [PMC free article] [PubMed] [Google Scholar]
- 5. Hashibe M, Brennan P, Benhamou S, et al. Alcohol drinking in never users of tobacco, cigarette smoking in never drinkers, and the risk of head and neck cancer: pooled analysis in the international head and neck cancer epidemiology consortium. J Natl Cancer Inst. 2007;99(10):777‐789. [DOI] [PubMed] [Google Scholar]
- 6. Di Credico G, Polesel J, Dal Maso L, et al. Alcohol drinking and head and neck cancer risk: the joint effect of intensity and duration. Br J Cancer. 2020;123(9):1456‐1463. [DOI] [PMC free article] [PubMed] [Google Scholar]
- 7. Maier H, Dietz A, Gewelke U, Heller WD, Weidauer H. Tobacco and alcohol and the risk of head and neck cancer. Clin Investig. 1992;70(3–4):320‐327. [DOI] [PubMed] [Google Scholar]
- 8. Jethwa AR, Khariwala SS. Tobacco‐related carcinogenesis in head and neck cancer. Cancer Metastasis Rev. 2017;36(3):411‐423. [DOI] [PMC free article] [PubMed] [Google Scholar]
- 9. Kawakita D, Matsuo K. Alcohol and head and neck cancer. Cancer Metastasis Rev. 2017;36(3):425‐434. [DOI] [PubMed] [Google Scholar]
- 10. Hashibe M, Brennan P, Chuang SC, et al. Interaction between tobacco and alcohol use and the risk of head and neck cancer: pooled analysis in the international head and neck cancer epidemiology consortium. Cancer Epidemiol Biomarkers Prev. 2009;18(2):541‐550. [DOI] [PMC free article] [PubMed] [Google Scholar]
- 11. Beynon RA, Lang S, Schimansky S, et al. Tobacco smoking and alcohol drinking at diagnosis of head and neck cancer and all‐cause mortality: results from head and neck 5000, a prospective observational cohort of people with head and neck cancer. Int J Cancer. 2018;143(5):1114‐1127. [DOI] [PMC free article] [PubMed] [Google Scholar]
- 12. Li S, Ma C, Xi B. Tobacco control in China: still a long way to go. Lancet. 2016;387(10026):1375‐1376. [DOI] [PubMed] [Google Scholar]
- 13. Guo H, Quan G. Tobacco control in China and the road to healthy China 2030. Int J Tuberc Lung Dis. 2020;24(3):271‐277. [DOI] [PubMed] [Google Scholar]
- 14. Chen P, Li F, Harmer P. Healthy China 2030: moving from blueprint to action with a new focus on public health. Lancet Public Health. 2019;4(9):e447. [DOI] [PubMed] [Google Scholar]
- 15. Jiang H, Room R, Hao W. Alcohol and related health issues in China: action needed. Lancet Glob Health. 2015;3(4):e190‐e191. [DOI] [PubMed] [Google Scholar]
- 16. GBD 2019 Diseases and Injuries Collaborators . Global burden of 369 diseases and injuries in 204 countries and territories, 1990–2019: a systematic analysis for the global burden of disease study 2019. Lancet. 2020;396(10258):1204‐1222. [DOI] [PMC free article] [PubMed] [Google Scholar]
- 17. Kocarnik JM, Compton K, Dean FE, et al. Cancer incidence, mortality, years of life lost, years lived with disability, and disability‐adjusted life years for 29 cancer groups from 2010 to 2019: a systematic analysis for the global burden of disease study 2019. JAMA Oncol. 2022;8(3):420‐444. [DOI] [PMC free article] [PubMed] [Google Scholar]
- 18. Zhou M, Wang H, Zhu J, et al. Cause‐specific mortality for 240 causes in China during 1990‐2013: a systematic subnational analysis for the global burden of disease study 2013. Lancet. 2016;387(10015):251‐272. [DOI] [PubMed] [Google Scholar]
- 19. Zhou M, Wang H, Zeng X, et al. Mortality, morbidity, and risk factors in China and its provinces, 1990‐2017: a systematic analysis for the global burden of disease study 2017. Lancet. 2019;394(10204):1145‐1158. [DOI] [PMC free article] [PubMed] [Google Scholar]
- 20. Kim HJ, Fay MP, Feuer EJ, Midthune DN. Permutation tests for joinpoint regression with applications to cancer rates. Stat Med. 2000;19(3):335‐351. [DOI] [PubMed] [Google Scholar]
- 21. Rosenberg PS, Check DP, Anderson WF. A web tool for age‐period‐cohort analysis of cancer incidence and mortality rates. Cancer Epidemiol Biomarkers Prev. 2014;23(11):2296‐2302. [DOI] [PMC free article] [PubMed] [Google Scholar]
- 22. Riebler A, Held L. Projecting the future burden of cancer: Bayesian age‐period‐cohort analysis with integrated nested Laplace approximations. Biom J. 2017;59(3):531‐549. [DOI] [PubMed] [Google Scholar]
- 23. Knoll M, Furkel J, Debus J, Abdollahi A, Karch A, Stock C. An R package for an integrated evaluation of statistical approaches to cancer incidence projection. BMC Med. Res. Methodol. 2020;20(1). doi: 10.1186/s12874-020-01133-5 [DOI] [PMC free article] [PubMed] [Google Scholar]
- 24. Møller B, Fekjaer H, Hakulinen T, et al. Prediction of cancer incidence in the Nordic countries: empirical comparison of different approaches. Stat Med. 2003;22(17):2751‐2766. [DOI] [PubMed] [Google Scholar]
- 25. Cheng X, Tan L, Gao Y, Yang Y, Schwebel DC, Hu G. A new method to attribute differences in total deaths between groups to population size, age structure and age‐specific mortality rate. PloS One. 2019;14(5):e0216613. [DOI] [PMC free article] [PubMed] [Google Scholar]
- 26. Cheng X, Yang Y, Schwebel DC, et al. Population ageing and mortality during 1990‐2017: a global decomposition analysis. PLoS Med. 2020;17(6):e1003138. [DOI] [PMC free article] [PubMed] [Google Scholar]
- 27. Hashibe M, Hunt J, Wei M, Buys S, Gren L, Lee YC. Tobacco, alcohol, body mass index, physical activity, and the risk of head and neck cancer in the prostate, lung, colorectal, and ovarian (PLCO) cohort. Head Neck. 2013;35(7):914‐922. [DOI] [PubMed] [Google Scholar]
- 28. Laaksonen MA, Canfell K, MacInnis RJ, et al. The future burden of head and neck cancers attributable to modifiable behaviors in Australia: a pooled cohort study. Cancer Epidemiol Biomarkers Prev. 2021;30(8):1566‐1574. [DOI] [PubMed] [Google Scholar]
- 29. Kfouri SA, Eluf Neto J, Koifman S, et al. Fraction of head and neck cancer attributable to tobacco and alcohol in cities of three Brazilian regions. Rev Bras Epidemiol. 2018;21:e180005. [DOI] [PubMed] [Google Scholar]
- 30. Chen Z, Shin YS, Beaglehole R. Tobacco control in China: small steps towards a giant leap. Lancet. 2012;379(9818):779‐780. [DOI] [PubMed] [Google Scholar]
- 31. Goss PE, Strasser‐Weippl K, Lee‐Bychkovsky BL, et al. Challenges to effective cancer control in China, India, and Russia. Lancet Oncol. 2014;15(5):489‐538. [DOI] [PubMed] [Google Scholar]
- 32. Manthey J, Shield KD, Rylett M, Hasan OSM, Probst C, Rehm J. Global alcohol exposure between 1990 and 2017 and forecasts until 2030: a modelling study. Lancet. 2019;393(10190):2493‐2502. [DOI] [PubMed] [Google Scholar]
- 33. Li X, Lu J, Hu S, et al. The primary healthcare system in China. Lancet. 2017;390(10112):2584‐2594. [DOI] [PubMed] [Google Scholar]
- 34. Jackaman C, Tomay F, Duong L, et al. Aging and cancer: the role of macrophages and neutrophils. Ageing Res Rev. 2017;36:105‐116. [DOI] [PubMed] [Google Scholar]
- 35. Dignam JJ, Zhang Q, Kocherginsky M. The use and interpretation of competing risks regression models. Clin Cancer Res. 2012;18(8):2301‐2308. [DOI] [PMC free article] [PubMed] [Google Scholar]
- 36. de Martel C, Georges D, Bray F, Ferlay J, Clifford GM. Global burden of cancer attributable to infections in 2018: a worldwide incidence analysis. Lancet Glob Health. 2020;8(2):e180‐e190. [DOI] [PubMed] [Google Scholar]
- 37. Zandberg DP, Bhargava R, Badin S, Cullen KJ. The role of human papillomavirus in nongenital cancers. CA Cancer J Clin. 2013;63(1):57‐81. [DOI] [PubMed] [Google Scholar]
- 38. Ang KK, Harris J, Wheeler R, et al. Human papillomavirus and survival of patients with oropharyngeal cancer. N Engl J Med. 2010;363(1):24‐35. [DOI] [PMC free article] [PubMed] [Google Scholar]
- 39. Yu MC, Yuan JM. Epidemiology of nasopharyngeal carcinoma. Semin Cancer Biol. 2002;12(6):421‐429. [DOI] [PubMed] [Google Scholar]
- 40. Lang J, Hu C, Lu T, Pan J, Lin T. Chinese expert consensus on diagnosis and treatment of nasopharyngeal carcinoma: evidence from current practice and future perspectives. Cancer Manag Res. 2019;11:6365‐6376. [DOI] [PMC free article] [PubMed] [Google Scholar]
- 41. William WN Jr, Zhao X, Bianchi JJ, et al. Immune evasion in HPV(−) head and neck precancer‐cancer transition is driven by an aneuploid switch involving chromosome 9p loss. Proc Natl Acad Sci USA. 2021;118(19):e2022655118. [DOI] [PMC free article] [PubMed] [Google Scholar]
- 42. Zhao X, Cohen EEW, William WN Jr, et al. Somatic 9p24.1 alterations in HPV(−) head and neck squamous cancer dictate immune microenvironment and anti‐PD‐1 checkpoint inhibitor activity. Proc Natl Acad Sci USA. 2022;119(47):e2213835119. [DOI] [PMC free article] [PubMed] [Google Scholar]
- 43. Lechner M, Breeze CE, Vaz F, Lund VJ, Kotecha B. Betel nut chewing in high‐income countries‐lack of awareness and regulation. Lancet Oncol. 2019;20(2):181‐183. [DOI] [PubMed] [Google Scholar]
- 44. Wu IC, Lu CY, Kuo FC, et al. Interaction between cigarette, alcohol and betel nut use on esophageal cancer risk in Taiwan. Eur J Clin Invest. 2006;36(4):236‐241. [DOI] [PubMed] [Google Scholar]
- 45. Stasiewicz M, Karpiński TM. The oral microbiota and its role in carcinogenesis. Semin Cancer Biol. 2022;86(Pt 3):633‐642. [DOI] [PubMed] [Google Scholar]
- 46. Global burden of 87 risk factors in 204 countries and territories, 1990–2019: a systematic analysis for the global burden of disease study 2019. Lancet. 2020;396(10258):1223. [DOI] [PMC free article] [PubMed] [Google Scholar]
Associated Data
This section collects any data citations, data availability statements, or supplementary materials included in this article.
Supplementary Materials
Appendix S1