

Abstract
AKR7A3 is a member of the aldo‐keto reductase (AKR) protein family, whose primary purpose is to reduce aldehydes and ketones to generate primary and secondary alcohols. It has been reported that AKR7A3 is downregulated in pancreatic cancer (PC). However, the mechanism underlying the effects of AKR7A3 in PC remains largely unclarified. Here, we explored the biological function, molecular mechanism and clinical relevance of AKR7A3 in pancreatic ductal adenocarcinoma (PDAC). AKR7A3 expression was downregulated in PDAC compared with adjacent normal tissues, and the lower AKR7A3 expression was related to poor prognosis. In addition, our results demonstrated that AKR7A3 could be a potential diagnostic marker for PDAC, especially in the early stages. Knockdown of AKR7A3 promoted PDAC progression and chemoresistance, while inhibiting autophagy flux. Mechanistically, AKR7A3 affected the metastasis, autophagy, and chemoresistance of PDAC by regulating PHGDH. Overall, the present study suggests that AKR7A3 inhibits PDAC progression by regulating PHGDH‐induced autophagy. In addition, AKR7A3 inhibits chemoresistance via regulating PHGDH and may serve as a new therapeutic target for PDAC.
Keywords: autophagy, AKR7A3, pancreatic ductal adenocarcinoma, PHGDH, progression
In this study, we confirmed that AKR7A3 expression was downregulated in pancreatic cancer compared with adjacent normal tissues, and the lower AKR7A3 expression was related to poor prognosis. In addition, our results demonstrated that AKR7A3 could be a potential diagnostic marker for pancreatic cancer, especially in the early stages. Knockdown of AKR7A3 promoted pancreatic cancer progression and chemoresistance, while inhibiting autophagy flux. Mechanistically, AKR7A3 affected the metastasis, autophagy, and chemoresistance of pancreatic cancer by regulating PHGDH.

Abbreviations
- AKR
aldo‐keto reductase
- AJCC
American Joint Committee on Cancer
- AUC
area under curve
- CQ
chloroquine
- EBSS
Earle's balanced salt solution
- EMT
epithelial–mesenchymal transition
- FOLFIRINOX
a combination of anticancer drugs that includes oxaliplatin, irinotecan, fluorouracil, and folinic acid
- GSEA
gene set enrichment analysis
- GEPIA
gene expression profiling interactive analysis
- GSO
Gene Expression Omnibus
- GTEx
The Genotype‐Tissue Expression
- IHC
immunohistochemistry
- LC/MS
label‐free quantitative liquid chromatography–mass spectrometry
- PC
pancreatic cancer
- PDAC
pancreatic ductal adenocarcinoma
- PHGDH
D‐3‐phosphoglycerate dehydrogenase
- ROC
receiver‐operating characteristic curve
- TCGA
The Cancer Genome Atlas
- TEM
transmission electron microscopy
- TMA
tissue microarray
- 3‐MA
3‐methyladenine
1. INTRODUCTION
Pancreatic cancer is a highly lethal disease, with an annual mortality number almost equal to its incidence number, and PDAC is the most common malignant neoplasm of the pancreas. 1 As the early symptoms of PC are not typical, most PC patients are diagnosed at an advanced stage. The 5‐year overall survival (OS) rate is still <5% and as low as 3% in patients with locally advanced or metastatic PC. 2 , 3 For advanced PC patients, advances in chemotherapy can improve long‐term outcomes. FOLFIRINOX (a combination of anticancer drugs that includes oxaliplatin, irinotecan, fluorouracil, and folinic acid) is a standard treatment at present. 4 Our knowledge about the pathogenesis and progression mechanism of PDAC is still poorly characterized. Therefore, further research on the pathogenesis and molecular mechanisms of PDAC is crucial for identifying new biomarkers for early detection, treatment response, and prognosis prediction, as well as discovering new therapeutic targets.
Autophagy is an evolutionarily conserved catabolic process that mediates the lysosomal degradation of long‐lived proteins, defective organelles, and various protein aggregates; leads to the recycling of intracellular compounds; and ensures homeostasis. 5 , 6 Previous studies have linked autophagy to PC progression. It has been reported that autophagy can enhance the invasion and metastasis of malignant tumors. 7 However, other studies have put forward the opposite view. 8 In addition, autophagy plays multiple roles in tumor metabolism and chemoresistance mechanisms in PC. 9 , 10 , 11 However, the mechanism of how autophagy affects the occurrence and development of PDAC is still unclear.
AKR7A3 belongs to the aldo‐keto reductase (AKR) superfamily, whose primary role is to reduce aldehydes and ketones to generate primary and secondary alcohols, 12 respectively. These enzymes have been shown to play crucial roles in drug metabolism, carcinogen metabolism, and cellular metabolism. 12 , 13 Growing evidence suggests that AKR7A3 can play an essential role in the occurrence of cancers, including breast and liver cancers. 14 , 15 However, there is no research on AKR7A3 in PDAC. The present study aims to fill these gaps, which may provide a basic foundation for establishing new therapeutic options for PDAC.
In the study, the expression of AKR7A3 was detected in PDAC tissue and adjacent nontumor tissue using tissue microarray (TMA) and public database information, and the association between AKR7A3 expression and clinicopathological features (e.g., patient survival) was identified. Furthermore, we investigated the functional roles of AKR7A3 in PDAC cell metastasis, autophagy, and chemotherapy resistance through PDAC cell and animal experiments. More importantly, we demonstrated and confirmed that AKR7A3 accelerated autophagy flux during PDAC progression by inhibiting PHGDH, which in turn suppressed cell metastasis.
2. MATERIALS AND METHODS
2.1. Patient specimens and TMA
Five paired PDAC and adjacent nontumor tissues were collected from surgically resected PDAC patients in the Second Affiliated Hospital of Air Force Medical University (Xi'an, China). All specimens were frozen in liquid nitrogen until further analysis. TMA containing formalin‐fixed, paraffin‐embedded tissues from 71 PDAC patients was obtained from Outdo Biotech Company. The complete clinical information is presented in Table 1. Clinicopathological analysis was performed based on the clinicopathological features and OS data of patients.
TABLE 1.
Correlation of AKR7A3 expression with clinicopathological features of pancreatic cancer.
| Characteristic | Total (n) | AKR7A3 expression (IHC) | |||
|---|---|---|---|---|---|
| High | Low | χ2 | p‐value | ||
| Gender | |||||
| Male | 46 | 5 | 41 | 1.116 | 0.291 |
| Female | 25 | 5 | 20 | ||
| Age (years) | |||||
| ≥60 | 37 | 5 | 32 | 0.021 | 0.885 |
| <60 | 34 | 5 | 29 | ||
| T stage | |||||
| Tx | 1 | 1 | 0 | 6.457 | 0.091 |
| T1 | 2 | 0 | 2 | ||
| T2 | 55 | 9 | 46 | ||
| T3 | 13 | 1 | 12 | ||
| N stage | |||||
| Nx | 4 | 1 | 3 | 6.233 | 0.044 |
| N0 | 34 | 8 | 26 | ||
| N1 | 33 | 1 | 32 | ||
| AJCC stage | |||||
| I | 25 | 8 | 17 | 13.841 | 0.003 |
| II | 43 | 1 | 42 | ||
| IV | 1 | 0 | 1 | ||
| Unknown | 2 | 1 | 1 | ||
| Pathological grade | |||||
| I | 8 | 2 | 6 | 2.287 | 0.319 |
| II | 54 | 8 | 46 | ||
| III | 9 | 0 | 9 | ||
Abbreviations: AJCC, American Joint Committee on Cancer; IHC, immunohistochemistry.
2.2. Bioinformatics analysis
To evaluate the clinical significance of AKR7A3 in PDAC, the gene expression profiles of GSE15471, GSE 28735, and GSE62452 were loaded from the Gene Expression Omnibus (GEO) online database (https://www.ncbi.nlm.nih.gov/geo/), and the mRNA expression of AKR7A3 in PDAC and healthy tissues was retrieved and analyzed. In addition, gene expression data were obtained from TCGA (https://portal.gdc.cancer.gov/) and determined by gene set enrichment analysis (GSEA).
2.3. Cell culture
In our study, the PDAC cells (PANC‐1 and MIAPaCa‐2) were supplied by Procell Life Science & Technology Company. All PDAC cells were identified by short tandem repeat (STR) and tested for mycoplasma‐free status. These cells were grown in DMEM (Gibco) with 10% FBS (Gibco) and maintained in a humidified environment with 5% CO2 at 37°C.
2.4. Immunohistochemistry
Immunohistochemistry (IHC) and TMA experiments were conducted as described previously. 16 The overall score for immunostaining was equal to the intensity score multiplied by the percentage of stained cells: negative (0), weakly positive (1–4), moderately positive (5–8), and strongly positive (9–12). A staining score ≤4 denoted low AKR7A3 expression, while a score >4 denoted high AKR7A3 expression.
2.5. Establishment of stable cell lines
To construct stable cell lines with AKR7A3 and PHGDH overexpression or knockdown, vectors containing short‐hairpin RNA (shRNA) sequences against AKR7A3 and PHGDH (Vigene Biosciences) were prepared and cloned into pLKO.1 vector. Lentiviral vectors encoding human AKR7A3 genes were constructed in the pLent‐EF1a plasmid (Vigene Biosciences; Table S1). HEK293T cells were cotransfected with all the plasmids and the packaging plasmids (pMD2G and psPAX2). Viral supernatant was collected after transfection for 48–72 h. The PDAC cells were infected with lentivirus. After overnight incubation, these cells were selected by 4 μg/mL puromycin.
2.6. Western blotting
The protein of PDAC cells or tissues was extracted with the radio immunoprecipitation assay buffer (Beyotime) supplemented with a protease/phosphatase inhibitor cocktail (Roche). Western blotting experiments were conducted as described previously (Table S2). 16 Protein bands were determined with enhanced chemiluminescence using the BIO‐RAD ChemiDoc XRS+ imaging system.
2.7. Transwell assay
Cell invasion and migration were performed using 8‐μm‐pore transwell compartments (BD Biosciences). For migration assay, appropriate cells were suspended in serum‐free medium and seeded directly into the top compartment. For invasion assay, the diluted Matrigel (1:20) was added to each well and then incubated at 37°C for 1 h. Appropriate cells were suspended in serum‐free medium and grown directly in the top compartment. After 36 h, the cells were fixed with 95% ethanol for 10 min, and cell staining was performed with 1% crystal violet for 20 min. Subsequently, the chamber was rinsed with tap water, and five random views were recorded under a light microscope (Nikon).
2.8. Label‐free quantitative LC/MS proteomics analysis
AKR7A3‐silenced MIAPaCa‐2 and control cells were grown in 100‐mm culture dishes in triplicate. Upon reaching 90% confluency, cells were digested with trypsin and rinsed thrice with PBS. Label‐free quantitative LC/MS proteomics analysis was conducted by Mhelix Biotech Company.
2.9. Animal experiments
Female nude mice (4–6 weeks old, weighing 16 ~ 20 g) were supplied by the Air Force Medical University Animal Center and then randomly assigned to two groups. Approximately 3 × 10⁶ MIAPaCa‐2 shAKR7A3 or shControl cells were injected into mice via the tail veins. The mice were then kept for 8 weeks. After completing the experiment, the mice were measured and photographed, and then sacrificed. In addition, the livers were excised and embedded in paraffin for hematoxylin–eosin (HE) staining.
2.10. Confocal microscopy
A lentiviral vector containing GFP‐mRFP‐LC3B plasmid was established by HANBIO. For examining autophagic flux, 1.5 × 10⁴ PANC‐1 or MIAPaCa‐2 cells with AKR7A3 knockdown were grown in laser confocal petri dish. Two hours after lentivirus transfection, the medium was changed and incubated for 36 h. The cells were fixed with 4% paraformaldehyde for 10 min. Images were randomly captured using a confocal laser‐scanning microscope (OLYMPUS). For quantification, we counted the number of GFP‐RFP‐LC3 dots in three to five independent visual fields.
2.11. Transmission electron microscopy (TEM)
After trypsin digestion and harvesting via centrifugation, the cells were fixed with 2.5% glutaraldehyde for 4 h overnight, rinsed with PBS, and then fixed in 1% osmium tetroxide at 4°C for 2 h. Ultrathin (90 nm) sections were harvested on copper grids and stained with uranyl acetate/lead citrate. Lastly, images were evaluated using a TECNAIG2 Spirit BioTWINTEM (FEI, English). The number of autophagosomes per cytoplasmic area was quantified by counting three to five cells per sample.
2.12. Drug treatment and cell viability assays
The cells (5000 cells/well) were grown in 96‐well plates and exposed to oxaliplatin (50 or 100 μM) or fluorouracil (10 or 20 μg/mL) for 0, 24, 48, and 72 h. CCK8 assay was performed to measure cell viability. The percentage of viable cells was measured as follows: cell viability (%) = A450 of treated cells/A450 of untreated cells.
2.13. Statistical analysis
All statistical analyses were evaluated with SPSS 21.0 or GraphPad Prism 8.0. The data are expressed as mean ± SD. Statistical differences were analyzed with two‐tailed Student's t‐test or ANOVA analysis. The correlation between AKR7A3 expression and clinicopathological characteristics was assessed using the chi‐square test or Fisher Exact test. Survival curve was plotted with the Kaplan–Meier curves, and the log‐rank test was employed to compare the significant differences. Both univariate and multivariate analyses were conducted using the Cox proportional hazard model. The diagnostic values of AKR7A3 were determined by ROC curves. p‐value < 0.05 was deemed statistically significant.
3. RESULTS
3.1. AKR7A3 expression is significantly downregulated and associated with poor survival in PDAC patients
First, the mRNA expression of AKR7A3 in various tumor and adjacent nontumor tissues was examined using the GEPIA database. AKR7A3 expression was remarkably downregulated in pancreatic adenocarcinoma (p < 0.05, Figure 1A). Additionally, the expression levels were assessed by analyzing TCGA dataset and GTEx databases (T = 143, N = 171) in PDAC. It was found that AKR7A3 mRNA expression was markedly downregulated in PDAC (Figure 1B). Furthermore, the same results were obtained in the GSE15471, GSE62452, and GSE28735 datasets (Figure S1A–C). Western blotting and IHC results also revealed that AKR7A3 expression was downregulated in PDAC tissue specimens (Figure 1C, D). The ROC analyses of TCGA and GTEx showed excellent diagnostic performance of AKR7A3 with AUC = 0.957, sensitivity = 92.31%, and specificity = 87.13% (Figure 1E). As demonstrated in Figure S1D–F, AKR7A3 also exhibited a potential diagnostic value. Additionally, according to the abovementioned H‐SCORE tissues, the AUC of AKR7A3 in distinguishing PDAC tissues from nontumor tissues was 0.748 (Figure S1G). The stage I patients were further separated, and the diagnostic value of AKR7A3 was analyzed in TCGA and GTEx with AUC = 0.983, sensitivity = 100%, and specificity = 91.23% (Figure 1F). Collectively, these data imply that AKR7A3 exhibits potential as a diagnostic marker for PDAC, especially in the early stages.
FIGURE 1.
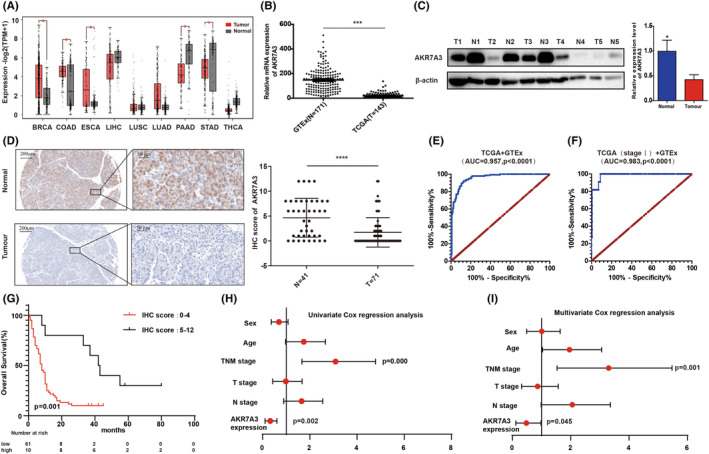
AKR7A3 expression level is significantly downregulated and associated with poor survival in pancreatic ductal adenocarcinoma (PDAC) patients. (A) AKR7A3 mRNA expression levels in different tumor samples and the corresponding normal samples. (B–D) TCGA and The Genotype‐Tissue Expression (GTEx) databases were analyzed by Western blotting and immunohistochemistry (IHC) assays to show the expression levels of AKR7A3 in PDAC tissue samples and matched normal samples. Scale bar (left) = 200 μm, scale bar (right) = 50 μm. (E, F) ROC curves for PDAC patients in TCGA and GTEx datasets. (G) Survival curve was plotted with the Kaplan–Meier curves. (H, I) Univariate and multivariate Cox regression analyses were performed. *p < 0.05, ****p < 0.0001.
To evaluate the clinical value of AKR7A3, the relationship between AKR7A3 expression and clinical features was determined in 71 PDAC patients from TMA. The results demonstrated that AKR7A3 expression was significantly associated with N stage and American Joint Committee on Cancer (AJCC) stage (p = 0.044 or 0.003, respectively; Table 1). Kaplan–Meier analysis showed that patients with higher AKR7A3 had significantly longer OS than those having low AKR7A3 expression (median 42.5 months vs. 8.0 months; hazard ratio 0.3423 [0.1831–0.6397]; p = 0.001) (Figure 1G). Univariate and multivariate analysis demonstrated that AKR7A3 expression was positively correlated with OS (Figure 1H,I). Taken together, AKR7A3 was downregulated in PDAC, and low AKR7A3 expression might be an independent risk factor for predicting PDAC prognosis.
3.2. AKR7A3 inhibits PDAC cell metastasis in vivo and in vitro
Gene set enrichment analysis results indicated that there was a negative correlation between AKR7A3 expression and cell adhesion pathway in PC (Figure 2A). These findings reveal that AKR7A3 may play a key role in PDAC cell metastasis. To verify the role of AKR7A3 in PDAC metastasis, we first conducted invasion and migration assays in vitro. The data indicated that AKR7A3 overexpression suppressed the invasion and migration of PANC‐1 and MIAPaCa‐2 cells (Figure 2B,C). In contrast, knockdown of AKR7A3 in PANC‐1 and MIAPaCa‐2 cells produced the opposite effects (Figure 2D,E). To validate the role of AKR7A3 in PDAC metastasis in vivo, MIAPaCa‐2‐luciferase cells with shAKR7A3 and control cells were injected into nude mice. After 8 weeks, AKR7A3 knockdown obviously promoted PDAC cell liver metastasis, as demonstrated by bioluminescence imaging (Figure 2F) and the number of liver metastatic lesions (Figure 2G,H). Furthermore, HE staining of the liver metastatic lesions showed that the size of nests was also larger in mice injected with shAKR7A3 PDAC cells (Figure 2I).
FIGURE 2.

AKR7A3 inhibits pancreatic ductal adenocarcinoma (PDAC) cell metastasis in vitro and in vivo. (A) Gene set enrichment analysis (GSEA) suggested that many genes related to cell adhesion are enriched in pancreatic cancer (PC) patients with low AKR7A3 expression. (B–E) The migration and invasion abilities were detected in AKR7A3‐overexpressing or ‐silenced PANC‐1, MIAPaCa‐2, and the corresponding control cells using transwell assays. Scale bar = 200 μm. Results are shown as the mean ± SD of three independent replicates. (F) Representative bioluminescence imaging of mice 8 weeks after tail veins injection. (G, H) Representative images of the metastatic nodes in the livers (scale bars = 5 mm) and quantification of the metastatic nodes (right panel). (I) H&E‐stained liver sections (scale bars = 200 μm). (J) Western blotting analysis of E‐cadherin, N‐ cadherin, vimentin, and AKR7A3 protein expression. *p < 0.05, **p < 0.01, ***p < 0.001.
Since epithelial–mesenchymal transition (EMT) is a crucial mechanism that mediates cancer metastasis, 17 we determined whether AKR7A3 can regulate EMT in PDAC cells. The results of Western blotting confirmed that AKR7A3 knockdown in PANC‐1 and MIAPaCa‐2 cells elevated the expression of N‐cadherin and vimentin, while reducing that of E‐cadherin (Figure 2J).
3.3. AKR7A3 expression levels affect PDAC cell autophagy
Previous research has confirmed that autophagy plays a key role in tumorigenesis. 18 However, the mechanism of how autophagy affects tumorigenesis remains elusive.
To better elucidate the role of AKR7A3 in tumor occurrence, GSEA showed that numerous genes related to metabolism were enriched in the high‐AKR7A3‐expression group (Figure S2A–E). Furthermore, we found that the genes responsible for autophagy, which could generate different sources of metabolic fuel, were also coexpressed with AKR7A3. 19 Therefore, we further explored whether AKR7A3 expression was related to autophagy in PDAC (Figure 3A ).
FIGURE 3.

AKR7A3 expression levels affect pancreatic ductal adenocarcinoma (PDAC) cell autophagy. (A) Gene set enrichment analysis (GSEA) showed that many genes related to autophagy were enriched in pancreatic cancer (PC) patients with high AKR7A3 expression levels. (B, C) The protein levels of LC3, p62, and AKR7A3 were examined in PANC‐1 and MIAPaCa‐2 cells with stable knockdown of AKR7A3 or control. (D–F) The protein levels of LC3, p62, and AKR7A3 were examined in the absence or presence of CQ (10 μM for 2 h) or EBSS for 24 h. (G) Immunofluorescence images of PANC‐1 and MIAPaCa‐2 cells with shAKR7A3 or control transfected with GFP‐mRFP‐LC3 for 36 h. (H) Representative electron micrographs of autophagic vesicles in PANC‐1 and MIAPaCa‐2 cells with shAKR7A3 or control. Data are presented as mean ± S.D from three independent experiments. **p < 0.01.
MAP1LC3/LC3 and SQSTM1/p62 are the most widely used molecular biomarkers in current autophagy research. 20 It was observed that the protein levels of LC3II reduced most significantly after AKR7A3 knockdown, while P62 protein expression was markedly elevated (Figure 3B,C ). Besides, AKR7A3 knockdown also decreased LC3II levels after treatment with/without chloroquine (CQ) but had the opposite effect on P62 level (Figure 3D,E ).Similar data were obtained under both normal and EBSS conditions, where EBSS is an autophagy agonist that induces autophagy through starvation (Figure 3F ). In contrast, LC3II levels were dramatically increased in AKR7A3‐overexpressing cells, while SQSTM1/P62 levels were reduced in the absence or presence of CQ (Figure S3A,B).
To better investigate the effects of AKR7A3 on the autophagy process, the GFP‐mRFP‐LC3 double fluorescence system was employed. In GFP‐mRFP‐LC3B staining, only autophagosomes were detected by GFP binding to LC3, while mRFP detected both autophagosomes and lysosomes. The merge of green and red fluorescence showed yellow dots and indicated autophagosomes. 21 , 22 The results of immunofluorescence staining demonstrated that the number of LC3 dots was remarkably reduced in shAKR7A3‐transfected PANC‐1 and MIAPaCa‐2 cells (Figure 3G). Moreover, TEM data also showed a decrease in autophagosomes in the cytoplasm of shAKR7A3‐transfected PANC‐1 and MIAPaCa‐2 cells (Figure 3H). Altogether, our findings demonstrate that AKR7A3 overexpression and knockdown can induce and inhibit autophagy, respectively, in PDAC cells.
3.4. AKR7A3 regulates autophagy by phosphorylating Beclin‐1 in PDAC cells via the PHGHD–p‐AMPK pathway
To further elucidate the molecular mechanisms of AKR7A3 promoting autophagy and inhibiting metastasis in PDAC, label‐free quantitative proteomics analysis was conducted to assess differentially expressed proteins mediated by AKR7A3.The findings demonstrated that AKR7A3 knockdown could downregulate 129 proteins (fold change <0.67) and upregulate 167 proteins (fold change >1.5); the adjusted p‐value (FDR) <0.05 (Figure 4A). Among these proteins, PHGDH has attracted our attention. The protein expression of PHGDH was elevated in PANC‐1 and MIAPaCa‐2 cells with AKR7A3 knockdown (Figure 4B, C ).
FIGURE 4.
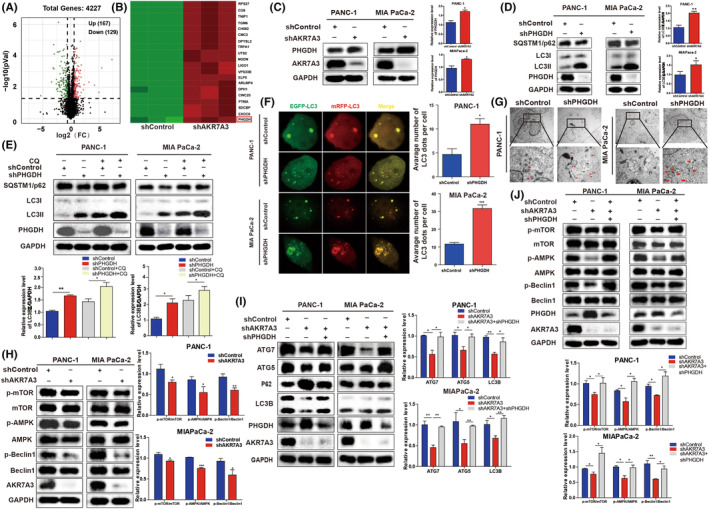
AKR7A3 regulates autophagy by phosphorylating Beclin‐1 in pancreatic ductal adenocarcinoma (PDAC) cells via PHGHD. (A, B) Volcano plot and heat map showing some differentially expressed proteins between AKR7A3‐silenced MIAPaCa‐2 and control group cells identified by label‐free quantitative proteomics technology. (C) The expression level of AKR7A3 was negatively correlated with that of PHGDH using Western blotting. (D, E) The protein levels of LC3, p62, and PHGDH were examined in PANC‐1 and MIAPaCa‐2 cells with shPHGDH in the absence or presence of CQ (10 μM for 2 h). (F) Immunofluorescence images of PANC‐1 and MIAPaCa‐2 cells with shPHGDH or control transfected with GFP‐mRFP‐LC3 for 36 h. (G) Representative electron micrographs of autophagic vesicles in PANC‐1 and MIAPaCa‐2 cells with shPHGDH or control. (H) Western blot was performed to investigate the influence of AKR7A3 on the AMPK and Beclin1 pathways. (I) The expression levels of autophagy‐related proteins in AKR7A3 KD or scrambled PDAC cells transfected with PHGDH shRNA. (J) The expression levels of proteins on the AMPK and Beclin1 pathways in AKR7A3 KD or scrambled PDAC cells transfected with PHGDH shRNA. *p < 0.05, ***p < 0.001.
PHGDH has been reported to be an oncogene and plays a critical role in autophagy in cancer progression. 23 , 24 , 25 To elucidate the role of PHGDH in regulating autophagy in PDAC, PHGDH was stably silenced in PANC‐1 and MIAPaCa‐2 cells. Notably, the protein level of LC3II was remarkably increased, while SQSTM1/P62 level was reduced in PHGDH‐silenced cells (Figure 4D ). It was also observed that PHGDH knockdown accelerated LC3II levels after treatment with/without CQ, but exhibited an opposite effect on P62 level (Figure 4E ). Meanwhile, we found that PHGDH overexpression could markedly downregulate LC3II level and upregulate P62 level after treatment with CQ or EBSS (Figure S3C–F ).
To further verify whether PHGDH can promote autophagosome maturation, a GFP‐mRFP‐LC3B construct was employed to determine autophagic flux. Notably, the number of LC3 dots was remarkably elevated in shRNA‐transfected PANC‐1 and MIAPaCa‐2 cells (Figure 4F ). Moreover, TEM also demonstrated an elevation in autophagosomes in the cytoplasm of PANC‐1 and MIAPaCa‐2 cells transfected with shPHGDH (Figure 4G ). Taken together, these data indicate that PHGDH depletion promotes autophagy flux in PDAC.
A previous study on embryonal carcinoma stem‐like cells showed that PHGDH KD‐mediated upregulation of autophagy is mediated by p‐AMPK through phosphorylation of Beclin‐1 in a p‐mTOR‐independent manner. 25 We validated this result in PDAC. As demonstrated in Figure S3G, the levels of p‐AMPK and p‐mTOR were upregulated via PHGDH knockdown. Accordingly, it was noted that PHDGH KD elevated the level of p‐Beclin‐1. In addition, the upregulated expression of p‐AMPK was not accompanied by the increased level of p‐TSC2. This result is consistent with the mechanism of PHGDH regulating autophagy in cancer stem‐like cells. Altogether, these results show that the upregulation of PHGDH knockdown‐mediated autophagy is regulated by p‐AMPK via Beclin‐1 phosphorylation in PDAC.
3.5. PHGHD is responsible for AKR7A3‐mediated autophagy in PDAC cells
To confirm whether AKR7A3 can accelerate PDAC autophagy via PHGDH, first we detected the expression of the AMPK–Beclin1 axis‐associated protein in shAKR7A3‐transfected PANC‐1 and MIAPaCa‐2 cells. In both cell lines, shAKR7A3 was demonstrated to suppress the AMPK and Beclin1 signaling pathways regulating autophagy (Figure 4H). Our study demonstrated that AKR7A3 could downregulate the protein expression level of PHGDH. Hence, we knocked down PHGDH in AKR7A3‐silenced PANC‐1 and MIAPaCa‐2 cells and found that PHGDH silencing rescued the expression of autophagy markers, including ATG5, ATG7, and LC3II and partially attenuated P62 (Figure 4I). In addition, in AKR7A3 knockdown PDAC cells, the expression levels of p‐mTOR, p‐AMPK, and p‐Beclin1 were significantly reduced. When we knocked down PHGDH in AKR7A3‐silenced PDAC cells, we found that PHGDH silencing rescued the expression of p‐mTOR, p‐AMPK, and p‐Beclin1. This result shows that AKR7A3 knockdown‐mediated autophagy is facilitated by PHGDH‐regulated p‐AMPK through phosphorylation of Beclin‐1 in a p‐mTOR‐independent manner (Figure 4J).
3.6. AKR7A3 suppresses the progression of PDAC by regulating PHGDH‐induced autophagy
It has been shown that PHGDH plays a vital role in the progression of PDAC 24 . Knockdown of PHGDH in PDAC cells dramatically suppressed cell invasion and migration (Figure 5A,B). Western blotting also confirmed that knockdown of PHGDH in PDAC cells reduced the expression of N‐cadherin and vimentin while elevating that of E‐cadherin (Figure 5C). Overall, the results reveal that PHGDH promotes metastasis and EMT progression of PDAC cells. Furthermore, the expression of PHGDH was suppressed in shAKR7A3 PDAC cells using its specific shRNA, which dramatically suppressed the invasion and migration of PDAC cells induced by shAKR7A3 (Figure 5D,E).
FIGURE 5.

AKR7A3 suppresses the progression of pancreatic ductal adenocarcinoma (PDAC) by regulating PHGDH‐induced autophagy. (A, B) The migration and invasion abilities were detected in PHGDH‐silenced PANC‐1, MIAPaCa‐2, and the corresponding control cells using transwell assays. Scalebar = 200 μm. Results are shown as the mean ± SD of three independent replicates. (C) The expression levels of metastasis‐related proteins in PHGDH‐silenced PANC‐1, MIAPaCa‐2, and the corresponding control cells using Western blotting analysis. (D, E) The migration and invasion abilities were detected in AKR7A3 KD or scrambled PDAC cells transfected with PHGDH shRNA using transwell assays. Scalebar = 200 μm. (F, G) The migration and invasion abilities were detected in AKR7A3‐silenced PANC‐1, MIAPaCa‐2, and the corresponding control cells in the absence or presence of 3‐MA (5 mM for 24 h) using transwell assays. Scalebar = 200 μm. **p < 0.01, ***p < 0.001, ****p < 0.0001.
The regulation of autophagy can contribute to the invasion and migration of tumor cells. 8 , 22 Furthermore, AKR7A3 knockdown‐regulated metastasis effects were further enhanced after cotreatment with shAKR7A3 and 3‐MA (Figure 5F, G). These findings indicated that AKR7A3 overexpression suppressed PDAC cell invasion and migration via autophagy. Collectively, these data imply that the promotion of PDAC progression by AKR7A3 knockdown is dependent on the regulation of PHGDH‐inhibited autophagy.
3.7. AKR7A3 inhibits chemoresistance in PC cells
For patients with advanced PC, fluorouracil and oxaliplatin are the most commonly used chemotherapy drugs. 4 GSEA results demonstrated that AKR7A3 expression was positively correlated with drug metabolism in PC cells (Figures 6A and S2F).To assess the effects of AKR7A3 on chemoresistance in PDAC, oxaliplatin (50 or 100 μM) and fluorouracil (10 or 20 μg/mL) were employed to treat MIAPaCa‐2‐shAKR7A3 cells together with their respective control cells. The findings demonstrated that AKR7A3‐silenced MIAPaCa‐2 cells were more prone to survive under oxaliplatin and fluorouracil treatment (Figure 6B). Previous studies have demonstrated that knockdown of PHGDH enhances sensitivity to platinum‐based chemotherapy agents and fluorouracil in malignant tumors. 26 , 27 Therefore, PHGDH was knocked down in AKR7A3‐silenced MiaPaCa‐2 cells, and it was found that PHGDH silencing reduced cell survival under oxaliplatin and fluorouracil treatment (Figure 6C‐F).These findings suggest that AKR7A3 can inhibit chemoresistance of PDAC cells by modulating PHGDH.
FIGURE 6.

AKR7A3 inhibits chemoresistance in pancreatic ductal adenocarcinoma (PDAC) cells. (A) Gene set enrichment analysis (GSEA) showing a significant positive correlation between AKR7A3 expression and the drug metabolism pathway in pancreatic cancer (PC). (B) Cell viability assay of MIAPaCa‐2 control or shRNA‐transfected cells after treatment with gradient concentrations of oxaliplatin and fluorouracil. (C–F) Cell viability assay of AKR7A3 KD or scrambled MIAPaCa‐2 cells transfected with PHGDH shRNA after treatment with gradient concentrations of oxaliplatin and fluorouracil. *p < 0.05, **p < 0.01, ***p < 0.001.
4. DISCUSSION
Pancreatic cancer is a solid tumor with a 5‐year survival rate of <5%. This is mainly because PC is often diagnosed at a late stage. Thus, in order to find new targets for early diagnosis and treatment, it is necessary to explore the molecular mechanism underlying the development of PC. It has been reported that AKR7A3 expression levels are remarkably downregulated in PC samples. 28 However, the effect of AKR7A3 on PC has not been examined. Herein, using tissue samples, publicly available databases, and TMA, we confirmed that AKR7A3 expression was decreased in PDAC tissues. Additionally, it was observed that PDAC patients with higher AKR7A3 expression levels had longer OS. Consistent with previous studies on liver cancer and breast cancer, low expression of AKR7A3 is associated with poor survival rate. 14 , 15 More importantly, AKR7A3 can be used as a diagnostic indicator for PDAC, especially early PDAC. Functionally, this study revealed that AKR7A3 suppressed PDAC metastasis and EMT in both cell and animal models. This result is consistent with the study of AKR7A3 in hepatocellular carcinoma, where AKR7A3 inhibited tumor cell metastasis. 14 In addition, we investigated the effect of AKR7A3 on autophagy in PDAC. AKR7A3 can promote autophagy in pancreatic cancer. Mechanistically, AKR7A3 mediates PDAC metastasis and autophagy at least in part through PHGDH, which could regulate PDAC cell invasion, migration and chemoresistance (Figure 7). Altogether, low AKR7A3 expression was related to more aggressive characteristics and poorer survival. Dual inhibition of AKR7A3 and autophagy exhibited synergistic metastatic effects, suggesting a promising therapeutic strategy for PDAC metastasis.
FIGURE 7.

Schematic diagram depicting the mechanism by which suppressor of aldo‐keto reductase family 7, member A3 promotes pancreatic ductal adenocarcinoma (PDAC) cell metastasis via the 3‐phosphoglycerate dehydrogenase target of AMPK–Beclin1 pathway‐mediated autophagy.
At present, there are few studies on AKR7A3 in tumors, mainly focusing on liver cancer, 14 , 29 and the potential role of AKR7A3 in PDAC, especially metastasis, still remains unknown. Previous studies have indicated that its strong tumor suppressor function and low chemoresistance may be associated with the downregulation of the NF‐κB, c‐Jun, and ERK signaling pathways in hepatocellular carcinoma. Our research shows that AKR7A3 suppressed PDAC metastasis and EMT in cell and animal models. However, the effects of AKR7A3 on PDAC malignant behavior and the underlying mechanism are still unclear.
Autophagy is related to the development and progression of cancer and plays a role in tumor inhibition or promotion in distinct contexts and stages of cancer progression. The correlation between AKR7A3 expression and the autophagy pathway was observed. Hence, the effect of AKR7A3 on autophagy in PDAC was further investigated. Our data demonstrated that downregulation of AKR7A3 could significantly impair autophagy flux and AKR7A3 overexpression promoted autophagy. The use of autophagy inhibitors (CQ) or agonists (EBSS) further confirmed that AKR7A3 was involved in PDAC cell autophagy.
To further elucidate the molecular mechanism of AKR7A3 regulating PDAC progression and autophagy, we performed proteomics analysis of differentially expressed proteins in control cells and AKR7A3‐silenced MIAPaCa‐2 cells. Label‐free quantitative proteomics analysis revealed that 296 proteins were differentially regulated, among which the PHGDH gene attracted our attention. AKR7A3 knockdown upregulated the expression levels of PHGDH in PDAC cells compared with control cells, as verified by Western blot analysis.
PHGDH, a rate‐limiting enzyme responsible for the conversion of 3‐phosphoglycerate to serine, is a key molecule of cell development and metabolism. 30 PHGDH has been shown to be extensively upregulated in different cancers, including PC, 23 gastric cancer, 31 and colorectal cancer. 32 PHGDH plays vital roles in cell proliferation, cancer drug resistance, and metastasis. 33 In this study, we observed that silencing PHGDH could suppress the invasion and migration of PDAC cells. Besides, we found that PHGDH could affect the autophagy of PDAC through the AMPK–Beclin1 pathway. This result is consistent with the mechanism of PHGDH regulating autophagy in cancer stem‐like cells.
To further understand the molecular mechanisms of AKR7A3 mediating PDAC progression and autophagy, we knocked down PHGDH in AKR7A3‐silenced PDAC cells, which dramatically inhibited cell invasion and migration. Next, our results demonstrated that simultaneous silencing AKR7A3 and PHGDH could rescue autophagy flux in PDAC cells. In addition, AMPK–Beclin1 axis, including p‐AMPK and p‐Beclin1, was upregulated. Interestingly, our further results showed that 3‐MA‐mediated autophagy inhibition significantly promoted the effects of AKR7A3 knockdown on cell invasion and migration capacity. Previous studies have suggested that interventions aimed at increasing autophagy during cancer therapy should be considered. 34 Here, we found that the combination of autophagy inhibition and AKR7A3 inhibition could further promote the metastatic effect of PDAC cells.
Resistance to therapy contributes to poor PC patient outcomes. 35 GSEA data revealed that the expression of AKR7A3 in PC was related to drug metabolism. ShAKR7A3 and control MIAPaCa‐2 cells were exposed to oxaliplatin and fluorouracil. ShAKR7A3 MIAPaCa‐2 cells exhibited higher chemoresistance than control cells. Because PHGDH drives indirect nucleotide synthesis, upregulation of PHGDH could improve DNA damage response in cisplatin‐treated cells. 36 Cell viability assays were conducted on both AKR7A3‐ and PHGDH‐silenced cells treated with oxaliplatin and fluorouracil in a gradient concentration and vehicle control. Interestingly, further silencing of PHGDH in shAKR7A3 PDAC cells could reverse the drug resistance induced by shAKR7A3.
In conclusion, this study reveals that AKR7A3 is downregulated in PDAC, which is associated with poor prognosis in PDAC patients. Low expression of AKR7A3 is related to aggressive tumor features and decreased autophagic flux. Through high‐sensitivity label‐free quantitative proteomics, we speculate that AKR7A3‐PHGDH axis‐mediated autophagic flux may contribute to the inhibition of PDAC development. In addition, AKR7A3 could inhibit chemoresistance of PDAC cells. Thus, AKR7A3 may be an important biomarker for PDAC diagnosis and prognosis prediction, and targeting AKR7A3 and autophagy is an ideal therapeutic strategy for PDAC patients.
AUTHOR CONTRIBUTIONS
Study concept and design: Haichuan Su, Yang Song, and Junqiang Li. Performing the experiments and data analysis: Lei Hua, Jie Min, Ronglin Wang, Hong Li, and Yongdong Guo. Collecting the tissue samples: Shanshan Li and Peixiang Ma. IHC staining: Dongxue Gan, Jing Yang, and Jingjie Shi. Animal experiment: Lei Hua and Cheng Yang. Writing the manuscript: Lei Hua. Reviewing and revising the manuscript: Haichuan Su, Yang Song, and Jie Min. All authors read and approved the final manuscript.
FUNDING INFORMATION
This study was supported by a grant from the National Natural Science Foundation of China to Haichuan Su (No. 31571414) and Key Research and Development Projects of Shaanxi Province (No.2022ZDLSF03‐01).
CONFLICT OF INTEREST STATEMENT
None of the authors report any conflicts of interest in the study.
ETHICS APPROVAL AND CONSENT TO PARTICIPATE
Approval of the research protocol by an Institutional Reviewer Board: The study protocol was approved by the Ethics Committee of the Tangdu Hospital of Air Force Medical University (Approval No. 202103–085).
INFORMED CONSENT
Informed consent was obtained from the patients.
Registry and the Registration No. of the study/trial: N/A.
Animal Studies: The animal study was approved by the Ethics Committee of Animal Experiments of Air Force Medical University (Approval No.IACUC‐20211159).
CONSENT FOR PUBLICATION
All authors agree to publish this manuscript.
Supporting information
Figure S1.
Figure S2.
Figure S3.
Table S1.
Table S2.
ACKNOWLEDGMENTS
The authors would like to express their gratitude to EditSprings (https://www.editsprings.cn) for the expert linguistic services provided.
Hua L, Song Y, Min J, et al. AKR7A3 modulates the metastasis of pancreatic ductal adenocarcinoma through regulating PHGDH‐suppressed autophagy. Cancer Sci. 2023;114:3101‐3113. doi: 10.1111/cas.15798
Lei Hua and Yang Song equal contributors.
Contributor Information
Junqiang Li, Email: jjunqiang@126.com.
Haichuan Su, Email: suhc@fmmu.edu.cn.
DATA AVAILABILITY STATEMENT
The datasets used in this study are available from the corresponding author on reasonable request.
REFERENCES
- 1. Sung H, Ferlay J, Siegel RL, et al. Global cancer statistics 2020: GLOBOCAN estimates of incidence and mortality worldwide for 36 cancers in 185 countries. CA Cancer J Clin. 2021;71(3):209‐249. [DOI] [PubMed] [Google Scholar]
- 2. Sun W, Ren Y, Lu Z, Zhao X. The potential roles of exosomes in pancreatic cancer initiation and metastasis. Mol Cancer. 2020;19(1):135. [DOI] [PMC free article] [PubMed] [Google Scholar]
- 3. Siegel RL, Miller KD, Jemal A. Cancer statistics, 2016. CA Cancer J Clin. 2016;66(1):7‐30. [DOI] [PubMed] [Google Scholar]
- 4. Conroy T, Hammel P, Hebbar M, et al. FOLFIRINOX or gemcitabine as adjuvant therapy for pancreatic cancer. N Engl J Med. 2018;379(25):2395‐2406. [DOI] [PubMed] [Google Scholar]
- 5. Mizushima N, Komatsu M. Autophagy: renovation of cells and tissues. Cell. 2011;147(4):728‐741. [DOI] [PubMed] [Google Scholar]
- 6. Kim KH, Lee MS. Autophagy–a key player in cellular and body metabolism. Nat Rev Endocrinol. 2014;10(6):322‐337. [DOI] [PubMed] [Google Scholar]
- 7. He Z, Cai K, Zeng Z, Lei S, Cao W, Li X. Autophagy‐associated circRNA circATG7 facilitates autophagy and promotes pancreatic cancer progression. Cell Death Dis. 2022;13(3):233. [DOI] [PMC free article] [PubMed] [Google Scholar]
- 8. Wang Y, Xiong H, Liu D, et al. Autophagy inhibition specifically promotes epithelial‐mesenchymal transition and invasion in RAS‐mutated cancer cells. Autophagy. 2019;15(5):886‐899. [DOI] [PMC free article] [PubMed] [Google Scholar]
- 9. Qin C, Yang G, Yang J, et al. Metabolism of pancreatic cancer: paving the way to better anticancer strategies. Mol Cancer. 2020;19(1):50. [DOI] [PMC free article] [PubMed] [Google Scholar]
- 10. Usman RM, Razzaq F, Akbar A, et al. Role and mechanism of autophagy‐regulating factors in tumorigenesis and drug resistance. Asia Pac J Clin Oncol. 2021;17(3):193‐208. [DOI] [PubMed] [Google Scholar]
- 11. Yang S, Wang X, Contino G, et al. Pancreatic cancers require autophagy for tumor growth. Genes Dev. 2011;25(7):717‐729. [DOI] [PMC free article] [PubMed] [Google Scholar]
- 12. Jin Y, Penning TM. Aldo‐keto reductases and bioactivation/detoxication. Annu Rev Pharmacol Toxicol. 2007;47:263‐292. [DOI] [PubMed] [Google Scholar]
- 13. Penning TM, Drury JE. Human aldo‐keto reductases: function, gene regulation, and single nucleotide polymorphisms. Arch Biochem Biophys. 2007;464(2):241‐250. [DOI] [PMC free article] [PubMed] [Google Scholar]
- 14. Chow R et al. AKR7A3 suppresses tumorigenicity and chemoresistance in hepatocellular carcinoma through attenuation of ERK, c‐Jun and NF‐kappaB signaling pathways. Oncotarget. 2017;8(48):83469‐83479. [DOI] [PMC free article] [PubMed] [Google Scholar]
- 15. Hlavac V et al. The role of cytochromes p450 and aldo‐keto reductases in prognosis of breast carcinoma patients. Medicine (Baltimore). 2014;93(28):e255. [DOI] [PMC free article] [PubMed] [Google Scholar]
- 16. Li J et al. Ese‐3 contributes to colon cancer progression by downregulating EHD2 and transactivating INPP4B. Am J Cancer Res. 2021;11(1):92‐107. [PMC free article] [PubMed] [Google Scholar]
- 17. Pastushenko I, Blanpain C. EMT transition states during tumor progression and metastasis. Trends Cell Biol. 2019;29(3):212‐226. [DOI] [PubMed] [Google Scholar]
- 18. White E. The role for autophagy in cancer. J Clin Invest. 2015;125(1):42‐46. [DOI] [PMC free article] [PubMed] [Google Scholar]
- 19. Kimmelman AC, White E. Autophagy and tumor metabolism. Cell Metab. 2017;25(5):1037‐1043. [DOI] [PMC free article] [PubMed] [Google Scholar]
- 20. Lin F, Zhu YT, Qin ZH. Biomarkers of autophagy. Adv Exp Med Biol. 2021;1208:265‐287. [DOI] [PubMed] [Google Scholar]
- 21. Chu Q et al. Cherry anthocyanins regulate NAFLD by promoting autophagy pathway. Oxid Med Cell Longev. 2019;2019:4825949. [DOI] [PMC free article] [PubMed] [Google Scholar]
- 22. Zhang M, Liu S, Chua MS, et al. SOCS5 inhibition induces autophagy to impair metastasis in hepatocellular carcinoma cells via the PI3K/Akt/mTOR pathway. Cell Death Dis. 2019;10(8):612. [DOI] [PMC free article] [PubMed] [Google Scholar]
- 23. Song Z, Feng C, Lu Y, Lin Y, Dong C. PHGDH is an independent prognosis marker and contributes cell proliferation, migration and invasion in human pancreatic cancer. Gene. 2018;642:43‐50. [DOI] [PubMed] [Google Scholar]
- 24. Ma X, Li B, Liu J, Fu Y, Luo Y. Phosphoglycerate dehydrogenase promotes pancreatic cancer development by interacting with eIF4A1 and eIF4E. J Exp Clin Cancer Res. 2019;38(1):66. [DOI] [PMC free article] [PubMed] [Google Scholar]
- 25. Sharif T, Martell E, Dai C, et al. Phosphoglycerate dehydrogenase inhibition induces p‐mTOR‐independent autophagy and promotes multilineage differentiation in embryonal carcinoma stem‐like cells. Cell Death Dis. 2018;9(10):990. [DOI] [PMC free article] [PubMed] [Google Scholar]
- 26. Jing Z, Heng W, Xia L, et al. Downregulation of phosphoglycerate dehydrogenase inhibits proliferation and enhances cisplatin sensitivity in cervical adenocarcinoma cells by regulating Bcl‐2 and caspase‐3. Cancer Biol Ther. 2015;16(4):541‐548. [DOI] [PMC free article] [PubMed] [Google Scholar]
- 27. Zhang Y, Yang L, Dai G, Cao H. Knockdown of PHGDH potentiates 5‐FU cytotoxicity in gastric cancer cells via the Bcl‐2/Bax/caspase‐3 signaling pathway. Int J Clin Exp Pathol. 2018;11(12):5869‐5876. [PMC free article] [PubMed] [Google Scholar]
- 28. Song Y, Wang Q, Wang D, et al. Label‐free quantitative proteomics unravels carboxypeptidases as the novel biomarker in pancreatic ductal adenocarcinoma. Transl Oncol. 2018;11(3):691‐699. [DOI] [PMC free article] [PubMed] [Google Scholar]
- 29. Dai T, Ye L, Yu H, et al. Regulation network and prognostic significance of Aldo‐keto reductase (AKR) superfamily genes in hepatocellular carcinoma. J Hepatocell Carcinoma. 2021;8:997‐1021. [DOI] [PMC free article] [PubMed] [Google Scholar]
- 30. Huang H, Liu K, Ou H, Qian X, Wan J. Phgdh serves a protective role in Il‐1β induced chondrocyte inflammation and oxidativestress damage. Mol Med Rep. 2021;23:1‐10. [DOI] [PMC free article] [PubMed] [Google Scholar]
- 31. Xian Y, Zhang S, Wang X, Qin J, Wang W, Wu H. Phosphoglycerate dehydrogenase is a novel predictor for poor prognosis in gastric cancer. Onco Targets Ther. 2016;9:5553‐5560. [DOI] [PMC free article] [PubMed] [Google Scholar]
- 32. Jia XQ, Zhang S, Zhu HJ, et al. Increased expression of PHGDH and prognostic significance in colorectal cancer. Transl Oncol. 2016;9(3):191‐196. [DOI] [PMC free article] [PubMed] [Google Scholar]
- 33. Wei L et al. Genome‐wide CRISPR/Cas9 library screening identified PHGDH as a critical driver for sorafenib resistance in HCC. Nat Commun. 2019;10(1):4681. [DOI] [PMC free article] [PubMed] [Google Scholar]
- 34. Pietrocola F, Pol J, Vacchelli E, et al. Caloric restriction mimetics enhance anticancer immunosurveillance. Cancer Cell. 2016;30(1):147‐160. [DOI] [PMC free article] [PubMed] [Google Scholar]
- 35. Zeng S et al. Chemoresistance in pancreatic cancer. Int J Mol Sci. 2019;20:4504. [DOI] [PMC free article] [PubMed] [Google Scholar]
- 36. Rathore R, Schutt CR, Van Tine BA. PHGDH as a mechanism for resistance in metabolically‐driven cancers. Cancer Drug Resist. 2020;3:762‐774. [DOI] [PMC free article] [PubMed] [Google Scholar]
Associated Data
This section collects any data citations, data availability statements, or supplementary materials included in this article.
Supplementary Materials
Figure S1.
Figure S2.
Figure S3.
Table S1.
Table S2.
Data Availability Statement
The datasets used in this study are available from the corresponding author on reasonable request.