Abstract
Procollagen‐lysine, 2‐oxoglutarate 5‐dioxygenase 2 (PLOD2) has been reported as an oncogenic gene, affecting various malignant tumors, including endometrial carcinoma, osteosarcoma, and gastric cancer. These effects are mostly due to the enhanced deposition of collagen precursors. However, more studies need to be conducted on how its lysyl hydroxylase function affects cancers like colorectal carcinoma (CRC). Our present results showed that PLOD2 expression was elevated in CRC, and its higher expression was associated with poorer survival. Overexpression of PLOD2 also facilitated CRC proliferation, invasion, and metastasis in vitro and in vivo. In addition, PLOD2 interacted with USP15 by stabilizing it in the cytoplasm and then activated the phosphorylation of AKT/mTOR, thereby promoting CRC progression. Meanwhile, minoxidil was demonstrated to downregulate the expression of PLOD2 and suppress USP15, and the phosphorylation of AKT/mTOR. Our study reveals that PLOD2 plays an oncogenic role in colorectal carcinoma, upregulating USP15 and subsequently activating the AKT/mTOR pathway.
Keywords: AKT/mTOR pathway, colorectal carcinoma, minoxidil, PLOD2, USP15
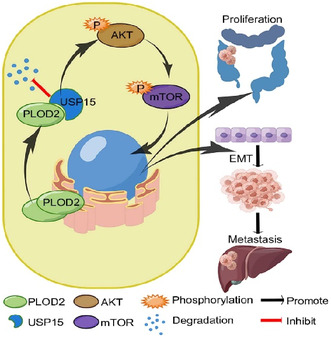
PLOD2 enhances proliferation and metastasis in CRC. PLOD2 interacts with USP15 by inhibiting protein degradation of ubiquitination in the cytoplasm. USP15 subsequently activates the phosphorylation of the AKT/mTOR signaling pathway to promote tumor growth and migration.
Abbreviations
- ATCC
American Type Culture Collection
- CAF
Cancer‐associated fibroblasts
- COAD
Colon adenocarcinoma
- CO‐IP
Co‐immunoprecipitation
- CRC
Colorectal carcinoma
- DUB
deubiquitylating enzyme
- ECM
Extracellular matrix
- ESCC
esophageal squamous cell carcinoma
- FKBP5
FKBP prolyl isomerase 5
- IF
Immunofluorescence
- IHC
Immunohistochemistry
- LH2
Lysyl hydroxylases 2
- NP
Nucleus pulposus
- NSCLC
Non‐small‐cell lung cancer
- PLOD2
Procollagen‐lysine, 2‐oxoglutarate 5‐dioxygenase 2
- qPCR
Quantitative real‐time PCR
- READ
Rectum adenocarcinoma
- RER
Rough endoplasmic reticulum
- USP15
Ubiquitin specific peptidase 15
- WB
Western blotting
1. INTRODUCTION
Colorectal carcinoma (CRC) is one of the most common malignant tumors in the world; it is the third most diagnosed cancer in males (10.6%) and females (9.4%). 1 , 2 CRC is also the third leading cause of cancer death in both males (9.3%) and females (9.5%). 1 Lifestyle factors, such as obesity, smoking, and alcohol, are significant and can be addressed through therapeutic interventions. 3 Pre‐cancer screenings like colonoscopies have also been improved. 3 , 4 However, the incidence and death rates of CRC remain high. Therefore, it is essential to clarify the molecular mechanisms behind the development of CRC to investigate novel molecular targets for early diagnosis and treatment. Collagen deposition and crosslinking happen frequently in malignant tumors and increase the risk of tumorigenesis and invasion, allowing individual tumor cells to migrate out along radially aligned fibers. 5 , 6 , 7
Procollagen‐lysine, 2‐oxoglutarate 5‐dioxygenase 2 (PLOD2) is located on human chromosome 3 (3q24). The PLOD family has the effect of hydroxylating lysyl in the rough endoplasmic reticulum (RER), which results in the cross‐linking and deposition of collagen precursors. 8 In hypoxia, PLOD2 has been revealed to modify cell shape, adhesion, and motility to harden the extracellular matrix (ECM) and alter collagen fiber organization, which promotes invasion and metastasis of breast cancer cells. 9 Additionally, PLOD2 is strongly expressed in cancer‐associated fibroblasts (CAF), increases stromal stiffness, and encourages lung adenocarcinoma cells to invade through intratumoral collagen cross‐links. 10 Except for its high expression in breast cancer and lung adenocarcinoma, recent studies have shown that PLOD2 is upregulated in cervical cancer, 11 endometrial carcinoma, 12 and colorectal carcinoma. 13 Further studies are needed to clarify how PLOD2 regulates the CRC progression.
Ubiquitin‐specific peptidase 15 (USP15), located on chromosome 12q14.1, is a deubiquitylating enzyme (DUB). DUBs might function to regulate both the stability and the activity of target proteins, which include oncogenes and tumor suppressors. 14 USP15 accelerated NP degradation by deubiquitinating and stabilizing FKBP5, which, in turn, prevented AKT phosphorylation in degenerative NP cells. 15 Additionally, USP15 was upregulated in GC tissue and cell lines and increased nuclear translocation of β‐catenin, suggesting activation of the Wnt/β‐catenin signaling pathway. 16 However, there have not been any reports on the expression and function of USP15 in CRC.
In this study, we find that PLOD2 is upregulated in CRC and indicates a poor prognosis. In particular, PLOD2 suppresses protein degradation of USP15, which subsequently activates the phosphorylation of AKT/mTOR and then promotes the proliferation and metastasis of CRC.
2. MATERIALS AND METHODS
2.1. Cell culture
Normal human colon epithelial cells (FHC) and seven human CRC cell lines (LOVO, DLD1, SW480, SW620, Hct116, CaCO2, and RKO) were obtained from the American Type Culture Collection and conserved in our laboratory. All cells were cultured in RPMI Medium 1640 (Gibco, CA, USA) with 10% FBS (Gibco, CA, USA) in a humidified atmosphere containing 5% CO2 at 37°C. All cells taken for the experiments were in good growth condition.
2.2. Clinical samples collection
Fresh samples (32 pairs) and paraffin‐embedded samples (156 pairs) of colorectal tumor tissue and adjacent normal colon tissue were obtained from patients who underwent a surgical operation at Nanfang Hospital, Southern Medical University (Guangzhou, China) and were diagnosed with primary CRC between January 2017 and December 2020. All patients did not receive any preoperative chemotherapy or radiotherapy. The tissues were approved to use by the Ethics Committee of Nanfang Hospital, Southern Medical University. All the patients signed informed consent before we used these clinical materials for research.
2.3. Western blotting
Cells and tissues were collected and lysed in RIPA buffer with protease and phosphatase inhibitors (Fudebio, Hangzhou, China). Target proteins were separated by SDS‐polyacrylamide gel electrophoresis (SDS‐PAGE) and transferred to polyvinylidene difluoride (PVDF) membranes (Pall Corp). After being blocked with 5% non‐fat milk or BAS blocking buffer (Fudebio), the membranes were incubated overnight at 4°C with antibodies, which are listed in Table S1. Following incubation with the appropriate secondary antibodies (Proteintech, Anti‐Rabbit Cat#SA00001‐2, 1:10,000; Anti‐Mouse Cat#SA00001‐1, 1:10,000), signals were detected with enhanced chemiluminescence (Fudebio) using a chemiluminescence system (Tanon 5200).
2.4. RNA extraction and quantitative real‐time PCR
Total RNA was extracted with a Trizol Reagent Kit (Invitrogen, CA, USA) according to the instructions. Evo M‐MLV RT Premix for quantitative real‐time PCR (qPCR) (Accurate Bio‐Medical) was used to synthesize cDNA. qPCR was carried out with an SYBR Green Premix Pro Taq HS qPCR Kit (Accurate Bio‐Medical) on the ABI 7500 Real‐time PCR system (Applied Biosystems, Foster City, USA). GAPDH was used as an endogenous control. Relative quantification analysis was computed using the comparative 2−ΔΔCT method. The primer sequences used are displayed in Table S2.
2.5. Cell transfection
The lentiviral vector LV‐PLOD2 (Gene Chem, 2 × 10⁸ TU/mL) containing PLOD2 overexpression gene with puromycin resistance gene and luciferase gene was transfected into CRC cells. In the meantime, the blank vector (CON285, 2 × 10⁸ TU/mL) was also transfected as a negative control (NC). Short interfering RNA (siRNA) to inhibit PLOD2 and USP15 (RiboBio) was loaded into CRC cells diluted with lipofectamine 3000 (Invitrogen) at a final concentration of 50 nM. Overexpression of USP15 in CRC cells was achieved using pGV411‐hUSP15‐Flag (Miaolingbio). Western blotting (WB) and qPCR were used to evaluate the efficiency of transfection. The human siRNA sequences to inhibit PLOD2 and USP15 are listed in Table S3.
2.6. Immunohistochemistry
One hundred and fifty‐six paired paraffin‐embedded CRC tissues and matched nontumorous tissues were used in immunohistochemistry (IHC) to estimate the protein expression of PLOD2 (N = 156) and USP15 (N = 58). First, the parafin slided were put into EDTA buffer (pH = 8.2) for antigen repair and then incubated with primary antibody (anti‐PLOD2, 1:100; anti‐USP15, 1:200) overnight at 4°C. After being stained with DAB (Fudebio, Hangzhou, China), the slides were counterstained with hematoxylin, dehydrated, and sealed.
The IHC scores were evaluated by two independent pathologists blinded to the clinical parameters. The IHC scores consisted of the staining intensity (0–3) and the percentage of corresponding intensity area (0%–100%) in the whole tumor area or normal specimen section. The scores 0–3 of staining intensity are as follows: 0 (negative), 1 (weak staining), 2 (medium staining), and 3 (strong staining). The intensity and proportion scores were multiplied to attain the final staining score for PLOD2 and USP15 (100–300). The median value of 200 was used as the cutoff point.
2.7. Cell proliferation and colony formation assay
Cells were seeded into 96‐well plates at a density of 2 × 10³/100 μL per well in a cell proliferation assay. Cell Counting Kit‐8 (CCK8, Dojindo Molecular Technologies, Cat#CK04) was used to evaluate the rate of cell proliferation with a Microplate Autoreader (Bio‐Rad, Hercules, CA, USA) at 450 nm.
Cells were plated into six‐well plates (500 cells per well) and cultured for 2 weeks in a colony formation assay. The colonies were fixed with methanol for 10 min and stained with crystal violet stain for 15 min (Biosharp, Cat# BL802A). The number of colonies (≥50 cells) was counted under a microscope. All experiments were independently repeated in triplicate.
2.8. Transwell assay and cell wound healing assay
In the transwell assay, 5 × 10⁴ cells suspended in 200 μL serum‐free RPMI 1640 media were gently injected in the upper compartment of 8‐μm‐pore transwells (Corning, NY, USA), and 500 μL RPMI 1640 media with 10% FBS as a chemo‐attractant filled the bottom compartment. After being cultured for 12–48 h, cells were fixed with methanol and stained with crystal violet stain (Biosharp, Cat# BL802A). Cells were counted and photographed under an inverted microscope in five random fields (magnification, 200×).
Cells were seeded into six‐well plates at a density of 1.2 × 10⁶ per well in a wound healing assay. A pipette tip was used to scratch the cells and sequentially culture them after washing them with PBS. The area of migration was observed and photographed at 0 h, 24 h, and 48 h using the 100× objective, respectively. The width of the wound edges was quantified by Image J. All experiments were independently repeated in triplicate.
2.9. Immunofluorescence
The cells were plated on the glass bottom culture dishes (NEST) at a density of 10,000/cm3. The cells were fixed with paraformaldehyde, thoroughly penetrated with 0.5% Triton X‐100, and blocked with 10% normal goat‐blocking serum. Next, the cells were incubated with PLOD2 antibody (1:50) and USP15 antibody (1:100) at 4°C overnight. Afterward, the cells were incubated with Alexa Fluor‐488 labeled anti‐mouse antibody (Abbkine, Cat#A23210, 1:100) and Alexa Fluor‐594 labeled anti‐rabbit antibody (Abbkine, Cat#A23420, 1:100) at room temperature. The nucleus was stained with DAPI (Solarbio, Beijing, China). Finally, the cells were photographed under an Olympus Fluo View FV1000 confocal laser scanning microscope. The results were analyzed with Image Pro Plus.
2.10. Co‐immunoprecipitation
The antibody (1–2 g) and control IgG were added to the cell lysate separately. Then the complex was slowly shaken on a rotating shaker at 4°C overnight. Afterward, 30 μL protein A/G‐agarose beads (Santa Cruz, Cat#sc‐2003) were added to the antibody–antigen complex and slowly shaken at 4°C overnight. The agarose beads‐antibody–antigen complex was collected and washed with cold PBS three times. After eluting 2× SDS loading buffer by boiling for 5 min, the samples underwent SDS‐PAGE and WB.
2.11. Orthotopic mouse models of colorectal cancer liver metastasis
An orthotopic mouse model of colorectal cancer liver metastasis 17 was used to examine the impact of PLOD2 on the metastasis of CRC cells in vivo. Hct116 cells stably overexpressing PLOD2 and negative control cells, with a lentivirus vector labeled luciferase, were injected subcutaneously into the left and right hind legs of Balb/C‐nu/nu nude mice (3–4 weeks old, Animal Center, Southern Medical University, Guangzhou, China). After 2 weeks, the original tumor was surgically removed and segregated into 2 mm3 fragments. Then, the tumor fragment of the experimental or control group was fixed into the subserous layer of the cecum of nude mice. A fluorescent live imaging system was applied to observe liver metastasis at 14 and 60 days after an intraperitoneal injection of luciferin substrate.
For minoxidil injections, medication therapies were started in the third week after this orthotopic mouse model was developed. The experimental group received an intraperitoneal injection of minoxidil (3 mg/kg/qd), whereas the control group received an equal volume of PBS. Finally, the mice were killed on the 60th day after surgery, and their intestines and liver were separated, fixed, embedded in paraffin, and sectioned. After being stained with hematoxylin and eosin (HE), the slides were observed under a microscope.
2.12. Statistical analysis
Each experiment was performed in three independent experiments. Statistical analyses were performed using the SPSS 19.0 software package (SPSS) and GraphPad Prism 8.0 (GraphPad Software, San Diego, CA, USA). All data followed a normal distribution and demonstrated homogeneity of variance. Statistical analyses were performed with the independent Student's t‐test or a one‐way ANOVA for more than two groups. The correlation between the expression of PLOD2 and clinical‐pathological factors was compared using Pearson's χ 2 test or Fisher's exact test. p < 0.05 (two‐tailed) was considered to have statistical significance. The error bars represent mean ± SD. *p < 0.05, **p < 0.01, ***p < 0.001.
3. RESULTS
3.1. High expression of PLOD2 in colorectal carcinoma
The expression of PLOD2 was elevated in CRC cells at both protein and mRNA levels, including LOVO, DLD1, SW480, SW620, Hct116, CaCO2, and RKO, compared to normal colorectal epithelial cells (FHC) (p < 0.05; Figure 1A,B). In primary CRC tissue samples, PLOD2 expression was significantly increased compared with their normal counterparts in the protein expression (N = 18, p < 0.001; Figure 1C). Of the 32 patients’ CRC tissues, 22 had higher mRNA expression of PLOD2, compared with the normal tissues (N = 32, p < 0.05; Figure 1D), but the difference between them was not discernable. To validate PLOD2's higher expression in CRC, IHC was used in 156 pairs of paraffin‐embedded CRC tissues and matched normal neighboring tissues. In CRC tissues, there was a substantially higher expression score for PLOD2, which was mostly expressed in the cytoplasm (p < 0.001; Figure 1E,F). Additionally, the clinical information from these patients was analyzed based on the IHC score to investigate the relationship between PLOD2 expression and the clinicopathological characteristics of CRC using Pearson's χ 2 test for contingency tables (N = 156, Table S4). The results revealed that most CRC patients with lymph node metastases had a higher PLOD2 expression (Pearson χ 2 value = 7.666; p = 0.006; Figure 1G). Higher levels of PLOD2 expression were correlated with advanced T stage (p < 0.01; Figure 1H). Finally, we used the PROGgeneV2 online analytic system (http://genomics.jefferson.edu/proggene/) to analyze the relationship between PLOD2 gene expression and clinical prognosis. According to online analysis, increased PLOD2 expression was associated with worse overall survival and relapse‐free survival in CRC (GSE17536, p < 0.05; Figure 1I; accessed 30 November 2020).
FIGURE 1.
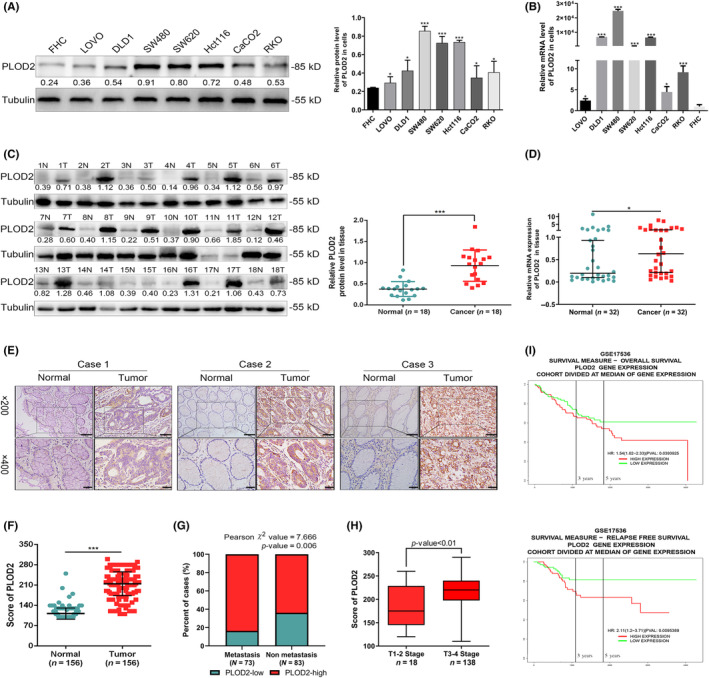
Higher expression level of procollagen‐lysine, 2‐oxoglutarate 5‐dioxygenase 2 (PLOD2) in colorectal carcinoma (CRC) is associated with poorer clinical survival factors. (A) Protein expression of PLOD2 in normal colorectal epithelial cells and CRC cells. (B) The PLOD2 mRNA expression in normal colorectal epithelial cells and CRC cells. (C) Protein expressions of PLOD2 in 18 paired normal colorectal epithelial tissues (N) and CRC tissues (T). (D) PLOD2 mRNA expressions in 32 paired normal colorectal epithelial tissues and CRC tissues. (E) Representative immunohistochemistry (IHC) staining of PLOD2 in paraffin‐embedded CRC tissues and their adjacent normal tissues with three different degrees of differentiation. [Case 1]: Good, [Case 2]: Moderate, [Case 3]: Poor. Scale bar 50 μm; and 20 μm in the enlarged image. (F) IHC staining score of normal and malignant colorectal epithelial tissues. (G) Percentage of non‐metastatic and metastatic CRC tissues in the group with low and high PLOD2 levels. (H) staining score of CRC cases classified into T1–2 stage and T3–4 stage. (I) Kaplan–Meier curve depicting the overall survival (top) and relapse‐free survival (bottom) of PLOD2 for CRC patients. The error bars represent mean ± SD. *p < 0.05, **p < 0.01, ***p < 0.001.
3.2. PLOD2 facilitated the proliferative and migrative abilities of colorectal carcinoma in vitro
To clarify the role of PLOD2 played in the advancement of CRC, CaCO2 and LOVO cells were used for transfection with PLOD2‐overexpressed lentiviral vectors (CaCO2/PLOD2+ and LOVO/PLOD2+), while empty lentiviral vectors served as the negative controls (CaCO2/Vector and LOVO/Vector). The effectiveness of the transfection was validated by WB (Figure 2A) and qPCR (p < 0.001; Figure S1A). Three siRNAs were used to suppress the expression of PLOD2 in SW480 and SW620 cells. The transfection effectiveness was determined by WB (Figure 2B) and qPCR, respectively (p < 0.01; Figure S1B). The CCK8 and colony formation experiments showed that the CRC cells multiplied more rapidly when PLOD2 was overexpressed, while the growth of CRC cells was inhibited when PLOD2 was silenced (Figure 2C,D). Additionally, CRC cells’ ability to migrate was enhanced by overexpressing PLOD2, whereas it was suppressed by silencing PLOD2, as seen by the results of the transwell invasion experiments and wound healing assays (Figure 2E,F). All of these findings supported that PLOD2 increased CRC cells’ proliferative and migratory processes.
FIGURE 2.
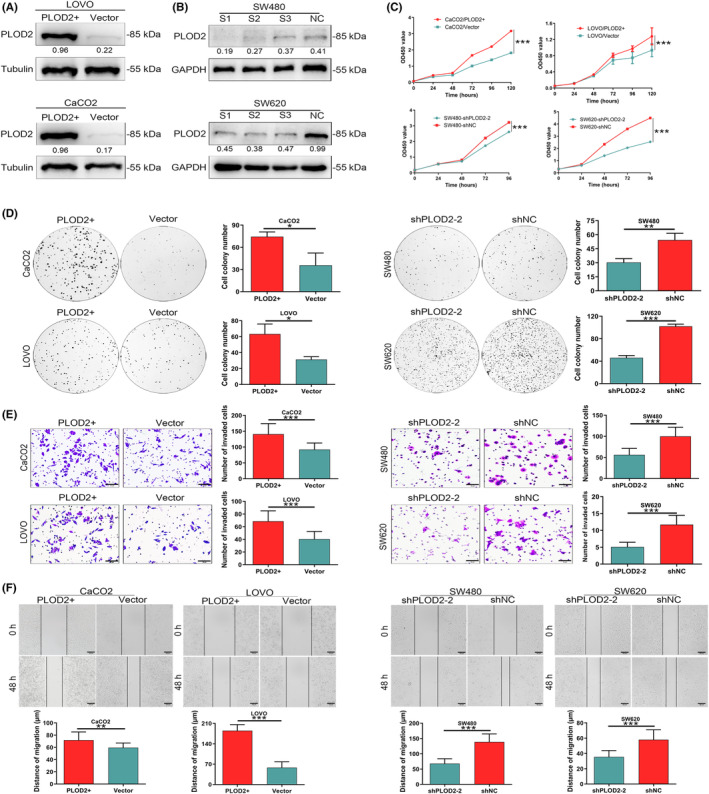
Procollagen‐lysine, 2‐oxoglutarate 5‐dioxygenase 2 (PLOD2) enhances the proliferative and invasive abilities in colorectal carcinoma (CRC) cells in vitro. (A) Overexpression of PLOD2 was verified at the level of protein. (B) Downregulation of PLOD2 was confirmed at the protein level. (C, D) Upregulation of PLOD2 promoted the proliferation ability of CRC cells detected by CCK8 assays (C) and colony formation (D), while the silence of PLOD2 suppressed it (N = 3). (E, F) Upregulation of PLOD2 promoted the invasion ability of CRC cells detected by transwell assays (E, scale bar 50 μm) and scratch healing assays (F, scale bar 100 μm), while the silence of PLOD2 inhibited it (N = 3). The error bars represent mean ± SD. *p < 0.05, **p < 0.01, ***p < 0.001.
3.3. PLOD2 interacted with USP15 in colorectal carcinoma cells
To investigate the mechanism by which PLOD2 promotes the advancement of CRC, we searched PLOD2 interaction molecules via the online public databases of GeneMANIA (http://genemania.org/) and Oncomine (https://www.oncomine.org/) (Figure 3A; accessed 11 January 2021). We selected USP15 from the protein–protein interaction network online and then used ENCORI (https://starbase.sysu.edu.cn/) to test the relationship between USP15 and PLOD2. This revealed that the expression level of PLOD2 was positively correlated with those of USP15 in colon adenocarcinoma (COAD) and rectum adenocarcinoma (READ) (p < 0.05; Figure 3B; accessed 19 November 2021). Co‐immunoprecipitation (Co‐IP) was performed to examine the interaction between PLOD2 and USP15, and the results indicated that PLOD2 probably precipitated with USP15 (Figure 3C). Results from immunofluorescence (IF) and three‐dimensional reconstruction confirmed a colocalization between PLOD2 and USP15 (Figure 3D). IHC staining of PLOD2 and USP15 was performed on continuous slices of the CRC paraffin specimen (Figure 3E). According to the statistical analysis of the IHC score, USP15 was higher expressed in CRC tissues than in the nearby normal tissues (p < 0.001; Figure 3F). Additionally, there was a positive correlation between USP15 and PLOD2 expression levels (p < 0.001; R = 0.5425; Figure 3G). These findings suggested that PLOD2 may control USP15's expression in CRC cells and that regulation is most likely done through their binding directly.
FIGURE 3.
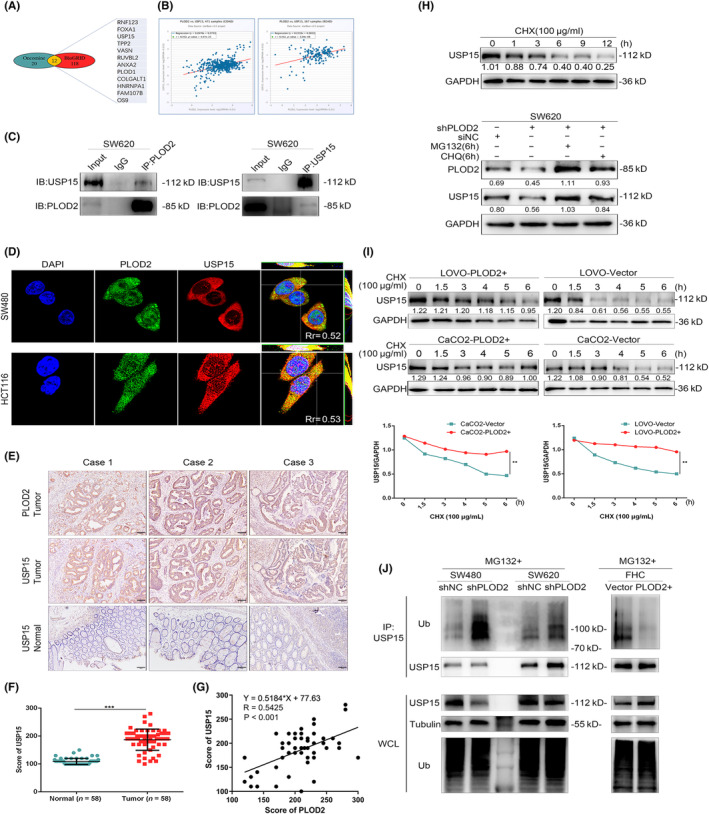
Procollagen‐lysine, 2‐oxoglutarate 5‐dioxygenase 2 (PLOD2) interacts with ubiquitin‐specific peptidase 15 (USP15) and improves the expression of USP15 in colorectal carcinoma (CRC). (A) PLOD2 interaction molecules were explored via Oncomine and BioGRID databases. (B) The correlation between PLOD2 and USP15 in colonic (left) and rectal carcinoma (right) was analyzed by ENCORI. (C) The physical interaction of PLOD2 and USP15 was detected by co‐immunoprecipitation (Co‐IP) assay. (D) Immunofluorescence assay results of PLOD2 and USP15 expression. (E) Immunohistochemistry (IHC) representational staining of PLOD2 and ubiquitin‐specific peptidase 15 (USP15) expression in continuous sections of CRC tissues (scale bar 100 μm). (F) IHC staining score of USP15 expression in normal and tumorous colorectal epithelial tissues (N = 58). (G) Positive correlation of PLOD2 and USP15 was analyzed based on the IHC staining score (R = 0.5425). (H) The half‐life of the USP15 protein degradation occurred after 6 h. Restoration of USP15 by treatment with MG132 (1 μM) and CHQ (20 μM) for 6 h in PLOD2 silence cells. (I) PLOD2 overexpression could stabilize the protein expression of USP15. (J) PLOD2 increased the expression of USP15, which is dependent on the inhibition of the proteosome. WCL, whole cell lysate. The error bars represent mean ± SD. *p < 0.05, **p < 0.01, ***p < 0.001.
3.4. PLOD2 promoted colorectal carcinoma deterioration through stabilizing USP15 protein
The prior work indicated that PLOD2 was essential for confirming integrin β1 intracellular stability by hydroxylating lysine inside the X‐K‐G motif. 18 We had a hypothesis that PLOD2 upregulated USP15 by stabilizing its protein expression. Cycloheximide (CHX, 100 μg/mL), a protein synthesis inhibitor, was added extrinsically to stop the production of USP15; after that, the protein expression of USP15 in CRC cells was determined at 0, 1, 3, 6, 9, and 12 h. The results showed that after 6 h, the USP15 protein degradation reached the half‐life (Figure 3H). There are two main pathways identified for protein degradation: the proteasome system and the lysosome pathway. According to the WB results, the proteasome inhibitor MG132 (1 μM) and the lysosome inhibitor CQ (20 μM) both prevented the degradation of USP15 in siPLOD2 CRC cells (Figure 3H). Additionally, overexpression of PLOD2 apparently relieved USP15 degradation in CRC cells (p < 0.01; Figure 3I). To verify if PLOD2 increased the expression of USP15, and this is dependent on the proteosome's inhibition, we conducted a ubiquitination experiment using PLOD2 and USP15. The results demonstrated that in CRC cells, USP15 ubiquitination levels rose when PLOD2 expression was downregulated and decreased when PLOD2 was overexpressed (Figure 3J). All the outcomes above suggested that PLOD2 increased USP15 expression by preventing the ubiquitination of USP15 protein for degradation in CRC cells.
We employed short interfering RNA (siRNA) to knock down USP15, and WB was used to confirm the success of the knockdown (Figure 4A). The promoting proliferation and invasion of CRC cells after PLOD2 overexpressing were reduced by knockdown USP15 (Figure 4B–D). Similarly, the inhibited proliferation and invasion of CRC cells after PLOD2 knockdown were relieved, at least partially, by upregulating USP15 (Figure 4E–H). According to these findings, the effects of PLOD2 on invasion and proliferation were dependent upon USP15.
FIGURE 4.
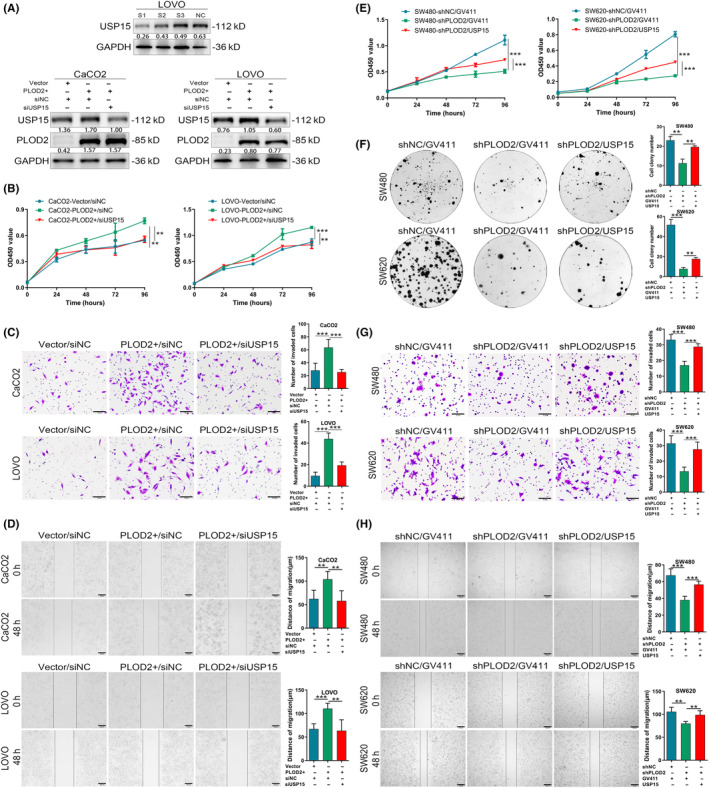
Procollagen‐lysine, 2‐oxoglutarate 5‐dioxygenase 2 (PLOD2) promotes colorectal carcinoma (CRC) cells to proliferate and migrate, depending upon ubiquitin‐specific peptidase 15 (USP15). (A) The efficiency of knockdown USP15 was verified at the level of protein. (B–D) Transient USP15 knockdown inhibited the proliferation and invasion of CRC cells after stable PLOD2, detected by CCK8 (B), transwell invasion (C, scale bar 50 μm), and scratch healing assays (D, scale bar 100 μm) (N = 3). (E, F) Overexpression of USP15 restored the proliferation ability of PLOD2 silencing CRC cells detected by CCK8 assays (E) and colony formation (F) (N = 3). (G, H) Overexpression of USP15 restored the invasion ability of PLOD2 silencing CRC cells detected by transwell assays (G, scale bar 50 μm) and scratch healing assays (H, scale bar 100 μm) (N = 3). The error bars represent mean ± SD. *p < 0.05, **p < 0.01, ***p < 0.001.
3.5. PLOD2 influenced the colorectal carcinoma aggravation through USP15/AKT/MTOR pathway
Clinicopathological character analysis revealed that PLOD2's high expression related to the depth of tumor invasion and lymph node metastasis. Previous studies found that PLOD2 increased the expression of p‐AKT, which accelerated tumor invasion and lymph node metastasis in glioma, 19 non‐small‐cell lung cancer (NSCLC), 20 and esophageal squamous cell carcinoma (ESCC). 21 In the KEGG enrichment analysis on the signaling pathway of USP15 in the CRC‐related database, USP15 high expression was related to the PI3K/AKT/mTOR signaling pathway (p < 0.05; Figure 5A). The relationship of PLOD2, USP15, and AKT/mTOR in CRC should be clarified. The findings of WB showed that PLOD2 upregulation enhanced the expressions of p‐AKT and p‐mTOR but had no impact on the total AKT and mTOR in CRC cells (Figure 5B). Likewise, p‐AKT and p‐mTOR expressions were repressed in shPLOD2 cells, but the total AKT and mTOR expressions were not (Figure 5B). The expression of EMT‐related transcription factors was also evaluated by qPCR in PLOD2 upregulated or silenced cells. These results showed that PLOD2 promoted the EMT process (Figure 5C). To confirm the function USP15 played in the AKT/mTOR signaling pathway, we overexpressed USP15 in SW480/shPLOD2 and SW620/shPLOD2 cells. The outcome of WB demonstrated that PLOD2 truly upregulated p‐AKT and p‐MTOR expression by the USP15/AKT/mTOR axis (Figure 5D). Those results were further confirmed by treatment with MK2206 (1 μM), an inhibitor of Akt (Thr308 and Ser473) phosphorylation (i.e., that MK2206 could only inhibit the increase of p‐AKT and p‐mTOR) (Figure 5E). The results of CCK8 proliferation assays (Figure 5F) and colony formation assays (Figure 5G) demonstrated that the proliferative capacity of PLOD2+ cells was decreased after MK2206 (1 μM) treatment for 48 h. The migration capacity of PLOD2+ cells was restored by MK2206 treatment, revealed by the transwell assays (Figure 5H) and wound healing assays (Figure 5I). These findings indicated that PLOD2 probably promoted the proliferation and migration of CRC cells by activating the USP15/AKT/mTOR signaling pathway.
FIGURE 5.
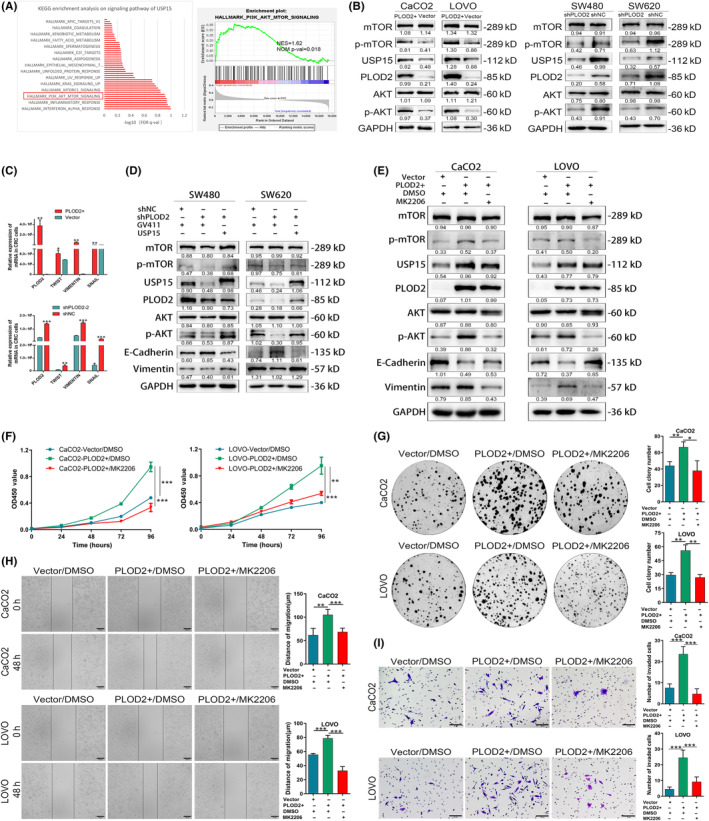
Procollagen‐lysine, 2‐oxoglutarate 5‐dioxygenase 2 (PLOD2) triggers the ubiquitin‐specific peptidase 15 (USP15) AKT/mTOR axis to boost colorectal carcinoma (CRC) cells’ multiplication and invasion. (A) KEGG enrichment analysis on signaling pathway of USP15 in CRC and enrichment of PI3K/AKT/mTOR signaling. (B) Expression of related markers of AKT/mTOR signaling pathway in PLOD2 overexpressed or silenced cells. (C) Expression of EMT‐related transcription factors in PLOD2 upregulated or silenced cells. (D) Overexpression of USP15 retrieved the activation of the AKT/mTOR/EMT pathway after stable PLOD2 knockdown. (E) MK2206 (1 μM) inhibited the activation of AKT/mTOR/EMT signaling in PLOD2 upregulated cells. (F–I) The promoting proliferation (F, G) and invasion (H, I) of CRC cells after PLOD2 overexpressing were reduced by MK2206 (1 μM) treatment (N = 3). The error bars represent mean ± SD. *p < 0.05, **p < 0.01, ***p < 0.001.
3.6. Minoxidil, a PLOD2 inhibitor, prevented colorectal carcinoma from deterioration
Minoxidil has been reported to reduce the gene expression of PLODs, which serves as an inhibitor of lysyl hydroxylase 22 and is an effective treatment option for hair loss. 23 In PLOD2 overexpression cells, minoxidil (0.5 mM or 1.0 mM, respectively) treatment for 48 h resulted in a concentration‐dependent inhibition of PLOD2 expression (Figure 6A). The extracellular addition of minoxidil (1.0 mM) for 48 h also inhibited the expression of USP15 and the activation of the AKT/mTOR signaling pathway (Figure 6B). The results of CCK8 assays revealed that the proliferation of PLOD2 overexpressed cells was prevented after 48 h of treatment with minoxidil (1.0 mM) (Figure 6C). The results of transwell assays (Figure 6D) and wound healing assays (Figure 6E) both showed that the migration capacity of PLOD2 upregulated cells was partially blocked. Further, an orthotopic mouse model of colorectal cancer liver metastasis was conducted to confirm the impact that PLOD2 and minoxidil would make on the progression of CRC in vivo. In the model, the Hct116 cells, which were stably overexpressing PLOD2 and negative control, were transfected with a lentivirus vector labeled luciferase to detect the increased luciferase expression. Twelve mice, divided into three groups of four mice each, were effectively constructed in those models, according to bioluminescence imaging in vivo. The PLOD2+/PBS group bioluminescence signal was stronger than that of the Vector/PBS group and the PLOD2+/minoxidil group, and two mice (50%) in the PLOD2+/PBS group had liver metastasis, compared to zero mice (0%) in the Vector/PBS group and oe mouse (25%) in the PLOD2+/minoxidil group (Figure 6F). HE and Ki‐67 staining were applied to the CRC tissues and liver tissue slides (Figure 6G). The intestinal tumors formed from the PLOD2+/PBS group were larger in volume (p < 0.01; Figure 6H) and had a high proliferation level as measured by Ki‐67 (p < 0.001; Figure 6H) compared with the PLOD2+/minoxidil group. These findings demonstrated that minoxidil acted as a PLOD2 inhibitor, which was probably applied to control the proliferation and metastasis of CRC.
FIGURE 6.
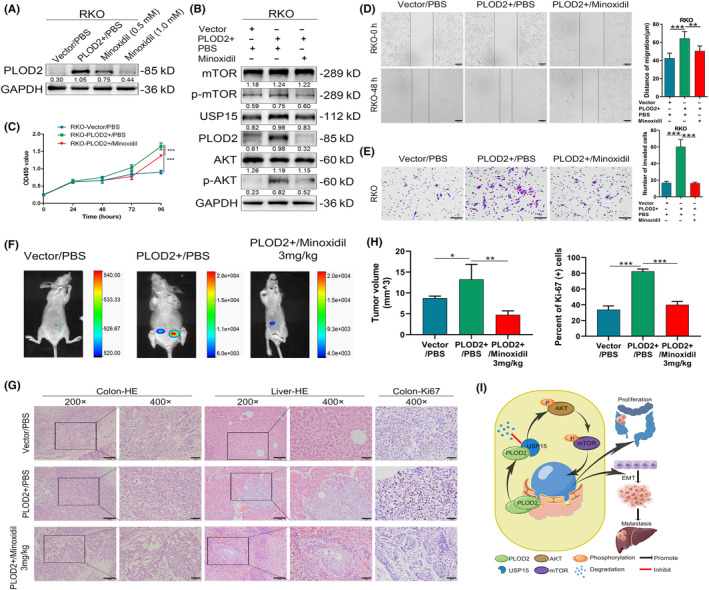
Minoxidil constricts procollagen‐lysine, 2‐oxoglutarate 5‐dioxygenase 2 (PLOD2) expression, thus inhibiting colorectal carcinoma (CRC) deterioration. (A) Expression of PLOD2 downregulated by minoxidil with concentration dependence. (B) Minoxidil restrained ubiquitin‐specific peptidase 15 (USP15) expression and activation of the AKT/mTOR signaling pathway. (C) Minoxidil prevented the proliferation of PLOD2 overexpression of CRC cells detected by CCK8 assays (N = 3). (D, E) Minoxidil blocked the invasion ability of PLOD2 upregulation CRC cells detected by scratch healing assays (D, scale bar 100 μm) and transwell assays (E, scale bar 50 μm) (N = 3). (F) Luciferase imaging of orthotopic mouse models of colorectal cancer liver metastasis injected with minoxidil or PBS on day 60. (G) Representative HE staining of CRC tissues (left) and liver tissues (middle) separated from orthotopic mouse models, and Ki‐67 staining of orthotopic tumor (right). Magnification scale bar 50 μm; scale bar in the enlarged image, 20 μm. (H) The analyses of volume and Ki‐67 staining score of orthotopic xenograft tumor (N = 12, three groups of four mice each). (I) Schematic of the function and mechanism of PLOD2 in CRC. The error bars represent mean ± SD. *p < 0.05, **p < 0.01, ***p < 0.001.
4. DISCUSSION
Procollagen‐lysine, 2‐oxoglutarate 5‐dioxygenase 2 has been reported as a potential target for CRC, 13 , 24 but its function in CRC is still largely unknown. In this study, we confirm that PLOD2 highly expresses in human CRC cells and tissues, and higher PLOD2 expression is associated with CRC progression. Additionally, upregulating PLOD2 significantly promotes the proliferation metastasis of CRC in vitro and in vivo. Specifically, we find that PLOD2 stabilizes the expression of USP15 depending on the proteosome's inhibition and thus activates the AKT/mTOR signaling pathway and affects the development of CRC.
According to published studies, PLOD2 inactivated PI3K/AKT signaling pathway and thus regulated the expression of EMT‐associated regulators in glioma, 19 and PLOD2 was regulated by PI3K/AKT‐FOXA1 axis in NSCLC. 20 Our study identifies USP15, a significant molecule that plays an important role in the process of PLOD2 activating the AKT/mTOR signaling pathway.
Although they belong to the same family, each member of the USP family exhibits a wide range of functional diversity in regulatory mechanisms in cells. 25 , 26 A previous study reports that a high concentration of USP15 protein was detected in glioblastoma, 27 and the USP15 gene was found amplified in CRC according to the TCGA database analysis. However, the role USP15 plays in CRC is not yet understood. In our study, the WB and IHC staining assay outcomes demonstrated that the USP15 expression was higher in most CRC tissues, and PLOD2 and USP15 expression levels were positively associated with COAD and READ. According to these findings, USP15 can act as an oncogene in CRC.
According to earlier research, lysine hydroxylation within the X‐K‐G motif was essential for the polymerization of collagen fibers during PLOD2 modification of collagen. 28 Integrin β1 is stabilized and localized to the membrane by PLOD2 through the hydroxylation of lysine within the AFNKGEKK sequence. 18 Additionally, we analyzed the amino acid sequence of USP15 protein via the NCBI database (https://www.ncbi.nlm.nih.gov/gene/9958); then we found that there are three X‐K‐G motifs and the CKGQLTGHKK sequence within USP15, which indicated that PLOD2 probably stabilized USP15 protein through lysine hydroxylation within the X‐K‐G motif. However, whether these sequences of USP15 are important for lysine hydroxylation by PLOD2, more experiments will need to be done for confirmation.
USP15 translation was upregulated in the early stages of cancer by TGF‐β via the PI3K/AKT pathway signaling; however, TGF‐β also caused the USP15 function to change from a tumor inhibitor to a promoter. 29 These researches indicate that it is still unclear how USP15 interacts with the Akt/mTOR signaling pathway. In our study, we found that PLOD2 activates the Akt/mTOR signaling pathway by upregulating and stabilizing the USP15 protein level; it subsequently increases CRC progression.
Minoxidil is primarily used in clinical settings to treat severe hypertension and androgenetic alopecia. 30 In this study, we established that minoxidil, an inhibitor of PLOD2, reduced CRC cell migration and liver metastases in vivo, which demonstrated that minoxidil can be applied to control the proliferation and metastasis of CRC.
AUTHOR CONTRIBUTIONS
JZ led the study design and prepared the manuscript. JWL contributed to the experiments. SJZ and LZ designed the research and analyzed the data. XLL performed the statistical analysis. JXC assisted in tissue sample collection. XHL prepared the figures. MZ performed data analysis and interpretation. All the authors read and approved the final manuscript.
FUNDING INFORMATION
This work was supported by the National Natural Science Foundation of China (grant nos. 81272763, 81672466, 81972334, and 82173297) and the Natural Science Foundation of Guangdong Province (grant nos. 2019A1515011205 and 2020A1515011327).
CONFLICT OF INTEREST STATEMENT
The authors declare no conflict of interest.
ETHICS STATEMENT
Approval of the research protocol by an institutional reviewer board: This study was carried out in strict accordance with the recommendations in the Guide for the Care and Use of Laboratory Animals of the National Institutes of Health.
Animal Studies: The protocol was approved by the Committee on the Ethics of Animal Experiments of Southern Medical University.
Informed Consent: The research was approved by the Ethics Committee of Nanfang Hospital, Southern Medical University (Guangzhou, China). The tissues used in our study were approved by the Ethics Committee of Nanfang Hospital, Southern Medical University. All the patients signed informed consent before we used these clinical materials for research.
Registry and the Registration No. of the study/trial: N/A.
CONSENT FOR PUBLICATION
All authors read and approved the final manuscript.
Supporting information
Appendix S1.
ACKNOWLEDGMENTS
We appreciate the effort of the physicians in enrolling patients and thank all the patients involved for allowing us to analyze their clinical data.
Lan J, Zhang S, Zheng L, et al. PLOD2 promotes colorectal cancer progression by stabilizing USP15 to activate the AKT/mTOR signaling pathway. Cancer Sci. 2023;114:3190‐3202. doi: 10.1111/cas.15851
DATA AVAILABILITY STATEMENT
Datasets generated and analyzed during the current study are not publicly available but are available from corresponding author on reasonable request.
REFERENCES
- 1. Sung H, Ferlay J, Siegel RL, et al. Global cancer statistics 2020: GLOBOCAN estimates of incidence and mortality worldwide for 36 cancers in 185 countries. CA Cancer J Clin. 2021;71:209‐249. [DOI] [PubMed] [Google Scholar]
- 2. Baidoun F, Elshiwy K, Elkeraie Y, et al. Colorectal cancer epidemiology: recent trends and impact on outcomes. Curr Drug Targets. 2021;22:998‐1009. [DOI] [PubMed] [Google Scholar]
- 3. Sawicki T, Ruszkowska M, Danielewicz A, Niedzwiedzka E, Arlukowicz T, Przybylowicz KE. A review of colorectal cancer in terms of epidemiology, risk factors, development, symptoms and diagnosis. Cancers (Basel). 2021;13:2025. [DOI] [PMC free article] [PubMed] [Google Scholar]
- 4. Siegel RL, Miller KD, Goding SA, et al. Colorectal cancer statistics, 2020. CA Cancer J Clin. 2020;70:145‐164. [DOI] [PubMed] [Google Scholar]
- 5. Provenzano PP, Eliceiri KW, Campbell JM, Inman DR, White JG, Keely PJ. Collagen reorganization at the tumor‐stromal interface facilitates local invasion. BMC Med. 2006;4:38. [DOI] [PMC free article] [PubMed] [Google Scholar]
- 6. Jurj A, Ionescu C, Berindan‐Neagoe I, Braicu C. The extracellular matrix alteration, implication in modulation of drug resistance mechanism: friends or foes? J Exp Clin Cancer Res. 2022;41:276. [DOI] [PMC free article] [PubMed] [Google Scholar]
- 7. Shen Y, Wang X, Lu J, et al. Reduction of liver metastasis stiffness improves response to bevacizumab in metastatic colorectal cancer. Cancer Cell. 2020;37:800‐817. [DOI] [PubMed] [Google Scholar]
- 8. Qi Y, Xu R. Roles of PLODs in collagen synthesis and cancer progression. Front Cell Dev Biol. 2018;6:66. [DOI] [PMC free article] [PubMed] [Google Scholar]
- 9. Gilkes DM, Bajpai S, Chaturvedi P, Wirtz D, Semenza GL. Hypoxia‐inducible factor 1 (HIF‐1) promotes extracellular matrix remodeling under hypoxic conditions by inducing P4HA1, P4HA2, and PLOD2 expression in fibroblasts. J Biol Chem. 2013;288:10819‐10829. [DOI] [PMC free article] [PubMed] [Google Scholar] [Retracted]
- 10. Pankova D, Chen Y, Terajima M, et al. Cancer‐associated fibroblasts induce a collagen cross‐link switch in tumor stroma. Mol Cancer Res. 2016;14:287‐295. [DOI] [PMC free article] [PubMed] [Google Scholar]
- 11. Li G, Wang X, Liu G. PLOD2 is a potent prognostic marker and associates with immune infiltration in cervical cancer. Biomed Res Int. 2021;2021:5512340. [DOI] [PMC free article] [PubMed] [Google Scholar]
- 12. Wan J, Qin J, Cao Q, Hu P, Zhong C, Tu C. Hypoxia‐induced PLOD2 regulates invasion and epithelial‐mesenchymal transition in endometrial carcinoma cells. Genes Genomics. 2020;42:317‐324. [DOI] [PubMed] [Google Scholar]
- 13. Cheriyamundath S, Kumar A, Gavert N, Brabletz T, Ben‐Ze'Ev A. The collagen‐modifying enzyme PLOD2 is induced and required during L1‐mediated colon cancer progression. Int J Mol Sci. 2021;22:3552. [DOI] [PMC free article] [PubMed] [Google Scholar]
- 14. Komander D, Clague MJ, Urbe S. Breaking the chains: structure and function of the deubiquitinases. Nat Rev Mol Cell Biol. 2009;10:550‐563. [DOI] [PubMed] [Google Scholar]
- 15. Yu B, Shen B, Ba Z, et al. USP15 promotes the apoptosis of degenerative nucleus pulposus cells by suppressing the PI3K/AKT signalling pathway. J Cell Mol Med. 2020;24:13813‐13823. [DOI] [PMC free article] [PubMed] [Google Scholar]
- 16. Zhong M, Zhou L, Fang Z, et al. Ubiquitin‐specific protease 15 contributes to gastric cancer progression by regulating the Wnt/beta‐catenin signaling pathway. World J Gastroenterol. 2021;27:4221‐4235. [DOI] [PMC free article] [PubMed] [Google Scholar]
- 17. Tseng W, Leong X, Engleman E. Orthotopic mouse model of colorectal cancer. J Vis Exp. 2007;484. [DOI] [PMC free article] [PubMed] [Google Scholar]
- 18. Ueki Y, Saito K, Iioka H, et al. PLOD2 is essential to functional activation of integrin beta1 for invasion/metastasis in head and neck squamous cell carcinomas. iScience. 2020;23:100850. [DOI] [PMC free article] [PubMed] [Google Scholar]
- 19. Song Y, Zheng S, Wang J, et al. Hypoxia‐induced PLOD2 promotes proliferation, migration and invasion via PI3K/Akt signaling in glioma. Oncotarget. 2017;8:41947‐41962. [DOI] [PMC free article] [PubMed] [Google Scholar]
- 20. Du H, Chen Y, Hou X, et al. PLOD2 regulated by transcription factor FOXA1 promotes metastasis in NSCLC. Cell Death Dis. 2017;8:e3143. [DOI] [PMC free article] [PubMed] [Google Scholar]
- 21. Di WY, Kang XH, Zhang JH, Wang Y, Kou WZ, Su W. Expression of PLOD2 in esophageal squamous cell carcinoma and its correlation with invasion and metastasis. Zhonghua Bing Li Xue Za Zhi. 2019;48:102‐107. [DOI] [PubMed] [Google Scholar]
- 22. Zuurmond AM, van der Slot‐Verhoeven AJ, van Dura EA, De Groot J, Bank RA. Minoxidil exerts different inhibitory effects on gene expression of lysyl hydroxylase 1, 2, and 3: implications for collagen cross‐linking and treatment of fibrosis. Matrix Biol. 2005;24:261‐270. [DOI] [PubMed] [Google Scholar]
- 23. Randolph M, Tosti A. Oral minoxidil treatment for hair loss: a review of efficacy and safety. J Am Acad Dermatol. 2021;84:737‐746. [DOI] [PubMed] [Google Scholar]
- 24. Du W, Liu N, Zhang Y, et al. PLOD2 promotes aerobic glycolysis and cell progression in colorectal cancer by upregulating HK2. Biochem Cell Biol. 2020;98:386‐395. [DOI] [PubMed] [Google Scholar]
- 25. Young MJ, Hsu KC, Lin TE, Chang WC, Hung JJ. The role of ubiquitin‐specific peptidases in cancer progression. J Biomed Sci. 2019;26:42. [DOI] [PMC free article] [PubMed] [Google Scholar]
- 26. Faesen AC, Luna‐Vargas MP, Sixma TK. The role of UBL domains in ubiquitin‐specific proteases. Biochem Soc Trans. 2012;40:539‐545. [DOI] [PubMed] [Google Scholar]
- 27. Eichhorn PJ, Rodon L, Gonzalez‐Junca A, et al. USP15 stabilizes TGF‐beta receptor I and promotes oncogenesis through the activation of TGF‐beta signaling in glioblastoma. Nat Med. 2012;18:429‐435. [DOI] [PubMed] [Google Scholar]
- 28. van der Slot AJ, Zuurmond AM, Bardoel AF, et al. Identification of PLOD2 as telopeptide lysyl hydroxylase, an important enzyme in fibrosis. J Biol Chem. 2003;278:40967‐40972. [DOI] [PubMed] [Google Scholar]
- 29. Liu WT, Huang KY, Lu MC, et al. TGF‐beta upregulates the translation of USP15 via the PI3K/AKT pathway to promote p53 stability. Oncogene. 2017;36:2715‐2723. [DOI] [PMC free article] [PubMed] [Google Scholar]
- 30. Lowenthal DT, Affrime MB. Pharmacology and pharmacokinetics of minoxidil. J Cardiovasc Pharmacol. 1980;2(Suppl 2):S93‐S106. [DOI] [PubMed] [Google Scholar]
Associated Data
This section collects any data citations, data availability statements, or supplementary materials included in this article.
Supplementary Materials
Appendix S1.
Data Availability Statement
Datasets generated and analyzed during the current study are not publicly available but are available from corresponding author on reasonable request.


