

Summary
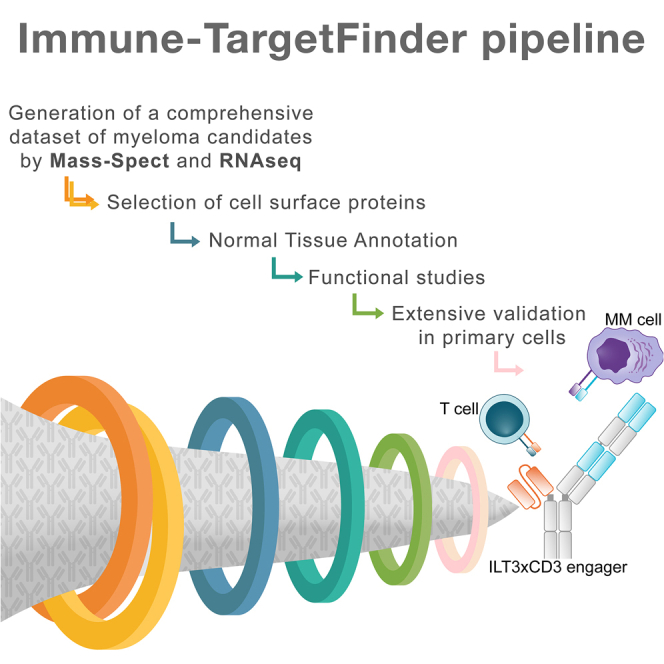
Multiple myeloma (MM) is an incurable malignancy of plasma cells. To identify targets for MM immunotherapy, we develop an integrated pipeline based on mass spectrometry analysis of seven MM cell lines and RNA sequencing (RNA-seq) from 900+ patients. Starting from 4,000+ candidates, we identify the most highly expressed cell surface proteins. We annotate candidate protein expression in many healthy tissues and validate the expression of promising targets in 30+ patient samples with relapsed/refractory MM, as well as in primary healthy hematopoietic stem cells and T cells by flow cytometry. Six candidates (ILT3, SEMA4A, CCR1, LRRC8D, FCRL3, IL12RB1) and B cell maturation antigen (BCMA) present the most favorable profile in malignant and healthy cells. We develop a bispecific T cell engager targeting ILT3 that shows potent killing effects in vitro and decreased tumor burden and prolonged mice survival in vivo, suggesting therapeutic relevance. Our study uncovers MM-associated antigens that hold great promise for immune-based therapies of MM.
Keywords: Target discovery strategy, Immune-TargetFinder pipeline, Mass-Spectrometry, target antigens, immunotherapy, multiple myeloma, validation, primary patient samples, bi-specific T cell engager, ILT3, CCR1, BCMA, SEMA4A, IL12RB1, FCRL3, LRRC8D
Graphical abstract
Highlights
-
•
A target discovery pipeline identifies suitable target antigens in multiple myeloma
-
•
ILT3 emerges from extensive validation in primary patient samples and healthy cells
-
•
We develop and test a novel bi-specific T cell engager targeting ILT3 in multiple myeloma
Di Meo et al. develop a platform for mapping the multiple myeloma surfaceome and identify promising targets extensively validated in many primary patient samples and healthy donors. This approach provides the basis for innovative immunotherapies for MM as shown by the potent efficacy of a bi-specific T cell engager targeting ILT3.
Introduction
Multiple myeloma (MM) is an incurable malignancy of mature plasma cells accounting for 1.8% of new cancer cases annually and 10% of hematological malignancies.1 Despite major advances in the treatment of MM, only approximately half of patients survive more than 5 years after diagnosis, with significantly lower rates (21% at 5 years) for patients bearing high-risk chromosomal translocations (i.e., t(4; 14), t(14; 16), t(14; 20)).
Targeting cell surface antigens with immune-based therapeutic interventions is a promising approach for patients with relapsed/refractory MM. For instance, monoclonal antibodies, antibody-drug conjugates, bispecific antibodies, and chimeric antigen receptor (CAR) T cell therapy targeting B cell maturation antigen (BCMA) have shown high response rates in patients with limited treatment options. However, the promising results from anti-BCMA immunotherapies do not come without challenges. Heterogeneously expressed BMCA at the intratumor level can lead to preferential targeting of cells with high BCMA while sparing those with low/zero BCMA expression, resulting in clonal selection.2 BCMA expression can be lost upon disease relapse, a mechanism called antigen escape.3,4 BCMA is also expressed on healthy cells,5 leading to on-target/off-tumor effects.6 Finally, most patients, especially high-risk patients, have only transient disease remissions that do not last more than 18 months.1,7,8 Thus, active investigations toward the identification of novel cell surface targets are urgently needed.
Despite the therapeutic relevance of cell surface proteins, an accurate mapping of the cancer surface proteome is still in development, and only recently have technological advances been able to provide the necessary means to comprehensively analyze the cancer-specific surfaceome. These advances include high-quality mass spectrometry (MS) methodologies and bioinformatics tools that help to overcome the challenge of studying surface proteins that present with low abundance, high hydrophobicity, and heavy post-translational modifications compared with intracellular proteins.9 We previously developed a target discovery strategy to identify CAR T cell targets in acute myeloid leukemia (AML).10 We used a composite high-throughput annotation database based on proteomics and transcriptomics to evaluate many candidate targets simultaneously. This work led to pre-clinical investigations of relevant CAR therapies for AML and helped elucidate potentially targetable disease mechanisms never before explored.
In this work, we developed a refined MM-specific method (named Immune-TargetFinder) to identify biologically and therapeutically relevant cell surface targets for engineered T cells and antibody developments in MM. An ideal immunotherapeutic target is a cell surface molecule that is highly expressed in malignant cells and minimally expressed in healthy tissues and plays a critical role in cancer biology in order for the therapy to tackle the critical mechanisms driving cancer survival and progression.9 We generated MS data from seven MM cell lines and subsequently analyzed their relevance to the patient population by integrating RNA sequencing (RNA-seq) data from over 900 patients with MM. We validated our findings in primary samples obtained from patients with relapsed/refractory MM, including patients who relapsed after BCMA-CAR T cell therapy, as well as primary hematopoietic stem cells and T cells from healthy donors. This work led to the identification of seven promising targets from a starting pool of 4,000+ proteins and 16,000+ transcripts. Our unbiased and systematic approach also identified molecules in current clinical use such as BCMA and SLAMF7, thus validating and strengthening the power of our pipeline. To demonstrate the translatability of our discoveries into clinically relevant therapeutic strategies, we developed a bispecific T cell engager targeting ILT3 in MM cells, which was able to mediate potent killing effects. Though a blocking antibody targeting ILT3 has recently received US Food and Drug Administration (FDA) Fast Track designation for the treatment of patients with AML, not much is known about the relevance of this target in MM. In this study, we provide a rationale for targeting this molecule in patients with MM and demonstrate the feasibility of combining target discoveries with innovative cell-based immunotherapies.
Results
A comprehensive landscape of the MM cell surface proteome
In order to create a comprehensive pool of candidates in search of suitable targets, we profiled the surface-specific proteome of seven MM cell lines bearing distinct genetic abnormalities using biotin labeling and isolation of surface membrane proteins followed by MS analysis. Our panel of MM cells included OPM-2 cells bearing a p53 mutation and t(4; 14) translocation; NCI-H929 cells with t(4; 14) and 8q+ alterations; JJN3 cells with t(14; 16) and t(8; 14) translocations; KMS-11 cells that are p53 null and bear t(4; 14), t(14; 16), and t(8; 14) translocations; U266 cells bearing a p53 mutation and t(11; 14) translocation; AMO-1 cells with p53 wild type (WT) and t(12; 14) translocation; and RPMI-8226 cells bearing p53 and KRAS mutations in addition to t(16; 22) and t(8; 22) translocations. Cell surface proteins were labeled with biotin on live cells; biotin-tagged proteins were then captured on avidin beads, digested with trypsin, and analyzed by MS. This generated an unbiased pool of 5,454 UniProt IDs corresponding to 4,761 proteins (Figures 1A and S1A; Table S1).
Figure 1.

Mapping the multiple myeloma cell surface proteome
(A) Experimental design showing 7 multiple myeloma (MM) cell lines and relative genetic aberrations, biotin labeling to enrich cell surface proteins, and number of protein IDs obtained from MS analysis.
(B) Our integrated scoring system for cell surface molecule annotation. Each repository with relative methodology and size is shown. 0 denotes that the protein was not found in any repository, and 5 denotes that the protein was found in all five repositories. Size, the numbers in the squares indicate the number of molecules contained in that dataset. Number of IDs, the number of molecules that have the score shown on the side.
(C) Integrated RNA-seq data from the CoMMpass database of patients with MM. Number of transcripts scored for genes coding for cell surface proteins is shown.
(D) Venn diagram showing the overlap between cell surface candidates (score equal or higher than 3) identified with MS analysis in MM cell lines and RNA-seq in patients with MM.
(E) Selection of 326 candidates out of 402 that are more highly expressed in patients by excluding molecules with an expression 1 SD below the average gene expression.
(F) Protein distribution of selected 326 candidates across 7 MM cells by MS.
(G) Circular bar plot graph showing the expression of current MM immunotherapeutic targets in the 7 MM cell lines by MS and ggplot2 in R. Height of column indicates label-free quantification (LFQ) intensity from MaxQuant averaged across replicate samples.
Given the lack of bioinformatics tools enabling accurate detection of proteins located at the cell surface, we developed an integrated scoring database for surface protein annotation. We merged five published databases that use different approaches to identify molecules that localize to the plasma membrane. In our integrative computational database, each UniProt ID is scored based on the number of databases it was identified in, with 0 denoting that the protein was not found in any and 5 denoting that the protein was found in all five databases (Figure 1B). Cutoff#1 includes 1,229 UniProt IDs, cutoff#2 699, cutoff#3 448, cutoff#4 260, and cutoff#5 63. Cutoffs indicate the number of MM membrane proteins that have been identified in 1, 2, 3, 4, or 5 repositories for cell surface membrane annotation. For instance, cutoff#3 indicates that 448 proteins are detected in at least 3 repositories for cell surface membrane annotation. Proteins with a surface score equal to or higher than 3 were selected for further analysis. Thus, we first used an MS-based approach to obtain an unbiased starting pool of candidate proteins, and next, we used the CoMMpass RNA data from 900+ patients to prioritize the proteins with relevance to the patient population. We integrated the CoMMpass RNA-seq dataset that provides gene expression data from 904 patients with MM. We applied our surface scoring system to 16,462 transcripts from patients with MM and identified 402 targets commonly detected by MS (Figures 1C and 1D). We further refined these 402 targets by calculating the average expression of each gene and removing those that showed low expression levels (1 SD below the mean), resulting in 326 selected genes that were expressed over the cutoff level (Figure 1E). Of note, patient gene expression was unimodal except for 7 transcripts showing non-unimodal expression (NCAM1, TPBG, ROB1, LAMP5, APP, PTRCAP, PLXAN2).
We defined the distribution of these 326 candidate targets in our panel of MM cell lines and found that most transcripts were shared across all samples (Figure 1F). This group of 326 genes included known MM-associated surface proteins, some of which are currently pursued as targets in clinical and pre-clinical studies (e.g., BCMA, SLAMF7, TACI, LY9, CD38, and CD138) (Figure 1G).
Identification of immune-related surface targets
To gain insights into functions of the MM surface proteome and especially for our group of 326 surface targets, we performed functional enrichment analyses with STRING.11 We identified three main protein networks that involve MM cell surface proteins: (1) immune-related proteins, (2) transporters, and (3) proteins mediating the adhesion to the stroma that are consistent with MM biology (Figures 2A and 2B). We focused on cell surface proteins included in the largest network (comprising 227 out of the 326 molecules) and functionally related to immune mechanisms. By probing the Kegg and Reactome collections for further functional analyses of this group of 227 molecules, we found that cytokine-dependent responses and natural killer (NK)-mediated cytotoxicity represent the most enriched mechanisms (Figures S1A and S1B).
Figure 2.

Identification of biologically and therapeutically relevant targets
(A) Identification of three protein networks from the list of 326 candidate targets. 490 edges (expected number of edges is 109) with average node degree of 3. Average local clustering coefficient is 0.326. Protein-protein interaction (PPI) enrichment p value is <1.0e−16.
(B) Results of the Gene Ontology enrichment analysis (biological process) of the selected 326 candidate targets.
(C) Heatmap showing the protein expression levels of 67 selected candidates in a large panel of healthy tissues. Blue indicates expression below the level of MS sensitivity, light pink means low expression, pink means medium expression, and red means high expression. Cutoff parameters for low, high, and medium expression were described in Perna et al.10 Arrows indicate common targets in current clinical and pre-clinical developments.
To select targets minimally expressed in healthy tissues and thus reduce the risk of on-target/off-tumor toxicity, we annotated the protein expression of each candidate simultaneously in a large panel of healthy tissues, as previously described.10 This panel was based on three public proteomic databases for human proteome annotation (Human Protein Atlas, Human Protein Map, and Proteomic Database) and 42 healthy tissues and organs of the whole body. We excluded proteins with high expression levels in any healthy tissues, except hematopoietic tissues (bone marrow, blood, lymph nodes, spleen, tonsils), and with an annotation available in more than two out of the three databases, as previously described.10 This led to identification of 94 promising targets. This list still included BCMA, SLAMF7, ITGB7, TACI, and LY9, strengthening the validity of our list. By overlapping the list of immune-related candidates (227) with the list of candidates presenting a favorable expression profile in healthy tissues (94), we selected 67 targets for further analyses (Figure 2C). This latter list still included BCMA, SLAMF7, ITGB7, and LY9, reported in clinical and pre-clinical MM studies.
Validation of candidate expression in primary MM patient samples and healthy hematopoietic cells
For validation of target protein expression in patients with MM, we prioritized 26 cell surface proteins with the most favorable protein expression profiles in healthy tissues based on Figure 2C. Thus, we defined their expression in a cohort of 31 primary patient samples purified by CD138 expression from patients with relapsed/refractory (R/R) MM including patients who relapsed after BCMA-CAR T cell therapy. Candidate protein expression was defined by western blot analysis. In our cohort of primary samples from 21 patients with MM including one patient who relapsed post-BCMA-CAR T cell therapy and 10 patients with newly diagnosed MM, patient average age was 64.2 (46–81), average R-ISS stage was 2.07 (1–3), average number of prior lines of treatment was 3.64 (0–7), 8 patients had received autologous stem cell transplant (SCT), and 3 patients had immunoglobulin A (IgA) MM, of which 2 were kappa chain restricted and one lambda chain restricted. 26 patients had IgG MM, 8 patients had lambda chain-restricted disease, and 18 patients had kappa chain-restricted disease. Patient characteristics are detailed in Table 1. We found that FCRL3, BCMA, ITGA4, SEMA4A, TRL1, CD320, CCR1, LILRB1, SELPG, LRRC8D, ILT3, PLXNA3, S1PR4, SLCO3A1, LAX1, and SLAMF6 presented high median expression compared with controls. Eleven targets, including ITGA4 (95.45%), BCMA (92.31%), FCRL3 (91.67%), LRRC8D (90.91%), CCR1 (90.91%), ILT3 (86.96%), SEMA4A (86.36%), LAX1 (81.82%), IL12RB1 (79.17%), SLAMF6 (69.57%), and CD320 (69.57%) were also frequently expressed in patients with R/R MM. Frequency ranged between 12.50% (KCNN4) and 95.45% (ITGA4) (Figures 3A–3C, S2A, and S2B).
Table 1.
Patient characteristics
| Pt | Age | Clinical status | R-ISS Stage | Treatment received | Auto SCT | Histologic type | Sample cells ×10e6 cells/mL | Selection | Cytogenetics/FISH | Bone marrow plasma cells (%) | Kappa chain/CD138 | Lambda chain/CD138 | |
|---|---|---|---|---|---|---|---|---|---|---|---|---|---|
| 1 | 75 | new diagnosis | 2 | Btz/Dexa | 2 | no | IgG kappa MM | 3.58 | CD138+ | 46,XY | 70 | – | – |
| 2 | 59 | refractory/relapsed | 3 | Btz/Mp | 2 | yes | IgG kappa MM | 2.343 | CD138+ | 46,XX | 80 | – | – |
| 3 | 76 | refractory/relapsed | n/a | Melph/Pred | 2 | no | IgG kappa MM | 2.08 | CD138+ | 46,XX | 58 | 97 | <1 |
| 4 | 70 | refractory/relapsed | n/a | Btz/Lena | 2 | yes | IgA kappa MM | 3.64 | CD138+ | 45XX, gain of 7, loss of 13 and 14, complex karyotype/three copies of 5q and 7q | 94 | – | – |
| 5 | 67 | refractory/relapsed | 3 | Btz/Lena/Pred | 3 | no | IgG kappa MM | 9.7 | CD138+ | 45,X | 95 | 96 | <1 |
| 6 | 48 | new diagnosis | 1 | Lena/Dexa/Carfil/Poma/Dara/Cyc | 6 | yes | IgG kappa MM | 1.93 | CD138+ | hyperdiploid/three copies of 1q and 7q, four copies of 5 and CCND1 | 90 | – | – |
| 7 | 54 | refractory/relapsed | 1 | Btz/Dexa/Lena | 3 | yes | IgG lambda MM | 4.034 | CD138+ | 46, XY/CCND1/IGH fusion, IGH loss | 40 | <1 | 95 |
| 8 | 68 | new diagnosis | 3 | Cyc/Btz/Dexa | 3 | no | IgG lambda MM | 3.99 | CD138+ | 46,XX/CCND1/IGH fusion, IGH rearrangement, and loss of 13q | 14 | <1 | 91 |
| 9 | 67 | refractory/relapsed | 2 | Btz/Melph/Lena/Dexa | 4 | yes | IgG kappa MM | 1.867 | CD138+ | 46,XY/CCND1/IGH fusion, 13q del, IGH rearrangement, TP53 del, MLL gain | – | – | – |
| 10 | 46 | refractory/relapsed | 2 | Thal/Dexa | 2 | yes | IgG kappa MM | 1.78 | CD138+ | hyperdiploid | 88 | – | – |
| 11 | 68 | refractory/relapsed | 2 | Melp/Lena | 2 | yes | IgG kappa MM | 1.814 | CD138+ | 46,XX | 27 | – | – |
| 12 | 64 | refractory/relapsed | 2 | Lena/Btz/Dexa/Thal | 4 | yes | IgG kappa MM | 1.53 | CD138+ | 47,XX,+X | 95 | 93 | <1 |
| 13 | 67 | new diagnosis | n/a | Melph/Ixa | 2 | yes | AL amyloidosis | 1.72 | CD138+ | 46XY | 9 | – | – |
| 14 | 60 | refractory/relapsed | 2 | Carfil/Dexa/Cyc/Pred/Btz/Benda | 6 | yes | IgG lambda MM | 1.502 | CD138+ | hyperdiploid/gain of 1q21, loss of 8p21, 13q14, and 14q32 | 77 | – | – |
| 15 | 45 | new diagnosis | 2 | Lena/Btz/Dexa | 3 | yes | IgG kappa MM | 1.82 | CD138+ | 46,XY | 2 | – | – |
| 16 | 62 | new diagnosis | 2 | Lena/Dexa/Melph | 3 | yes | IgG kappa MM | 0.4 | CD138+ | 46, XX | 1 | 55 | 10 |
| 17 | 52 | refractory/relapsed | 2 | Thal/Dexa/Cyc/Lena/Doxo/Cispl/Etop | 7 | yes | IgG lambda MM | 1.056 | CD138+ | 46, XY | 90 | – | – |
| 18 | 52 | refractory/relapsed | 2 | Thal/Dexa/Cyc/Lena/Doxo/Cispl/Etop | 7 | yes | IgG lambda MM | 1.516 | CD138+ | 46, XY | – | – | – |
| 19 | 81 | refractory/relapsed | n/a | rituximab/vinctristine/Cyc/Pred | 4 | no | Waldenstrom macroglobulinemia IgM | 1.32 | CD138+ | 46,XY | 1 | 86 | 4 |
| 20 | 71 | refractory/relapsed | 3 | Lena/Cyc/Pred | 3 | yes | IgG lambda MM | 1.6 | CD138+ | hyperdiploid/gain of 1q, 8p, 5p, 7q, 11q, 14q, and 17, CCND1/IGH fusion, IGH rearrangement | 52 | <1 | 98 |
| 21 | 58 | refractory/relapsed | 2 | Lena/Cyc/Pred/Btz | 4 | yes | IgG kappa MM | 1 | CD138+ | 46,XY/gains of 5 and 7 | 8 | 98 | <1 |
| 22 | 67 | refractory/relapsed | 1 | Lena/Btz/Dexa | 3 | yes | IgG lambda MM | 0.95 | CD138+ | 45,X,-X[3]/46,XX | 32 | – | – |
| 23 | 74 | new diagnosis | 1 | None | 0 | no | IgG kappa MM | 1 | CD138+ | 46,XY/gain of 5p15.2, 5q31, 7q11.23, and 7q31 | 21 | – | – |
| 24 | 61 | refractory/relapsed | 1 | Lena/Btz/Dexa/Doxo/Cyc/Carfil/Poma | 7 | yes | IgG kappa MM | 1.356 | CD138+ | hyperdiploid/gain of 5p15.2, 5q31, and 11q13 (CCND1), loss of 13q14.2 and 13q14.3 | 9 | – | – |
| 25 | 76 | new diagnosis | 2 | Lena/Btz/Dexa/Cyc/Carfil/Dara | 6 | yes | IgG kappa MM | n/a | CD138+ | hyperdiploid/loss of 8p21, 13q14.2m 13q14.3m 14q32.3, 17CEN, and 17p13.1 | 26 | – | – |
| 26 | 59 | new diagnosis | 3 | Btz/Cyc/Dexa | 3 | yes | IgA kappa MM | n/a | CD138+ | hyperdiploid | 80 | 98 | <1 |
| 27 | 77 | refractory/relapsed | 3 | Lena/Pred/Btz/Melph/Dexa | 5 | no | IgG kappa MM | n/a | CD138+ | hyperdiploid/loss of 8p21, tp53, and 5IGH; gain of 5, 7q, and CCND1 | 23 | 91 | <1 |
| 28 | 71 | refractory/relapsed | 1 | Lena/Btz/Dexa/Dara/Pom/Mp/BB2121 | 7 | yes | IgG kappa MM | 1.3 | CD138+ | complex karyotype | – | – | – |
| 29 | 66 | refractory/relapsed | 3 | Lena/Btz/Dexa | 3 | yes | IgG kappa MM | 1 | CD138+ | 46XY/gain of 1q and monosomy 13q and gain of 11q | – | – | – |
| 30 | 63 | new diagnosis | 3 | Btz/Dexa | 2 | no | IgA lambda MM | n/a | CD138+ | 46XX | 4 | – | – |
| 31 | 67 | refractory/relapsed | 2 | Btz/Dexa/Cyc | 3 | yes | IgG lambda MM | n/a | CD138+ | hyperdiploid | – | – | – |
Characteristics of 31 patients whose bone marrow CD138+ cells were utilized for the protein validation step of selected targets by western blot analysis. FISH is negative or was not performed where not specified. Pt, patient; n/a, no information available; Benda, bendamustine; Btz, bortezomib; Carfil, carfilzomib; Cispl, cisplatin; Cyc, cyclophosphamide; Dara, daratumumab; Dexa, dexamethasone; Doxo, doxorubicin; Etop, etoposide; Ixa, ixazomib; Lena, lenalidomide; Melph, melphalan; Mp, methylprednisone; Poma, pomalidomide; Pred, prednisone; SCT, stem cell transplant; Thal, thalidomide.
Figure 3.

Validation step in primary patient samples
(A) Target expression levels normalized by the loading control (VCP) based on western blot validation in 31 MM patient samples.
(B) Frequency of target expression in primary MM patient samples by western blot.
(C) Representative western blot (WB) data of 11 top candidate targets in MM primary patient samples. Numbers refer to patient samples used. VCP serves as loading control. Complete set of data in Figure S2A.
(D) Target expression in purified healthy hematopoietic stem cells by flow cytometry. Data representing the results of three independent biological experiments in primary healthy CD34+CD38−CD45RA−CD90+CD49f+ HSCs by flow cytometry. Gating strategy is shown in Figure S2C. Data represent means ± SD.
(E) Target expression in freshly purified and activated T cells by flow cytometry. T cell activation is confirmed by measuring CD25 and HLADR upon treatment with CD3/CD28 beads at days 0, 4, and 5 (see Figure S2D). Data represent the results of three independent biological experiments. Data represent means ± SD.
(F) Schematic representation of the stepwise pipeline utilized for target discovery and relative numbers of candidates obtained per step.
To exclude the possibility that targeting our MM-associated surface proteins may cause severe myeloablation and toxicity within the hematopoietic stem cell compartment, we purified CD34+CD38−CD45RA−CD90+CD49f+ hematopoietic stem cells (HSCs) from cord blood and defined target expression within this vital and highly purified cell population by flow cytometry (Figures 3D and S2C). We found that CD320 and ITGA4 are highly expressed in HSCs (55.6% and 61.2%, respectively), further narrowing down our list to 9 candidate targets. Notably, ILT3, CCR1, IL12RB1, SLAMF6, FCRL3, and LAX1 showed lower expression levels than BCMA within this highly purified and critical population of HSCs. We also defined target expression in freshly purified CD3+ T cells before and after activation with CD3/CD28 beads, as shown by CD25 and HLA-DR expression (Figure S2D). Activated T cells serve as a model to exclude targets that may cause fratricide-induced killing in adoptive cell therapies. We found that CCR1, ILT3, and FCRL3 are not expressed in T cells, while SLAMF6 and LAX1 are highly expressed in T cells, and their expression further increases upon activation ranging from 72% to 98% (Figures 3E and S2D). Taken together, six candidate targets (CCR1, ILT3, FCRL3, SEMA4A, IL12RB1, LRRC8D) in addition to BCMA presented the most favorable expression profiles. In summary, the Immune-TargetFinder pipeline allowed us to systematically evaluate over 4,000 candidate proteins and nominate 7 top targets for functional targeting in MM (Figure 3F).
T cell engager antibody targeting ILT3 shows efficacy in killing MM cells
ILT3, an immunoreceptor tyrosine-based inhibition motif-containing receptor and a marker of monocytic leukemia,10,12 is among our top 7 candidates. CAR T cells and antibodies blocking ILT3 signaling have been shown to impede AML development.13 The FDA has granted Fast Track designation for IO-202, a myeloid checkpoint inhibitor targeting ILT3, also known as LILRB4, for the treatment of patients with relapsed or refractory AML.
We performed survival analysis in 767 patients with newly diagnosed MM and found that ILT3 significantly impacts clinical outcomes of patients with MM (Figure 4A). Further, we defined the co-expression levels of ILT3 and BCMA in MM (Figures S3A–S3C). To determine whether ILT3 on MM cells suppressed T cells, based on an assay previously used in AML,12 we deleted ILT3 from MM cells and co-cultured irradiated ILT3 knocked out U266 MM cells with healthy donor T cells for 48 h at a 2:1 ratio in the same well plate. T cells were previously activated with anti-CD3/CD28-coated beads and anti-rhIL-2. After 48 h of co-culture, T cells were counted and analyzed by flow cytometry. We found that knockout (KO) of ILT3 promoted an increase in T cell numbers (Figure 4B), suggesting that ILT3 may function as an inhibitory immune receptor in MM biology. In order to evaluate the efficacy of ILT3 targeting in MM, we generated an ILT3-based T cell engager (Figures 4C and S3D–S3F) and evaluated its ability to induce T cell-dependent cytotoxicity (TDCC) against ILT3+ MM cell lines. In this assay, previously expanded human T cells were combined with MM cells in the presence of increasing concentrations of the ILT3 x CD3 bispecific, and induction of apoptosis in MM cells was determined by activation of caspase 3/7, which was measured in real time over a 24 h period using a live-cell imaging system. As shown in Figure 4D, the ILT3 × CD3 engager potently induced TDCC against multiple MM cell lines with EC50 values in the low pM range. We also confirmed the efficacy of this antibody on BCMA-KO MM cells (Figure 4E) as well as on primary samples from patients who relapsed after treatment with BCMA-CAR T cell therapy (Figure 4F). Following these promising data, we evaluated the effects of ILT3 × CD3 engager treatment in vivo by injecting MM cells and human T cells in NSG immunocompromised mice. The ILT3 × CD3 engager had a half-life of approximately 7.4 days in NSG mice engrafted with an ILT3+ cell line and human T cells following administration of a single intravenous (i.v.) dose at 1 mg/kg. We found that treatment with the ILT3 × CD3 engager decreased tumor burden as shown by decreased human lambda chain concentrations in the serum of mice treated with the engager compared with the untreated controls (Figure 4G) and prolonged mice survival (Figure 4H). Equal efficiency was observed with NSG mice injected with human BCMA-KO MM cells and T cells (Figures 4I–4L). These data suggest that employing an ILT3-targeting agent to re-direct and potentiate T cell response is a valuable therapeutic approach for eliminating MM cells including relapsed disease escaping BCMA immunotherapy as well.
Figure 4.

ILT3 × CD3 bispecific T cell engager antibody for MM
(A) Overall survival of patients with de novo MM based on ILT3 expression. Patients with an ILT3 expression above the median gene expression present a statistically significant worse survival. Survival analysis was performed using the R package Survival with log rank test and hazard ratio statistical tests and the MMRF cohort, as we previously described.14
(B) T cells isolated from healthy donors were activated with CD3/CD28 beads and co-cultured with U266 MM cells expressing an empty vector (controls) or ILT3 knockout (KO) U266 MM cells for 48 h at a target:effector 1:2 ratio. CFSE-positive T cells were counted by flow cytometry. ∗∗p ≤ 0.01. Data represent the results of three independent biological experiments. Statistical analyses were performed using Student’s t test.
(C) Schematic representation of the bivalent anti-ILT3 × CD3 bispecific antibody that we developed. T cell engager was designed on a human IgG1 backbone. The bivalent tandem anti-ILT3 Fabs are positioned on the Knob Fc, and the anti-CD3 scFv is positioned on the Hole Fc. The anti-ILT3 Fab targeting arm contains humanized variable heavy (vH) and variable light (vL) sequences that were selected from an antibody campaign against the extracellular domain of human ILT3. Data represent the results of three independent biological experiments.
(D) Killing assays of 3 RFP-labeled MM cell lines (U266, H929, and MM1.S cells). Cells are co-cultured with T cells (target:effector [T:E] ratio 1:5) and treated with ILT3 × CD3 antibody or control antibody (anti-KLH). A caspase cleavage domain coupled to a green DNA-binding fluorescent label is released upon cleavage by activated caspase 3/7 and quantified.
(E) We generated a BCMA-KO U266 cell line and determined the killing ability of the ILT3 × CD3 antibody in co-culture with healthy T cells. The cell line was RFP labeled as described for (D).
(F) T cells isolated from healthy donors were co-cultured with primary samples from patients who relapsed post-BCMA-CAR T cell therapy. The ILT3 × CD3 antibody was added to the culture, and T cell activation was measured by CD25 expression with flow cytometry. Percentage of CD3+CD25+ T cells was compared between the group treated with the ILT3 × CD3 antibody and the group treated with the control antibody (anti-KLH). Untreated cells and T cells alone served as additional controls. ∗∗p ≤ 0.01. Statistical analyses were performed using Student’s t test.
(G) In vivo treatment with ILT3 × CD3 antibody (1 mpk). NSG mice were injected with MM U266 cells and healthy T cells from healthy volunteers and treated with 4 weekly doses of ILT3 × CD3 antibody or control IgG. Lambda chain concentration in mice serum by ELISA at multiple time points served as measurement of the tumor burden. ∗p ≤ 0.05, ∗∗p ≤ 0.01. Data represent the results of two technical replicates. Statistical analyses were performed using Student’s t test.
(H) Overall mice survival from the experiment described in (G). ∗p ≤ 0.05. Statistical analyses were performed using log rank (Mantel-Cox) test.
(I) NSG mice were injected with BCMA-KO MM U266 cells and healthy T cells from healthy volunteers and treated with 4 weekly doses of ILT3 × CD3 antibody (1 mpk) or control IgG. Lambda chain concentration in mice serum by ELISA at multiple time points served as measurement of tumor burden. ∗p ≤ 0.05, ∗∗p ≤ 0.01. Data represent the results of two technical replicates. Statistical analyses were performed using Student’s t test.
(J) Overall mice survival from the experiment described in (I). ∗p ≤ 0.05. Statistical analyses were performed using log rank (Mantel-Cox) test.
Data in (D)–(G) and (I) represent means ± SD.
Discussion
Despite new therapies, MM remains incurable for most patients. Targeting tumor antigens with immunotherapy is rapidly emerging as a promising approach for treatment of cancer, including MM. To identify suitable targets for immunotherapy of MM, we generated a comprehensive platform integrating MS data from MM cell lines (Figure 1A) and RNA-seq data from patients with MM (Figure 1C) and developed a useful computational tool for cell surface molecule annotation (Figure 1B) to screen 4,000+ proteins and 16,000+ transcripts for molecules highly likely localized at the plasma membrane. This enabled identification of a group of 326 cell surface candidate targets associated with biological functions such as immune mechanisms, metabolism, and adhesion to the stroma, suggesting that the MM surfaceome may play an important role in regulating immune responses and MM biology (Figures 2A and 2B).
Based on our results, ILT3, SEMA4A, CCR1, IL12RB1, FCRL3, and LRRC8D emerge as promising targets for immune-based therapies of R/R MM. Our study also identified targets such as BCMA currently used in pre-clinical and clinical development of immunotherapy for MM, strengthening the power of our approach. Some targets, such as CD38 and GPRC5D, pass steps 1 and 2 of our pipeline (Figure 3). In fact, GPRC5D expression in the medulla oblongata may have caused unusual cerebellar toxicities in some patients treated with GPCR5D CAR T cells.15
A similar approach was taken in two previous studies. Anderson et al. profiled multiple MM cells with a biotinylation reaction. This analysis led to the identification of SEMA4A, a promising target antigen for MM that emerged from our analysis as well (Figure 3F). Ferguson et al. utilized a cell surface capture approach to isolate N-linked glycoproteins, obtaining a pool of 1,245 proteins, from which 530 candidates were used for further analyses. They also identified ILT3, CCR1, SEMA4A, and LAX1, highlighting the value of these MM cell surface molecules commonly found. Our validation in primary healthy T cells showed that LAX1 is expressed in T cells. We developed comprehensive tools for cell surface molecule annotation as well as healthy tissue annotation; it is possible that by applying our computational scripts to the resources generated by other groups, additional candidate targets may be identified.
ILT3 is a suppressive immunoreceptor whose expression is highly restricted to monocytes, macrophages, and dendritic cells in healthy individuals. Although ILT3 is not expressed on circulating B cells in healthy individuals, ILT3 expression has been reported on pathogenic, autoantibody-secreting plasmablasts and plasma cells in patients with untreated systemic lupus erythematosus (SLE).16 Our results document ectopic ILT3 expression on malignant plasma cells and prognostic value of ILT3 in patients with MM and suggest the potential benefit of ILT3-targeted approaches in MM (Figures 3 and 4). In addition to its utility as an “address” to direct T cell-mediated depletion of ILT3-expressing tumor cells, we show that ILT3 expressed on myeloma cells may play a functional role in suppressing antitumor immune responses, as genetic deletion of ILT3 increased T cell activation in co-cultures of T cells and MM cells (Figure 4B). This has been previously observed in the context of AML, where anti-CD3/CD28-driven T cell proliferation was suppressed in the presence of WT, but not ILT3-KO, THP-1 monocytes. The FDA has granted Fast Track designation for IO-202, a myeloid checkpoint inhibitor targeting ILT3 for the treatment of patients with R/R AML. In this work we report the activity of an ILT3 × CD3 bispecific T cell engager capable of inducing robust antimyeloma responses in pre-clinical models of MM and therefore representing an innovative therapeutic approach with high impact in translational medicine. Our platform represents a valuable tool for discovering suitable target antigens, providing a relevant contribution to the field of cancer immunotherapy and antibody development. This knowledge, in turn, may be translated into therapeutic approaches that will address the limitations of the currently available treatment options.
Limitations of the study
Future studies should validate target expression in larger cohorts of patients given the heterogeneity of MM. It is possible that by applying our computational scripts to alternative data resources, additional candidate targets may be identified. Further studies should investigate the role of the myeloma surfaceome in disease initiation and progression with various functional assays.
STAR★Methods
Key resources table
| REAGENT or RESOURCE | SOURCE | IDENTIFIER |
|---|---|---|
| Antibodies | ||
| ANKH | Abcam | RRID:AB_11145258 |
| BCMA (TNFRSF17) | Cellsignaling | RRID:AB_1809128 |
| C10orf54 (VSIR) | Epigentek | A67834 |
| CCR1 | Biovision | RRID:AB_2259969 |
| CD28 | Cellsignaling | 38774S |
| CD320 | Bio source | MBS9213625 |
| CD37 | Abcam | RRID:AB_1658390 |
| DAGLB | Bethyl | RRID:AB_2632224 |
| FCRL3 | Invitrogen | RRID:AB_2804496 |
| IFNGR1 | Abcam | RRID:AB_10999916 |
| IL12RB1 | Lsbio | RRID:AB_10832104 |
| IL27RA | Cusabio | PA761488ESR1HU |
| IL2RG | Abcam | RRID:AB_2264646 |
| IL6R α | RD systems | MAB227-SP |
| ITGa4 | Cellsignaling | 8440T |
| ITGB7 | Santacruz | RRID:AB_2249383 |
| ITM2C | RD systems | RRID:AB_1964638 |
| KCNA3 | Prosci | 57–918 |
| KCNN4 | Abcam | RRID:AB_1523850 |
| LAX1 | Proteintech | RRID:AB_10732821 |
| LILRB1 | Abcam | RRID:AB_2296996 |
| LILRB4 (CD85K) | RD systems | RRID:AB_356326 |
| LRP10 | Invitrogen | RRID:AB_2717643 |
| LRRC8D | Invitrogen | RRID:AB_2788056 |
| LY9 (CD229) | Sino biological | 200226-T40 |
| NEMP1 (TMEM194A) | Invitrogen | RRID:AB_2610471 |
| PLXNA3 | Bethyl | RRID:AB_2632222 |
| PLXNC1 | Santacruz | SC390216 HRP |
| PSEN2 | Biosource | MBS7052325 |
| SELPLG (PSLG-1/CD162) | RD systems | RRID:AB_10973837 |
| SEMA4A | RD systems | RRID:AB_11127457 |
| SIPR4 | Biosource | MBS2529432 |
| SLAMF6 (CD352) | Cellsignaling | 36977S |
| SLAMF7 (CD319) | Cellsignaling | 98611S |
| SLC17A5 | Aviva | OAEB03119 |
| SLC5A3 | Abbexa | abx121741 |
| SLCO3A1 | Novus bio | RRID:AB_11011936 |
| TLR1 | Abcam | RRID:AB_2920618 |
| TMEM154 | Santacruz | SC-398802 |
| LRRC8A | Novus bio | RRID:AB_11005622 |
| CD3 | BioLegend | RRID:AB_10000909 |
| CD25 | BioLegend | RRID:AB_2561977 |
| HLADR | BioLegend | RRID:AB_493771 |
| LAX1 | Novus biologicals | RRID:AB_2133382 |
| SLAMF6 | Miltenyi | RRID:AB_2657670 |
| IL12RB1 | BD biosciences | RRID:AB_2742058 |
| LRRC8D | Novus biologicals | RRID:AB_2137768 |
| SEMA4A | RD systems | RRID:AB_2715595 |
| BCMA | Miltenyi | RRID:AB_2751592 |
| CCR1 | BioLegend | RRID:AB_2687211 |
| LILRB4/ILT3 | BD biosciences | RRID:AB_2741061 |
| FCRL3 | RnD systems | CatFAB3126P |
| CD320 | LSBio | RRID:AB_10830289 |
| ITGA4 | BioLegend | RRID:AB_2620524 |
| CD38 | BioLegend | RRID:AB_2561950 |
| CD34 | BioLegend | RRID:AB_10783490 |
| CD90 | BioLegend | RRID:AB_2561693 |
| CD45RA | Invitrogen | RRID:AB_1476948 |
| CD49f | BioLegend | RRID:AB_2249260 |
| Biological samples | ||
| Human Healthy Donor PBMC | IU Hospital | N/A |
| Human Patient Samples | IU Biobank | N/A |
| Critical commercial assays | ||
| Human Lambda ELISA Kit | Bethyl Laboratories | E88-116 |
| Human Kappa ELISA Kit | Bethyl Laboratories | E88-115 |
| Pierce® Cell Surface Protein Biotinylation and isolation Kits | Thermo Fisher | A44390 |
| Chemicals, peptides, and recombinant proteins | ||
| anti-CD3/CD28-coated beads | Thermo Fisher | 11161 |
| Human IL-2 IS | Miltenyi | 130-097-743 |
| CellTrace™ CFSE Cell Proliferation Kit | Thermo Fisher | C34554 |
| Caspase 3/7 Green Reagent | Sartorius | 4440 |
| magnetic beads | Miltenyi | 130-051-301 |
| Recombinant DNA | ||
| pCW-Cas9 | Addgene | 50661 |
| pLX-sgRNA | Addgene | 50662 |
| Nuclight Red lentivirus | Sartorius | 4625 |
| Experimental models: Cell Lines | ||
| AMO1 | Roodman Lab | N/A |
| KMS11 | Roodman Lab | N/A |
| U266 | Roodman Lab | N/A |
| RPMI | Roodman Lab | N/A |
| OPM2 | Roodman Lab | N/A |
| JJN3 | Roodman Lab | N/A |
| MM1S | ATCC | CRL-2974 |
| NCI-H929 | Roodman Lab | N/A |
| Experimental models: Organisms/strains | ||
| NOD/SCID/IL-2Rg-null (NSG) mice | Indiana University Core | N/A |
| Software and algorithms | ||
| FlowJo v10 | FlowJo, LLC | https://www.flowjo.com; RRID:SCR_008520 |
| GraphPad Prism v9.1.0 | GraphPad | https://www.graphpad.com |
| Inference of CRISPR Edits (ICE) Tool | Synthego | https://ice.synthego.com |
| Incucyte ZOOM software | Sartorius | N/A |
| Deposited data | ||
| MS data | MassIVE | Database: MSV000088419 |
Resource availability
Lead contact
Further information and requests for resources and reagents should be directed to and will be fulfilled by the lead contact. Dr. Fabiana Perna (Fabiana.Perna@moffitt.org).
Materials availability
All reagents generated are available from the lead contact with a completed Materials Transfer Agreement.
Experimental model and subject details
Cell lines
The following MM cell lines were used: NCI-H929, OPM-2, and KMS-11 bearing the t(4; 14) chromosomal abnormality; KMS-11, MM1S and JJN3 bearing the t(14; 16) abnormality; RPMI-8226 bearing the t(8; 22) and t(16; 22) abnormalities; AMO-1 bearing the t(12; 14) abnormality; U266 bearing the t(11; 14), chromosomal abnormality. Cell lines were obtained from Dr. Roodman’s laboratory, checked for Mycoplasma infection, and cultured at 37°C in a humidified atmosphere containing 5% CO2 and maintained in RPMI media supplemented with 10% fetal bovine serum (FBS).
Mice
In vivo experiments were conducted using 6-8-week-old NOD/SCID/IL-2Rg-null (NSG) mice obtained from the Indiana University Core. These experiments were carried out under a protocol approved by the Institutional Animal Care and Use Committee to ensure that all experiments involving the mice adhered to the highest ethical standards and guidelines for animal care and use in scientific research. The mice were housed at a consistent temperature of 21 ± 2 C with 60 ± 20% relative humidity in a pathogen-free environment, subjected to a 12-h light/dark cycle. The animals were given unrestricted access to sterilized food acidified water.
Human samples
De-identified primary patient samples were stored in the IU Biobank under IRB protocol #1804208190. Study participants provided written informed consent, in compliance with the Declaration of Helsinki. Gender, age, health status and prior treatment are described in Table 1.
Method details
Proteomic studies
Pierce Cell Surface Protein Biotinylation and isolation Kits (Thermo Fisher, A44390) were used for labeling and isolation of cell surface proteins. The cells were incubated with the membrane-impermeable Sulfo-NHS-SS-biotin reagent for 10 min at RT, after the incubation the labeling reagent was removed, and the cells were washed to remove any excess labeling reagent before lysis. Biotinylated proteins were captured on Neutravidin resin, and unlabeled proteins were removed by repetitive washing. Prior to Mass-Spect analysis, bounded biotinylated proteins on the Neutravidin resins were fully digested overnight on-beads with trypsin. Digested peptides were desalted. Desalted peptides were analyzed by LC-MS/MS using 170 min LC gradient and DIA method on Orbitrap Fusion. Samples specific libraries (SSL) were generated using equal number of digested proteins from each sample. MS Raw data were searched with SSL using Spectronaut software. Protein expression quantification was done using Label Free Quantification (LFQ). We deposited the proteomic data reported in the MassIVE Repository, Database: MSV000088419.
Scoring database
An integrated database to identify cell surface molecules was created by merging five published databases.17,18,19,20,21 These databases used different methodologies in identifying molecules that localized to the plasma membrane. The database from Díaz-Ramos et al. was manually curated from the literature and databases with gene and/or protein expression to identify genes expressed in immune cell and lymphoid tissues. The database from Baush-Fluck et al. was computationally compiled using a random forest classifier trained on domain-specific protein features and tested on a set of α-helical transmembrane proteins. The authors also included annotated GPI-anchored proteins in their database. The database from Town et al. was computationally compiled using GO and Uniprot annotation followed by transmembrane domain prediction and signal peptide prediction. Furthermore, the authors classified the confidence of identified proteins based on sources of evidence. The database from da Cunha et al. was computationally compiled by transmembrane domain prediction. Genes predicted to be signal peptides and found to have other subcellular localization annotations were removed. The database from Thule et al. was experimentally determined by antibody-based immunofluorescence microscopy. We downloaded the data from the HPA Cell Atlas (https://www.proteinatlas.org/humanproteome/cell), keeping the information of gene name, Ensembl ID, Uniprot ID, Subcellular location, and Secretome location. Any gene with a Subcellular location of Plasma membrane was defined to be present on the cell surface. Each Uniprot ID was scored based on the number of databases it was identified in, with 0 denoting the protein was not found in any and 5 denoting the protein was found in all five.
Gene editing using the CRISPR/Cas9 technology
Human MM cells were infected with doxycycline-inducible Cas9-expressing lentivirus (pCW-Cas9, Addgene 50661). Three sgRNA sequences were used per target and designed using Synthego design tool. Each sgRNA was cloned into the lentiviral pLX-sgRNA (Addgene 50662) between the XhoI and NheI sites according to Addgene individual sgRNA cloning protocol. BCMA targeting sgRNA (sgRNA1 GGTGTGACCAA TTCAGTGAA; sgRNA2 GTATTAAGCTCAGTCCCAAAC; sgRNA3 GTCGTGCTAATGTTTTTGCTA) ILT3 targeting sgRNA (sgRNA1 GACGGTACTCCCGAGCCTCCA; sgRNA2 GGCTTTCCTCTTTATCCAGA; sgRNA3 GAAGAGGAAAGCCCAGCACCC). Cells expressing pCW-Cas9 were incubated with pLX-sgRNA lentivirus expressing the desired sgRNA control sequence. Cells were treated with 1 μg/ml doxycycline and 4 μg/mL blastycidine for 7 days. Knock-out cells were verified by flow-cytometric analyses.
Flow cytometry analyses
The following flow cytometry antibodies were used: anti-IL12RB1 (CD212) cat#744206 (BDBiosciences), anti-CCR1 (CD191) cat#362918 (Biolegend), anti-BCMA (CD269) cat#130-118-970 (Milteny), anti-LILRB4 (CD85K) cat#742809 (BBBiosciences), anti-FCRL3 (CD307c) cat#374406 (Biolegend), anti-SLAMF6 (CD352) cat#130-105-595 (Milteny), anti-SEMA4A cat#148406 (Biolegend), anti-CD320 cat#LS-C253978 (LSbio), anti-LRRC8D cat# NBP2-99295AF700 (Novus Biologicals), anti-LAX1 cat#NBP2-97470AF700 (Novus Biologicals), anti-CD3/FITC cat# 300306 (Biolegend), anti-CD69/PE cat# 310906 (Biolegend), anti-CD25/APC cat# 356110 (Biolegend) and anti-HLA-DR/AF700 cat# 307626 (Biolegend).
Myeloma cells and T-cells co-cultures
Human knock-out and control MM cells were irradiated (28 Gy) and then mixed, at a 2:1 ratio, with human T-cells isolated from healthy donors in 12-well plates. T cells were activated with anti-CD3/CD28-coated beads (11161D, Thermo Fisher) and anti-50 U/ml rhIL-2 for 4 days prior to co-culture. After 48 h of co-culture, cells were counted, T cells were stained with CFSE before co-culture and analyzed by flow cytometry.
Design, expression, and characterization of the ILT3 x CD3 bispecific antibody
An ILT3-based T cell engager was designed in a scFv-Fab bispecific format on a human IgG1 backbone. The Fc both contain the L234A + L2235A (LALA) mutations to minimize Fc receptor-mediated effector function, as well as the T366W (W, Knob) and the T366S + L368A + Y407V (SAV, Hole) mutations on separate arms to promote knob-in-hole assembly. The bivalent tandem anti-ILT3 Fab are positioned on the Knob Fc, and the anti-CD3 scFv is positioned on the Hole Fc. The anti-ILT3 Fab targeting arm contains humanized vH and vL sequences that were selected from an antibody campaign against the extracellular domain of human ILT3. The anti-CD3 engager arm is SP34-derived but was modified to decrease affinity to CD3. The bispecific antibody was expressed from Chinese hamster ovary (CHO) cells and isolated from the conditioned medium to a final purity of >96%, as determined by size exclusion chromatography (SEC-HPLC). The ILT3 x CD3 engager demonstrates sub-nM kD affinity toward ILT3 of human origin (KD = 0.2 nM at 25°C by surface plasmon resonance) and is not cross-reactive to other LILRA/B family members. The ILT3 x CD3 engager was provided by NGM Biopharmaceuticals and is a surrogate for the development candidate NGM936.
T cell-dependent cytotoxicity (TDCC) assays
The MM cell lines MM1S, U226, and H929 were infected with which transduces cells with a nuclear-restricted red fluorescent label, at a multiplicity of infection (MOI) of 3. Red-labeled cells were sorted on a FACSAria II flow cytometer (BD Biosciences) and expanded without selection for use as targets in TDCC assays. T cells were purified from human PBMCs by negative selection using the pan T cell isolation kit (Miltenyi) and activated with Dynabeads coated with human anti-CD3/CD28 antibodies (Gibco/ThermoFisher Scientific) at a 1:1 cell:bead ratio in X-Vivo 15 media (Lonza) containing 5% normal human serum (MilliporeSigma), 2 mM GlutaGro (Corning), 10 mM HEPES (Corning), and 5 ng/mL IL-17, 5 ng/mL IL-15, and 25 ng/mL IL-2 (all from Peprotech) for 2 days. After the removal of the Dynabeads by passage over a magnetic column, the activated T cells were cultured for 8 more days in the same media and viably frozen in CryoStor CS10 cell preservation medium (StemCell Technologies) for future use in TDCC assays.
One day prior to the T cell toxicity assay, cryopreserved expanded T cells (generated as described above) were thawed and cultured in unsupplemented X-Vivo 15 media overnight. The next day, wells of 96-well, flat-bottom plates were pre-filled with 100 μL/well of serial dilutions of test antibody (the ILT3 x CD3 engager or an isotype-matched anti-KLH control antibody) diluted in X-Vivo 15 to 2X the final concentration. A top final concentration of 2.5 μg/mL of each test article was used. Cryopreserved expanded T cells were viably thawed and resuspended to a density of 1 × 10⁶ cells/mL in X-Vivo 15 media and added to the plates at 50 μL/well. Fluorescently labeled cell lines were counted and resuspended to a density of 2 × 10⁵ cells/mL in X-Vivo 15 media and added to the plates at 50 μL/well, for a final effector:target cell ratio of 5:1. Caspase 3/7 Green Reagent (Sartorius), a caspase cleavage domain (DEVD) coupled to a green DNA-binding fluorescent label that is released upon DEVD cleavage by activated caspase 3/7, was added to the wells at a final concentration of 1:1000. The cultures were then imaged over a 24-h period using an Incucyte ZOOM live cell imager (Sartorius). The percentage of apoptotic target cells was determined by the overlap of the red and green (caspase 3/7+) signals after 12–20 h of co-culture. Data was analyzed using the Incucyte ZOOM software, version 2018A (Sartorius). Human cells from relapsed patient after CAR T cell therapy targeting BCMA are cultured with normal T cells, after co-culture the cells are stained with antibodies against CD3, CD25 and live and dead stain. By live and dead stain, the live cell population was selected, followed by selection of CD3-positive cells and finally CD25-positive cells. T cells alone, untreated cells and cells treated with ab anti-KLH were used as control.
Mouse xenograft studies
For the in vivo treatment with the ILT3xCD3 engager, 1.5x10⁶ human U266 MM cells and 7.5x10⁵ isolated human normal T-cells from healthy donors were resuspended in 200 μL PBS and injected in each mouse by tail vein injection. Mice were given the ILT3 x CD3 engager or control IgG intravenously 7 days after injection and were treated one a week for four weeks. At day 6, 20, 27 and 41 mouse peripheral blood was collected, and serum was obtained by centrifugation at 2000g for 10 min at 4°C. Human light kappa chain levels were measured by Human Lambda ELISA Kit (Bethyl cat# E88-11) following manufactory protocol.
For the treatment of the BCMA-KO model, 1.5x10⁶ human U266 BCMA-KO MM cells and 7.5x10⁵ isolated human normal T-cells from healthy donors were resuspended in 200 μL PBS and injected in each mouse by tail vein injection. Mice were given the ILT3xCD3 engager or control IgG intravenously 7 days after injection and were treated one a week for four weeks. At day 6, 20, 27 and 41 mouse peripheral blood was collected, and serum was obtained by centrifugation at 2000g for 10 min at 4°C. Human light kappa chain levels were measured by Human Kappa ELISA Kit (Bethyl cat# E88-11) following manufactory protocol.
Quantification and statistical analysis
Data are expressed as the mean ± standard deviation. For each experiment, overall significance of the differences among means was evaluated using Student’s t test. For mice experiments a sample size of n = 5 mice per group allowed us to detect a difference at 92% and a magnitude of 10% standard deviation with power = 0.80, at type I error level 0.05 using a two-sided Student’s t test. ANOVA ensure sample sizes are conservative. Tukey’s method was used to adjust for multiple comparisons within each experiment for a given outcome. Log rank (Mantel-Cox) test was used for statistical analyses of overall survival. Statistically significant difference comparing two groups are: ∗p ≤ 0.05, ∗∗p ≤ 0.01, ∗∗∗p ≤ 0.001, ∗∗∗∗p ≤ 0.0001.
Acknowledgments
We thank the Barbara Kroemer family for supporting F.D.M. We thank Jonathan Aguayo and Betty Li from NGMBio, who helped characterize the antibody. We thank Vikas Gupta and Lawrence Boise from Emory University for providing Cas9 reagents. This study used the Multiple Myeloma Research Foundation (MMRF) CoMMpass Dataset. F.P. received research grant support from the Leukemia Research Foundation, the Lonza group, and NGM Biopharmaceuticals.
Author contributions
F.D.M. generated and analyzed in vitro and in vivo data, designed the CRISPR guides, and performed all experiments with the ILT3 × CD3 antibody. J.R., A.L., and J.S. developed the ILT3 × CD3 antibody and performed in vitro killing assays. C.Y. and K.H. performed computational analyses. A.C. performed western blot and flow cytometric analyses. A.A. and H.E.B. analyzed target expression in HSCs by flow cytometry, and H.E.B. edited the manuscript. N.K., H.T., D.G.R., and S.M. helped with protein studies. S.R. helped with MS data acquisition and analysis. D.G.R. provided MM cell lines and edited the manuscript. L.P.V., M.G., and T.L. helped with data analysis and edited the manuscript. F.P. developed the idea, designed, supervised, and analyzed all data, performed proteomic studies, and wrote the manuscript.
Declaration of interests
F.P. has a patent related to this work: WO2021195536A1 - PCT/US2021/024431.
Inclusion and diversity
We support inclusive, diverse, and equitable conduct of research.
Published: July 18, 2023
Footnotes
Supplemental information can be found online at https://doi.org/10.1016/j.xcrm.2023.101110.
Supplemental information
Data and code availability
-
•
We deposited the proteomic data in the MassIVE Repository, Database: MSV000088419. The CoMMpass dataset is part of the MM Research Foundation Personalized Medicine Initiatives (https://research.themmrf.org and www.themmrf.org). Using the normalized MMRF data, differences in expression of each gene of interest were investigated. Any gene with a p value less than 0.05 was subjected to a post-hoc Dunnett’s Test where the control condition represented the normal status.
-
•
https://github.com/shawlab-moffitt/PernaLab_Surface_Protein_Annotation_Pipeline/.
-
•
Any additional information required to reanalyze the data reported in this work paper is available from the lead contact upon request.
References
- 1.Kumar S.K., Rajkumar V., Kyle R.A., van Duin M., Sonneveld P., Mateos M.V., Gay F., Anderson K.C. Multiple myeloma. Nat. Rev. Dis. Prim. 2017;3:17046. doi: 10.1038/nrdp.2017.46. [DOI] [PubMed] [Google Scholar]
- 2.Friedman K.M., Garrett T.E., Evans J.W., Horton H.M., Latimer H.J., Seidel S.L., Horvath C.J., Morgan R.A. Effective Targeting of Multiple B-Cell Maturation Antigen-Expressing Hematological Malignances by Anti-B-Cell Maturation Antigen Chimeric Antigen Receptor T Cells. Hum. Gene Ther. 2018;29:585–601. doi: 10.1089/hum.2018.001. [DOI] [PMC free article] [PubMed] [Google Scholar]
- 3.Brudno J.N., Maric I., Hartman S.D., Rose J.J., Wang M., Lam N., Stetler-Stevenson M., Salem D., Yuan C., Pavletic S., et al. T Cells Genetically Modified to Express an Anti-B-Cell Maturation Antigen Chimeric Antigen Receptor Cause Remissions of Poor-Prognosis Relapsed Multiple Myeloma. J. Clin. Oncol. 2018;36:2267–2280. doi: 10.1200/JCO.2018.77.8084. [DOI] [PMC free article] [PubMed] [Google Scholar]
- 4.Da Vià M.C., Dietrich O., Truger M., Arampatzi P., Duell J., Heidemeier A., Zhou X., Danhof S., Kraus S., Chatterjee M., et al. Homozygous BCMA gene deletion in response to anti-BCMA CAR T cells in a patient with multiple myeloma. Nat. Med. 2021;27:616–619. doi: 10.1038/s41591-021-01245-5. [DOI] [PubMed] [Google Scholar]
- 5.Coquery C.M., Erickson L.D. Regulatory roles of the tumor necrosis factor receptor BCMA. Crit. Rev. Immunol. 2012;32:287–305. doi: 10.1615/critrevimmunol.v32.i4.10. [DOI] [PMC free article] [PubMed] [Google Scholar]
- 6.Roex G., Timmers M., Wouters K., Campillo-Davo D., Flumens D., Schroyens W., Chu Y., Berneman Z.N., Lion E., Luo F., Anguille S. Safety and clinical efficacy of BCMA CAR-T-cell therapy in multiple myeloma. J. Hematol. Oncol. 2020;13:164. doi: 10.1186/s13045-020-01001-1. [DOI] [PMC free article] [PubMed] [Google Scholar]
- 7.Costa L.J., Brill I.K., Omel J., Godby K., Kumar S.K., Brown E.E. Recent trends in multiple myeloma incidence and survival by age, race, and ethnicity in the United States. Blood Adv. 2017;1:282–287. doi: 10.1182/bloodadvances.2016002493. [DOI] [PMC free article] [PubMed] [Google Scholar]
- 8.Gagelmann N., Riecken K., Wolschke C., Berger C., Ayuk F.A., Fehse B., Kröger N. Development of CAR-T cell therapies for multiple myeloma. Leukemia. 2020;34:2317–2332. doi: 10.1038/s41375-020-0930-x. [DOI] [PubMed] [Google Scholar]
- 9.Perna F. Safety Starts with Selecting the Targets. Mol. Ther. 2021;29:424–425. doi: 10.1016/j.ymthe.2021.01.011. [DOI] [PMC free article] [PubMed] [Google Scholar]
- 10.Perna F., Berman S.H., Soni R.K., Mansilla-Soto J., Eyquem J., Hamieh M., Hendrickson R.C., Brennan C.W., Sadelain M. Integrating Proteomics and Transcriptomics for Systematic Combinatorial Chimeric Antigen Receptor Therapy of AML. Cancer Cell. 2017;32:506–519.e5. doi: 10.1016/j.ccell.2017.09.004. [DOI] [PMC free article] [PubMed] [Google Scholar]
- 11.Szklarczyk D., Gable A.L., Lyon D., Junge A., Wyder S., Huerta-Cepas J., Simonovic M., Doncheva N.T., Morris J.H., Bork P., et al. STRING v11: protein-protein association networks with increased coverage, supporting functional discovery in genome-wide experimental datasets. Nucleic Acids Res. 2019;47:D607–D613. doi: 10.1093/nar/gky1131. [DOI] [PMC free article] [PubMed] [Google Scholar]
- 12.Deng M., Gui X., Kim J., Xie L., Chen W., Li Z., He L., Chen Y., Chen H., Luo W., et al. LILRB4 signalling in leukaemia cells mediates T cell suppression and tumour infiltration. Nature. 2018;562:605–609. doi: 10.1038/s41586-018-0615-z. [DOI] [PMC free article] [PubMed] [Google Scholar]
- 13.John S., Chen H., Deng M., Gui X., Wu G., Chen W., Li Z., Zhang N., An Z., Zhang C.C. A Novel Anti-LILRB4 CAR-T Cell for the Treatment of Monocytic AML. Mol. Ther. 2018;26:2487–2495. doi: 10.1016/j.ymthe.2018.08.001. [DOI] [PMC free article] [PubMed] [Google Scholar]
- 14.Dong C., Cesarano A., Bombaci G., Reiter J.L., Yu C.Y., Wang Y., Jiang Z., Zaid M.A., Huang K., Lu X., et al. Intron retention-induced neoantigen load correlates with unfavorable prognosis in multiple myeloma. Oncogene. 2021;40:6130–6138. doi: 10.1038/s41388-021-02005-y. [DOI] [PMC free article] [PubMed] [Google Scholar]
- 15.Mailankody S., Devlin S.M., Landa J., Nath K., Diamonte C., Carstens E.J., Russo D., Auclair R., Fitzgerald L., Cadzin B., et al. GPRC5D-Targeted CAR T Cells for Myeloma. N. Engl. J. Med. 2022;387:1196–1206. doi: 10.1056/NEJMoa2209900. [DOI] [PMC free article] [PubMed] [Google Scholar]
- 16.Inui M., Sugahara-Tobinai A., Fujii H., Itoh-Nakadai A., Fukuyama H., Kurosaki T., Ishii T., Harigae H., Takai T. Tolerogenic immunoreceptor ILT3/LILRB4 paradoxically marks pathogenic auto-antibody-producing plasmablasts and plasma cells in non-treated SLE. Int. Immunol. 2016;28:597–604. doi: 10.1093/intimm/dxw044. [DOI] [PubMed] [Google Scholar]
- 17.Díaz-Ramos M.C., Engel P., Bastos R. Towards a comprehensive human cell-surface immunome database. Immunol. Lett. 2011;134:183–187. doi: 10.1016/j.imlet.2010.09.016. [DOI] [PubMed] [Google Scholar]
- 18.Bausch-Fluck D., Goldmann U., Müller S., van Oostrum M., Müller M., Schubert O.T., Wollscheid B. The in silico human surfaceome. Proc. Natl. Acad. Sci. USA. 2018;115:E10988–E10997. doi: 10.1073/pnas.1808790115. [DOI] [PMC free article] [PubMed] [Google Scholar]
- 19.Town J., Pais H., Harrison S., Stead L.F., Bataille C., Bunjobpol W., Zhang J., Rabbitts T.H. Exploring the surfaceome of Ewing sarcoma identifies a new and unique therapeutic target. Proc. Natl. Acad. Sci. USA. 2016;113:3603–3608. doi: 10.1073/pnas.1521251113. [DOI] [PMC free article] [PubMed] [Google Scholar]
- 20.da Cunha J.P.C., Galante P.A.F., de Souza J.E., de Souza R.F., Carvalho P.M., Ohara D.T., Moura R.P., Oba-Shinja S.M., Marie S.K.N., Silva W.A., Jr., et al. Bioinformatics construction of the human cell surfaceome. Proc. Natl. Acad. Sci. USA. 2009;106:16752–16757. doi: 10.1073/pnas.0907939106. [DOI] [PMC free article] [PubMed] [Google Scholar]
- 21.Thul P.J., Åkesson L., Wiking M., Mahdessian D., Geladaki A., Ait Blal H., Alm T., Asplund A., Björk L., Breckels L.M., et al. A subcellular map of the human proteome. Science. 2017;356 doi: 10.1126/science.aal3321. [DOI] [PubMed] [Google Scholar]
Associated Data
This section collects any data citations, data availability statements, or supplementary materials included in this article.
Supplementary Materials
Data Availability Statement
-
•
We deposited the proteomic data in the MassIVE Repository, Database: MSV000088419. The CoMMpass dataset is part of the MM Research Foundation Personalized Medicine Initiatives (https://research.themmrf.org and www.themmrf.org). Using the normalized MMRF data, differences in expression of each gene of interest were investigated. Any gene with a p value less than 0.05 was subjected to a post-hoc Dunnett’s Test where the control condition represented the normal status.
-
•
https://github.com/shawlab-moffitt/PernaLab_Surface_Protein_Annotation_Pipeline/.
-
•
Any additional information required to reanalyze the data reported in this work paper is available from the lead contact upon request.