

Abstract
BACKGROUND:
Obesity, a multifactorial disease associated with many severe complications, affects more than 40% of adults in the United States.
OBJECTIVE:
To quantify the cost burden of 13 obesity-related complications (ORCs), overall and by body mass index (BMI) class.
METHODS:
Adult patients (aged ≥ 18 years) with ≥ 1 medical claim with an ICD-9/10 diagnosis code for the ORC of interest were identified using linked data from IQVIA’s Ambulatory Electronic Medical Records and PharMetrics Plus. Thirteen ORCs were separately assessed (asthma, dyslipidemia, gastroesophageal reflux disease [GERD], heart failure with preserved ejection fraction [HFpEF], hypertension, musculoskeletal pain, obstructive sleep apnea [OSA], osteoarthritis [OA] of the knee, polycystic ovary syndrome [PCOS], prediabetes, psoriasis, type 2 diabetes mellitus [T2DM], and urinary incontinence); ORC cohorts were not mutually exclusive. For each ORC, the first claim identified for the ORC from January 2010-December 2016 was termed the index date. Patients had continuous enrollment in the 1-year pre-index (without a diagnosis code of the specific ORC under study) and the 1-year post-index, with ≥ 1 BMI value in the 6-months pre-index. Patients with underweight (BMI < 18.5 kg/m2) and those with cancer or pregnancy were excluded. Complication-specific costs were identified as claims with a diagnosis code for the ORC (primary position only for hospitalizations) or ORC-specific medications or procedures. Baseline demographic/clinical characteristics and complication-specific costs over the 1-year follow-up were assessed for each ORC cohort, overall and by BMI class (18.5-24.9; 25.0-29.9; 30.0-34.9; 35.0-39.9; ≥ 40 kg/m2). The association between total complication-specific costs and BMI class was assessed by generalized linear regression model for each ORC, adjusting for baseline characteristics.
RESULTS:
The total number of patients that comprised the ORC cohorts ranged from 1,275 (HFpEF) to 101,784 (musculoskeletal pain). Across ORC cohorts, 41.6% (musculoskeletal pain) to 73.5% (OSA) had obesity (BMI ≥ 30 kg/m2). For 4 ORC cohorts, more than one fifth of patients had class III obesity (BMI ≥ 40 kg/m2): T2DM, OSA, PCOS, and HFpEF. Baseline mean Charlson Comorbidity Index score increased with increasing BMI class for most ORC cohorts. The most costly ORCs overall based on mean total 1-year cost were: OA of the knee ($3,697 [range from normal weight (BMI: 18.5-24.9 kg/m2) to class III obesity: $2,453-$4,518]), HFpEF ($3,586 [range: $3,402-$4,685]), OSA ($2,768 [$2,442-$2,974]), and psoriasis ($2,711 [$2,131-$3,292]). The highest cost differences (≥20%) were observed among those with class III obesity versus those with normal weight for these aforementioned ORCs, as well as for GERD ($1,719 [$1,484-$1,893]) and asthma ($1,531 [$1,361-$1,780]). Following adjustment, most cost comparisons by BMI class were significantly higher versus those for normal weight for 6 ORCs.
CONCLUSIONS:
ORCs are important drivers of the economic burden of obesity, indicating an unmet need for the treatment of obesity. Appropriate weight management may reduce ORC-associated costs.
What is already known about this subject
Several studies have shown obesity to be associated with an increased risk of disease progression and obesity-related complications (ORCs) including, but not limited to, cardiovascular disease, type 2 diabetes mellitus, arthritis, and all-cause and cardiovascular mortality.
A meta-analysis based on 12 studies published between 2008 and 2012 found annual per-person medical care costs attributable to obesity to be $1,901 ($1,239-$2,582) in 2014 U.S. dollars, which the authors translated to an annual total direct medical cost of $149.4 billion at the national level.
A study using data from the Geisinger Health System from 2004-2013 evaluated the costs of 21 chronic conditions with established association with obesity and found the per-person annual incremental costs of a single ORC ranged from $120 for angina to $1,665 for pulmonary embolism.
What this study adds
This study quantified the complication-specific costs associated with 13 ORCs by body mass index (BMI) class and provides insights into the economic burden associated with ORCs.
Following adjustment, our findings demonstrated significantly higher total complication-specific costs among those with higher versus lower BMI class for several ORCs; the highest adjusted cost ratio was observed for osteoarthritis of the knee, where class III obesity was associated with 85% higher costs compared with normal weight.
The results from our study suggest a substantial unmet need associated with these ORCs and highlight the importance of appropriate weight management.
Obesity is a multifactorial disease that affects more than 40% of adults (42.4% in 2017-2018) in the United States.1 Due to its association with several obesity-related complications (ORCs) such as hypertension, dyslipidemia, type 2 diabetes mellitus (T2DM), sleep apnea, osteoarthritis (OA), and some respiratory problems, as well as an elevated risk for disease progression and mortality, obesity poses a substantial public health and economic burden.2 In 2016, the total cost of chronic diseases attributable to obesity and overweight was $1.72 trillion (in 2016 U.S. dollars [USD]) or 9.3% of the U.S. gross domestic product, including $480.7 billion in direct health care costs and $1.24 trillion in indirect costs due to lost economic productivity.3 As a risk factor, obesity accounts for 47.1% of the total direct and indirect costs of chronic diseases nationwide.
Several studies have evaluated the health care costs associated with obesity in the general population. A metaanalysis based on 12 studies published between 2008 and 2012 found annual per-person medical care costs attributable to obesity to be $1,901 ($1,239-$2,582) in 2014 USD.4 These costs totaled $149.4 billion at the national level. Another study used instrumental variable models to estimate the causal effect of obesity and reported obesity raised annual medical care costs per person by $3,429 in 2013 USD, including $3,210 paid by a third-party payer, based on an analysis of data from the Medical Expenditure Panel Survey.5
The association between overweight and/or obesity and disease severity and progression has been widely studied for several ORCs. For example, studies among patients with prediabetes and diabetes have shown an increased risk of glycemic stage progression and diabetic neuropathy among patients with higher versus lower body mass index (BMI) class, respectively.6,7 Among patients with OA of the knee, patients with obesity have been found to be at more than a 2-fold increased risk for arthroplasty compared with patients without obesity.8
A recent systematic literature review weighed the evidence associated with ORCs.9 The strength of evidence of the association between obesity and each ORC was strongest for cardiovascular disorders, cancers, selected infections, and obstetric conditions. A study using data from the Geisinger Health System from 2004-2013 evaluated the costs of 21 chronic conditions with established association with obesity.10 The per-person annual incremental costs of a single ORC ranged from $120 for angina to $1,665 for pulmonary embolism.
The primary objective of our study was to quantify the complication-specific direct cost burden of 13 ORCs, overall and by BMI class: asthma, dyslipidemia, gastroesophageal reflux disease (GERD), heart failure with preserved ejection fraction (HFpEF), hypertension, musculoskeletal pain, obstructive sleep apnea (OSA), OA of the knee, polycystic ovary syndrome (PCOS), prediabetes, psoriasis, T2DM, and urinary incontinence. PCOS and urinary incontinence were only assessed among women. These ORCs were identified based on a review of the literature of conditions with established association with obesity.6-12 Furthermore, weight management may be considered a relevant intervention for these conditions.
In this study, we report on 13 ORC study cohorts comprising adult patients with an incident diagnosis code for the ORC of interest. Patients were categorized based on baseline BMI class. Baseline characteristics were described and complication-specific costs were assessed over the 1-year follow-up, overall and by BMI class.
Methods
DATA SOURCE
This observational retrospective cohort study utilized linked data from IQVIA’s PharMetrics Plus and Ambulatory Electronic Medical Records Database (AEMR) from January 1, 2009, to December 31, 2017.
PharMetrics Plus comprises longitudinal, adjudicated administrative claims data for more than 190 million unique health plan members across the United States (approximately 150 million at the time of the study).13 Data include inpatient and outpatient diagnoses and procedures, retail and mail order prescription records, pharmacy and medical benefit information, inpatient stay and provider details, demographic variables, product type, payer type, health plan enrollment dates, and payments.
IQVIA’s AEMR comprises records for approximately 74 million patients in the United States (approximately 50 million at the time of the study).14 Records are collected from 40,000 physicians from large practices and physician networks; approximately half of contributing physicians are primary care while the other half are specialists. Key information captured includes clinical details and lab tests and results/values. All data from these databases are compliant with the Health Insurance Portability and Accountability Act to protect the patient’s privacy.
AEMR was utilized to assess baseline BMI values and categorize patients by BMI class. PharMetrics Plus was used to describe baseline patient demographic and clinical characteristics for the 13 ORC cohorts, and measure complication-specific costs of each ORC by BMI class over the 1-year follow-up.
This study was not considered to be human subject research because it was a retrospective analysis of secondary deidentified data; therefore, ethics approval was not obtained.15,16 The Office for Human Research Protection under the U.S. Department of Health & Human Services does not consider research involving fully deidentified or fully anonymized information to involve human subjects (i.e., Human Subjects Research).
SAMPLE SELECTION
A base population was identified with available BMI in AEMR and linkage to PharMetrics Plus. Patients were then evaluated for inclusion in each of the 13 ORC study cohorts if they had ≥ 1 medical claim with an International Classification of Diseases, Ninth/Tenth Revision, Clinical Modification (ICD-9/10-CM) diagnosis code for the ORC of interest (Supplementary Table 1, available in online article) between January 1, 2010, and December 31, 2016 (“selection window”). Note that for the dyslipidemia cohort, only an ICD-10-CM diagnosis code was considered for the identification of dyslipidemia, as ICD-9-CM codes were not considered specific enough. Therefore, a selection window of October 1, 2015, to December 31, 2016, was used for this dyslipidemia cohort (reflecting the date of introduction of ICD-10-CM diagnosis codes in the United States). For each ORC cohort, the date of the first ORC diagnosis code during the selection window was termed the “index date.” Patients were required to be aged ≥ 18 years of age at index date and have continuous enrollment (CE) in the health plan ≥ 360 days before and following the index date. Patients had a fixed 1-year pre-index or baseline period and a fixed 1-year post-index or follow-up period in order to assess baseline patient characteristics and complication-specific costs, respectively. Additionally, patients were required to have ≥ 1 BMI value in AEMR in the 6 months before or on the index date.
In order to identify patients with incident ORCs, patients with ≥ 1 diagnosis code for the ORC of interest in the 1-year pre-index period were excluded (applicable only for patients identified in 2010). Patients with underweight (BMI < 18.5 kg/m2) in the 1-year pre-index period or who had a pregnancy or cancer diagnosis code (except nonmelanoma skin cancer) in the 1-year pre-index period were excluded. Males were not considered for the PCOS and urinary incontinence cohorts. Finally, patients with incomplete data (e.g., invalid demographic or enrollment data, enrollment in a Medicare cost or State Children’s Health Insurance Program plan [due to incomplete coverage]) were excluded.
The 13 ORC cohorts were not required to be mutually exclusive, as patients could have 1 or more ORCs of interest.
PATIENT BASELINE CHARACTERISTICS AND COMPLICATION-SPECIFIC COSTS
For each ORC cohort, patients were categorized by BMI class based on their BMI value closest to (before) or on the index date (normal weight [BMI: 18.5-24.9 kg/m2], overweight [BMI: 25.0-29.9 kg/m2], class I obesity [BMI: 30.0-34.9 kg/m2], class II obesity [BMI: 35.0-39.9 kg/m2], class III obesity [BMI ≥ 40]). Demographic characteristics were measured as of the index date and clinical characteristics (e.g., Charlson Comorbidity Index score [CCI; Dartmouth-Manitoba version], comorbidities of interest, all-cause health care costs) were measured over the 1-year pre-index period, overall and by BMI class.
Complication-specific costs were measured and reported over the 1-year follow-up period (inclusive of the index date) for each ORC cohort, overall and by BMI class. Claims with a complication-specific diagnosis code (inpatient claims with diagnosis code in the primary discharge position, outpatient claims with diagnosis code in any position) or complication-specific medications and procedures were included in the cost calculation (Supplementary Table 1, available in online article). Outpatient claims were not limited to the primary diagnosis position as this was considered to potentially be too restrictive. According to clinical coding guidelines, in the outpatient setting, documented conditions that coexist at the time of the encounter/visit should be coded if they require or affect patient care treatment and management.17 We therefore considered diagnosis codes in secondary positions to have relevance. Allowed direct health care costs were measured and converted to 2017 USD using the medical component of the Consumer Price Index. Costs were assessed overall and for the following mutually exclusive health care categories: outpatient pharmacy, inpatient hospitalizations, and outpatient medical care.
Complication-specific costs were also assessed over the 2- and 3-year follow-up periods, among the subgroups with CE over the respective time periods: (index date + 720), and (index date + 1,080), respectively.
ANALYSES
Descriptive statistics were used to describe frequency and percentage distributions for categorical variables. Continuous variables were described using mean, standard deviation and median. Baseline characteristics and unadjusted 1-year complication-specific costs were compared by BMI class with normal weight as reference. Pairwise comparisons were made using the parametric t-test on the mean for continuous variables and the chi-square test for categorical variables. The association between 1-year total complication-specific costs and BMI class (reference: normal weight) were assessed by a generalized linear regression model (GLM) for each ORC, adjusting for age group, gender, region, payer type, index year, and baseline CCI score. A P value < 0.05 was considered statistically significant. No adjustment was made for multiple comparisons. We were not interested in a universal null hypothesis across all comparisons; any adjustment would be at the expense of type II error where we may fail to detect truly important differences in the observed data, and there was an a priori hypothesis (increasing complication-specific costs with increasing BMI).18,19
Results
ORC COHORTS
The total number of patients that comprised the ORC study cohorts overall ranged from 1,275 (HFpEF) and 2,260 (PCOS) to 50,962 (GERD) and 101,784 (musculoskeletal pain) (Supplementary Figure 1, available in online article). Across all ORC cohorts, 41.6% (musculoskeletal pain) to 73.5% (OSA) had obesity (BMI ≥ 30 kg/m2) at baseline. For 8 out of 13 ORC cohorts, more than half (50%) of patients had obesity, while for the remaining 5 cohorts (musculoskeletal pain, GERD, asthma, psoriasis, urinary incontinence), 41.6% to 47.9% had obesity. For 4 ORC cohorts, more than one fifth (20%) of patients had class III obesity (BMI ≥ 40 kg/m2): T2DM, OSA, PCOS, and HFpEF.
BASELINE CHARACTERISTICS OF THE ORC COHORTS, OVERALL AND BY BMI CLASS
Table 1 and Supplementary Table 2 (available in online article) represent baseline characteristics of the ORC study cohorts, overall and by BMI class. Mean patient age at index was upper 40s to lower 50s (years) for most complications/BMI cohorts. Exceptions included HFpEF (age range: 56.3-62.3 years), PCOS (29.5-33.2 years), asthma (38.5-46.8 years), and musculoskeletal pain (41.3-47.6 years). Across complications, mean age tended to increase from normal weight to overweight but decreased from overweight to class III obesity. For almost all complications, more than half of patients that were normal weight or with class III obesity were female, while more than half of patients with overweight or with class I obesity were male. For the most part, the mean CCI score within each complication cohort followed an upward trend from normal weight to class III obesity. There were a few exceptions; mean CCI score was highest for normal weight for the T2DM cohort, and a slight decrease was observed from normal weight to overweight for the prediabetes cohort. For all complications/BMI cohorts, mean CCI score was below 1.2 except for the HFpEF cohort (CCI range: 2.6 to 2.8). All complications/BMI cohorts had mean all-cause 1-year pre-index costs below $15,000 except for the HFpEF cohort (all-cause 1-year pre-index costs range: $32,945-$63,329). For most complications, mean cost increased from overweight to class III obesity, while a decrease was observed from normal weight to overweight.
TABLE 1.
Baseline Characteristics of Patients with the 13 Obesity-Related Complications of Interest, by Body Mass Index Class
| Characteristic | Baseline BMI (kg/m2)a | |||||||||
|---|---|---|---|---|---|---|---|---|---|---|
| 18.5-24.9 | 25.0-29.9 | 30.0-34.9 | 35.0-39.9 | ≥ 40 | ||||||
| OSA patients, n | 688 | 2,373 | 3,115 | 2,514 | 2,876 | |||||
| Age in years (mean, SD) | 48.0 | 13.3 | 50.8b | 10.7 | 50.7b | 10.2 | 50.3b | 9.9 | 49.1c | 10.1 |
| Female (n, %) | 345 | 50.1 | 703 | 29.6b | 837 | 26.9b | 906 | 36.0b | 1,399 | 48.6 |
| CCI score (mean, SD) | 0.6 | 1.1 | 0.6 | 1.1 | 0.8c | 1.3 | 0.8d | 1.2 | 1.0b | 1.2 |
| Total baseline health care costs ($; mean, SD) | 13,709 | 46,502 | 11,687 | 39,770 | 12,122 | 34,052 | 12,372 | 28,747 | 12,866 | 27,822 |
| PCOSe patients, n | 382 | 413 | 454 | 419 | 592 | |||||
| Age in years (mean, SD) | 29.5 | 8.4 | 31.5d | 8.9 | 33.0b | 9.2 | 32.5b | 9.3 | 33.2b | 8.7 |
| Female (n, %) | 382 | 100.0 | 413 | 100.0 | 454 | 100.0 | 419 | 100.0 | 592 | 100.0 |
| CCI score (mean, SD) | 0.1 | 0.4 | 0.2c | 0.5 | 0.3b | 0.6 | 0.4b | 0.8 | 0.4b | 0.7 |
| Total baseline health care costs ($; mean, SD) | 5,948 | 23,386 | 4,962 | 7,634 | 6,293 | 11,766 | 6,868 | 15,340 | 8,717 | 36,941 |
| HFpEF patients, n | 165 | 265 | 307 | 216 | 322 | |||||
| Age in years (mean, SD) | 62.3 | 14.0 | 61.5 | 10.9 | 59.9c | 9.6 | 57.9d | 8.6 | 56.3b | 7.3 |
| Female (n, %) | 103 | 62.4 | 127 | 47.9b | 126 | 41.0b | 91 | 42.1b | 156 | 48.4d |
| CCI score (mean, SD) | 2.6 | 2.2 | 2.6 | 2.1 | 2.6 | 2.2 | 2.7 | 2.2 | 2.8 | 2.0 |
| Total baseline health care costs ($; mean, SD) | 63,329 | 168,691 | 39,020c | 58,092 | 32,945c | 47,453 | 45,018 | 78,396 | 39,542c | 73,351 |
| Urinary incontinencee patients, n | 1,655 | 2,003 | 1,410 | 905 | 792 | |||||
| Age in years (mean, SD) | 49.5 | 11.0 | 51.6b | 10.1 | 51.2b | 9.6 | 51.1d | 9.3 | 49.6 | 9.8 |
| CCI score (mean, SD) | 0.3 | 0.8 | 0.4b | 0.9 | 0.5b | 1.0 | 0.7b | 1.1 | 0.9b | 1.2 |
| Total baseline health care costs ($; mean, SD) | 7,962 | 15,075 | 8,905 | 14,836 | 11,444b | 26,048 | 11,832b | 17,704 | 12,947b | 23,613 |
| OA of knee patients, n | 1,761 | 4,235 | 4,304 | 2,776 | 2,795 | |||||
| Age in years (mean, SD) | 53.6 | 10.4 | 55.0b | 9.0 | 54.8b | 8.1 | 54.4d | 8.0 | 52.9c | 8.1 |
| Female (n, %) | 1,242 | 70.5 | 2,095 | 49.5b | 2,095 | 48.7b | 1,590 | 57.3b | 1,865 | 66.7d |
| CCI score (mean, SD) | 0.4 | 0.9 | 0.5 | 0.9 | 0.6b | 1.0 | 0.7b | 1.1 | 0.9b | 1.2 |
| Total baseline health care costs ($; mean, SD) | 10,991 | 32,056 | 9,733 | 24,777 | 9,613c | 16,197 | 11,302 | 25,204 | 11,415 | 21,776 |
| T2DM patients, n | 1,120 | 2,994 | 3,715 | 2,802 | 2,947 | |||||
| Age in years (mean, SD) | 48.5 | 14.2 | 52.3b | 10.4 | 52.1b | 9.3 | 50.9b | 9.5 | 48.7 | 9.8 |
| Female (n, %) | 629 | 56.2 | 1,223 | 40.8b | 1,517 | 40.8b | 1,287 | 45.9b | 1,671 | 56.7 |
| CCI score (mean, SD) | 0.7 | 1.2 | 0.5b | 1.0 | 0.4b | 0.9 | 0.4b | 0.8 | 0.4b | 0.8 |
| Total baseline health care costs ($; mean, SD) | 14,759 | 46,002 | 10,964c | 43,334 | 9,124b | 27,835 | 9,197b | 28,711 | 9,832b | 24,018 |
| Prediabetes patients, n | 2,277 | 5,726 | 5,631 | 3,541 | 3,128 | |||||
| Age in years (mean, SD) | 50.8 | 12.1 | 52.3b | 9.9 | 51.7d | 9.5 | 50.1d | 9.9 | 47.9b | 10.3 |
| Female (n, %) | 1,350 | 59.3 | 2,318 | 40.5b | 2,374 | 42.2b | 1,755 | 49.6b | 1,903 | 60.8 |
| CCI score (mean, SD) | 0.5 | 1.1 | 0.4c | 0.9 | 0.5 | 1.0 | 0.5 | 1.0 | 0.6 | 1.0 |
| Total baseline health care costs ($; mean, SD) | 12,440 | 58,886 | 9,109d | 26,627 | 9,176d | 29,866 | 9,930c | 30,391 | 9,681c | 27,281 |
| Asthma patients, n | 5,671 | 6,793 | 5,042 | 3,015 | 2,763 | |||||
| Age in years (mean, SD) | 38.5 | 14.8 | 44.6b | 13.3 | 46.6b | 12.4 | 46.8b | 11.8 | 46.2b | 11.5 |
| Female (n, %) | 4,029 | 71.0 | 3,681 | 54.2b | 2,785 | 55.2b | 1,898 | 63.0b | 1,943 | 70.3 |
| CCI score (mean, SD) | 0.2 | 0.7 | 0.3b | 0.8 | 0.4b | 1.0 | 0.5b | 1.0 | 0.6b | 1.1 |
| Total baseline health care costs ($; mean, SD) | 6,888 | 22,782 | 7,105 | 16,722 | 8,880b | 25,497 | 9,294b | 22,021 | 10,543b | 26,434 |
| Psoriasis patients, n | 1,009 | 1,410 | 1,151 | 573 | 440 | |||||
| Age in years (mean, SD) | 44.0 | 13.6 | 48.5b | 11.3 | 49.3b | 11.1 | 49.0b | 11.0 | 48.7b | 10.9 |
| Female (n, %) | 696 | 69.0 | 626 | 44.4b | 536 | 46.6b | 317 | 55.3b | 300 | 68.2 |
| CCI score (mean, SD) | 0.3 | 0.7 | 0.4c | 0.9 | 0.5b | 0.9 | 0.6b | 1.0 | 0.7b | 1.1 |
| Total baseline health care costs ($; mean, SD) | 7,224 | 19,435 | 8,117 | 23,472 | 8,022 | 14,522 | 9,919c | 16,927 | 10,899d | 19,536 |
| GERD patients, n | 10,271 | 16,258 | 12,505 | 6,714 | 5,215 | |||||
| Age in years (mean, SD) | 44.7 | 14.2 | 48.6b | 11.9 | 49.3b | 10.9 | 48.7b | 10.8 | 47.1b | 10.9 |
| Female (n, %) | 7,066 | 68.8 | 7,776 | 47.8b | 6,062 | 48.5b | 3,928 | 58.5b | 3,579 | 68.6 |
| CCI score (mean, SD) | 0.4 | 0.9 | 0.4b | 0.9 | 0.5b | 1.0 | 0.7b | 1.1 | 0.8b | 1.2 |
| Total baseline health care costs ($; mean, SD) | 9,228 | 35,524 | 8,416c | 24,887 | 9,330 | 25,604 | 10,424c | 27,667 | 11,613b | 26,407 |
| Hypertension patients, n | 6,863 | 15,637 | 13,635 | 7,467 | 6,081 | |||||
| Age in years (mean, SD) | 50.9 | 11.8 | 51.2c | 10.1 | 50.2b | 9.8 | 48.9b | 10.1 | 46.8b | 10.5 |
| Female (n, %) | 4,222 | 61.5 | 6,218 | 39.8b | 5,303 | 38.9b | 3,628 | 48.6b | 3,621 | 59.5c |
| CCI score (mean, SD) | 0.4 | 0.9 | 0.4b | 0.8 | 0.4d | 0.8 | 0.4 | 0.8 | 0.4 | 0.8 |
| Total baseline health care costs ($; mean, SD) | 9,480 | 35,778 | 6,871b | 27,082 | 6,148b | 16,404 | 6,242b | 16,878 | 6,296b | 17,537 |
| Dyslipidemiaf patients, n | 3,169 | 8,557 | 7,911 | 4,251 | 3,267 | |||||
| Age in years (mean, SD) | 53.7 | 9.7 | 53.6 | 8.6 | 53.4 | 8.6 | 52.6b | 8.8 | 51.3b | 9.2 |
| Female (n, %) | 1,798 | 56.7 | 3,224 | 37.7b | 2,937 | 37.1b | 1,829 | 43.0b | 1,767 | 54.1c |
| CCI (mean, SD) | 0.6 | 1.1 | 0.6 | 1.1 | 0.7b | 1.2 | 0.9b | 1.2 | 1.1b | 1.4 |
| Total baseline health care costs ($; mean, SD) | 9,823 | 38,727 | 8,971 | 24,808 | 10,135 | 27,955 | 10,796 | 23,862 | 12,674d | 27,117 |
| Musculoskeletal pain patients, n | 25,958 | 33,510 | 22,858 | 11,147 | 8,311 | |||||
| Age in years (mean, SD) | 41.3 | 14.3 | 46.3b | 12.5 | 47.6b | 11.6 | 47.3b | 11.3 | 46.6b | 11.3 |
| Female (n, %) | 17,924 | 69.1 | 15,819 | 47.2b | 10,354 | 45.3b | 6,040 | 54.2b | 5,194 | 62.5b |
| CCI score (mean, SD) | 0.2 | 0.6 | 0.3b | 0.7 | 0.4b | 0.8 | 0.5b | 0.9 | 0.6b | 1.0 |
| Total baseline health care costs ($; mean, SD) | 4,942 | 16,662 | 5,136 | 17,239 | 5,609b | 19,376 | 6,070b | 16,687 | 6,807b | 14,580 |
Note: Pairwise comparisons (reference: BMI 18.5-24.9 kg/m2) were made using the parametric t-test on the mean for continuous variables and the chi-square test for categorical variables. Total baseline health care costs are reported in U.S. dollars.
aBMI value closest to (before) or on the index date.
bP < 0.0001 for pairwise comparisons with normal weight as reference.
cP < 0.05.
dP < 0.01.
eIncludes only females.
fIncludes only patients identified using ICD-10-CM codes between October 1, 2015, and December 31, 2016.
BMI = body mass index; CCI = Charlson Comorbidity Index; GERD = gastroesophageal reflux disease; HFpEF = heart failure with preserved ejection fraction; ICD-10-CM = International Classification of Diseases, Tenth Revision, Clinical Modification; OA = osteoarthritis; OSA = obstructive sleep apnea; PCOS = polycystic ovarian syndrome; SD = standard deviation; T2DM = type 2 diabetes mellitus.
MEAN TOTAL 1-YEAR COMPLICATION-SPECIFIC COSTS, OVERALL AND BY BMI CLASS
Mean total 1-year complication-specific costs by BMI class for each of the 13 ORC cohorts can be found in Table 2 and Figures 1a and 1b. The most costly ORCs based on mean total 1-year cost overall were OA of the knee ($3,697 [range from normal weight to class III obesity: $2,453-$4,518]), HFpEF ($3,586 [range: $3,402-$4,685]), OSA ($2,768 [range: $2,442-$2,974]), and psoriasis ($2,711 [range: $2,131-$3,292]). Substantially higher cost differences (≥ 20%) were observed among those with class III obesity versus those with normal weight for these aforementioned ORCs, as well as for GERD ($1,719 [range: $1,484-$1,893]) and asthma ($1,531 [range: $1,361-$1,780]). Across overall cohorts, the majority of costs were driven by outpatient medical care (70.9%-97.7%), with the exception of HFpEF (62.3% inpatient), OA of the knee (61.3% inpatient), and psoriasis (67.6% pharmacy; Supplementary Table 3, available in online article).
TABLE 2.
One-Year Complication-Specific Total Health Care Costs for the 13 Obesity-Related Complications
| Complication-Specific Total Cost (2017 USD) | Overall | Baseline BMI (kg/m2) | P Value | |||||||
|---|---|---|---|---|---|---|---|---|---|---|
| 18.5-24.9 | 25.0-29.9 | 30.0-34.9 | 35.0-39.9 | ≥ 40 | ||||||
| A | B | C | D | E | A×B | A×C | A×D | A×E | ||
| OSA (n = 11,566) | ||||||||||
| Mean | 2,768 | 2,442 | 2,427 | 2,748 | 2,968 | 2,974 | 0.942 | 0.174 | 0.053 | 0.025 |
| SD | 5,377 | 6,224 | 4,049 | 5,129 | 6,355 | 5,435 | ||||
| Median | 1,422 | 995 | 1,201 | 1,526 | 1,493 | 1,579 | 0.071 | 0.000 | 0.001 | 0.000 |
| PCOS (n = 2,260) | ||||||||||
| Mean | 1,139 | 1,266 | 1,131 | 1,104 | 1,114 | 1,108 | 0.524 | 0.400 | 0.444 | 0.386 |
| SD | 2,613 | 3,216 | 2,745 | 2,328 | 2,367 | 2,458 | ||||
| Median | 490 | 545 | 494 | 494 | 453 | 461 | 0.454 | 0.743 | 0.163 | 0.177 |
| HFpEF (n = 1,275) | ||||||||||
| Mean | 3,586 | 3,402 | 3,341 | 2,855 | 3,425 | 4,685 | 0.964 | 0.548 | 0.983 | 0.274 |
| SD | 10,934 | 12,655 | 14,009 | 7,101 | 7,473 | 11,998 | ||||
| Median | 347 | 290 | 296 | 364 | 348 | 466 | 0.281 | 0.025 | 0.025 | 0.003 |
| Urinary incontinence (n = 6,765) | ||||||||||
| Mean | 2,456 | 2,263 | 2,620 | 2,794 | 2,399 | 1,905 | 0.055 | 0.012 | 0.525 | 0.096 |
| SD | 5,514 | 5,349 | 5,806 | 6,307 | 4,818 | 4,094 | ||||
| Median | 385 | 339 | 404 | 405 | 416 | 322 | 0.033 | 0.010 | 0.077 | 0.263 |
| OA of the knee (n = 15,871) | ||||||||||
| Mean | 3,697 | 2,453 | 3,277 | 3,719 | 4,264 | 4,518 | 0.001 | < 0.0001 | < 0.0001 | < 0.0001 |
| SD | 10,130 | 7,677 | 8,870 | 9,815 | 11,800 | 11,731 | ||||
| Median | 541 | 401 | 483 | 537 | 655 | 673 | < 0.0001 | < 0.0001 | < 0.0001 | < 0.0001 |
| T2DM (n = 13,578) | ||||||||||
| Mean | 2,400 | 2,731 | 2,447 | 2,312 | 2,337 | 2,398 | 0.197 | 0.070 | 0.060 | 0.071 |
| SD | 6,007 | 6,494 | 6,179 | 6,842 | 5,658 | 4,688 | ||||
| Median | 742 | 728 | 703 | 707 | 760 | 832 | 0.882 | 0.437 | 0.426 | 0.113 |
| Prediabetes (n = 20,303) | ||||||||||
| Mean | 437 | 400 | 408 | 441 | 468 | 474 | 0.822 | 0.258 | 0.108 | 0.009 |
| SD | 1,535 | 996 | 1,603 | 1,642 | 1,856 | 1,054 | ||||
| Median | 222 | 200 | 215 | 226 | 230 | 241 | 0.000 | < 0.0001 | < 0.0001 | < 0.0001 |
| Asthma (n = 23,284) | ||||||||||
| Mean | 1,531 | 1,361 | 1,443 | 1,551 | 1,787 | 1,780 | 0.171 | 0.003 | < 0.0001 | < 0.0001 |
| SD | 3,576 | 3,341 | 3,361 | 3,216 | 4,716 | 3,707 | ||||
| Median | 430 | 385 | 432 | 444 | 445 | 496 | 0.001 | < 0.0001 | < 0.0001 | < 0.0001 |
| Psoriasis (n = 4,583) | ||||||||||
| Mean | 2,711 | 2,131 | 2,976 | 2,664 | 2,723 | 3,292 | 0.015 | 0.100 | 0.142 | 0.018 |
| SD | 8,753 | 6,861 | 9,359 | 8,033 | 8,974 | 11,625 | ||||
| Median | 344 | 306 | 331 | 383 | 364 | 404 | 0.005 | < 0.0001 | 0.019 | 0.000 |
| GERD (n = 50,962) | ||||||||||
| Mean | 1,719 | 1,484 | 1,662 | 1,834 | 1,868 | 1,893 | 0.000 | < 0.0001 | < 0.0001 | < 0.0001 |
| SD | 3,984 | 3,004 | 3,989 | 4,444 | 4,244 | 4,124 | ||||
| Median | 424 | 400 | 415 | 434 | 430 | 483 | 0.019 | < 0.0001 | 0.001 | < 0.0001 |
| Hypertension (n = 49,683) | ||||||||||
| Mean | 1,666 | 1,553 | 1,585 | 1,738 | 1,715 | 1,775 | 0.664 | 0.016 | 0.047 | 0.008 |
| SD | 5,030 | 4,986 | 5,130 | 5,302 | 4,775 | 4,467 | ||||
| Median | 515 | 449 | 493 | 533 | 536 | 585 | < 0.0001 | < 0.0001 | < 0.0001 | < 0.0001 |
| Dyslipidemia (n = 27,155)a | ||||||||||
| Mean | 1,625 | 1,329 | 1,596 | 1,747 | 1,714 | 1,576 | 0.024 | 0.000 | 0.000 | 0.036 |
| SD | 5,520 | 4,549 | 6,059 | 5,944 | 4,596 | 4,888 | ||||
| Median | 399 | 329 | 376 | 419 | 442 | 446 | < 0.0001 | < 0.0001 | < 0.0001 | < 0.0001 |
| Musculoskeletal pain (n = 101,784) | ||||||||||
| Mean | 1,046 | 992 | 1,024 | 1,064 | 1,128 | 1,144 | 0.057 | 0.000 | < 0.0001 | < 0.0001 |
| SD | 2,224 | 1,999 | 2,160 | 2,150 | 2,663 | 2,655 | ||||
| Median | 394 | 376 | 382 | 399 | 433 | 452 | 0.158 | < 0.0001 | < 0.0001 | < 0.0001 |
a Includes only patients identified using ICD-10-CM codes between October 1, 2015, and December 31, 2016.
BMI = body mass index; GERD = gastroesophageal reflux disease; HFpEF = heart failure with ejection fraction; ICD-10-CM = International Classification of Diseases, Tenth Revision, Clinical Modification; OA = osteoarthritis; OSA = obstructive sleep apnea; PCOS = polycystic ovarian syndrome; T2DM = type 2 diabetes mellitus; USD = U.S. dollars.
FIGURE 1.
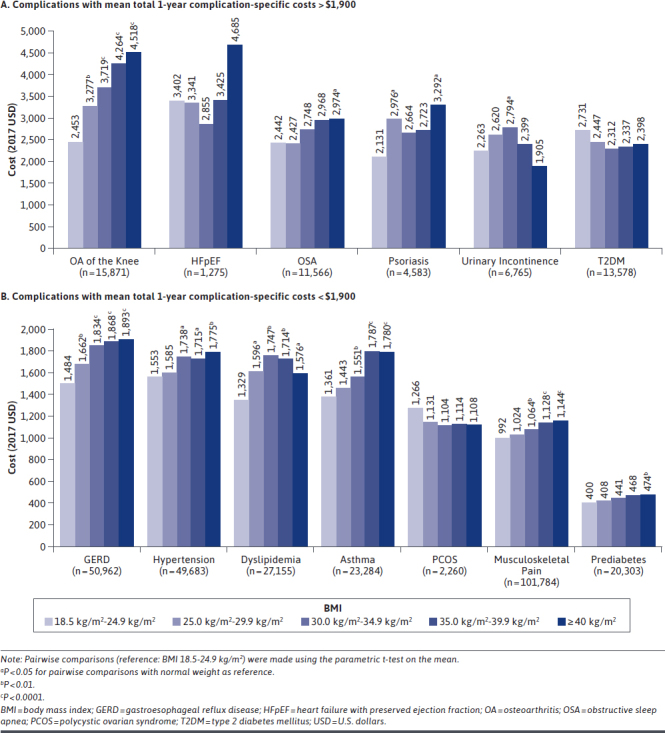
Mean Total 1-Year Complication-Specific Costs for Patients with Obesity-Related Complications, by Body Mass Index Class
A clear upward trend in total complication-specific costs from normal weight to class III obesity was observed for 4 out of 13 ORCs: OA of the knee, GERD, musculoskeletal pain, and prediabetes. General upward trends were also observed for another 3 out of 13 ORCs: OSA, hypertension, and asthma.
Following adjustment for baseline confounders in the GLMs, most cost comparisons by BMI class versus normal weight were significantly higher for 6 out of 13 ORCs: OA of the knee, GERD, musculoskeletal pain, hypertension, dyslipidemia, and prediabetes (Table 3). Significantly higher costs were also observed for patients with class II and class III obesity versus those with normal weight for OSA and asthma. For psoriasis, patients with overweight or with class III obesity had significantly higher costs versus patients with normal weight. For PCOS and T2DM cohorts, the highest mean 1-year costs were observed for patients with normal weight; however, BMI class comparisons versus normal weight were not significant. No significant differences were observed for patients with HFpEF. For urinary incontinence, highest mean 1-year cost was observed for class I obesity, and only the overweight and class I obesity versus normal weight comparisons were significantly higher, while the class III obesity versus normal weight comparison was significantly lower.
TABLE 3.
Adjusted Cost Ratios from Generalized Linear Regression Models for the Association Between BMI Class and 1-Year Complication-Specific Total Health Care Costs
| BMI Category (reference: 18.5-24.9 kg/m2) | Adjusted Cost Ratio | 95% LCL | 95% UCL | P Value | ||||
|---|---|---|---|---|---|---|---|---|
| OSA, n = 11,566 | ||||||||
| 25.0-29.9 | 0.982 | 0.841 | 1.147 | 0.818 | ||||
| 30.0-34.9 | 1.097 | 0.943 | 1.277 | 0.228 | ||||
| 35.0-39.9 | 1.195 | 1.025 | 1.394 | 0.023 | ||||
| ≥ 40.0 | 1.235 | 1.062 | 1.437 | 0.006 | ||||
| PCOS, n = 2,260 | ||||||||
| 25.0-29.9 | 0.892 | 0.746 | 1.068 | 0.214 | ||||
| 30.0-34.9 | 0.853 | 0.712 | 1.022 | 0.085 | ||||
| 35.0-39.9 | 0.850 | 0.710 | 1.018 | 0.078 | ||||
| ≥ 40.0 | 0.856 | 0.721 | 1.016 | 0.076 | ||||
| HFpEF, n = 1,275 | ||||||||
| 25.0-29.9 | 0.951 | 0.612 | 1.477 | 0.823 | ||||
| 30.0-34.9 | 0.895 | 0.584 | 1.372 | 0.611 | ||||
| 35.0-39.9 | 1.094 | 0.690 | 1.733 | 0.703 | ||||
| ≥ 40.0 | 1.536 | 0.981 | 2.406 | 0.061 | ||||
| Urinary incontinence (n = 6,765) | ||||||||
| 25.0-29.9 | 1.168 | 1.049 | 1.301 | 0.005 | ||||
| 30.0-34.9 | 1.277 | 1.134 | 1.437 | < 0.0001 | ||||
| 35.0-39.9 | 1.031 | 0.900 | 1.182 | 0.656 | ||||
| ≥ 40.0 | 0.855 | 0.741 | 0.987 | 0.032 | ||||
| OA of the knee (n =15,871) | ||||||||
| 25.0-29.9 | 1.271 | 1.164 | 1.389 | < 0.0001 | ||||
| 30.0-34.9 | 1.473 | 1.348 | 1.609 | < 0.0001 | ||||
| 35.0-39.9 | 1.655 | 1.505 | 1.820 | < 0.0001 | ||||
| ≥ 40.0 | 1.848 | 1.680 | 2.033 | < 0.0001 | ||||
| T2DM (n = 13,578) | ||||||||
| 25.0-29.9 | 0.940 | 0.841 | 1.051 | 0.279 | ||||
| 30.0-34.9 | 0.917 | 0.822 | 1.024 | 0.123 | ||||
| 35.0-39.9 | 0.926 | 0.826 | 1.038 | 0.185 | ||||
| ≥ 40.0 | 0.944 | 0.844 | 1.056 | 0.316 | ||||
| Prediabetes (n = 20,303) | ||||||||
| 25.0-29.9 | 1.013 | 0.942 | 1.089 | 0.734 | ||||
| 30.0-34.9 | 1.079 | 1.003 | 1.161 | 0.040 | ||||
| 35.0-39.9 | 1.151 | 1.064 | 1.246 | 0.0004 | ||||
| ≥ 40.0 | 1.163 | 1.073 | 1.261 | 0.0003 | ||||
| Asthma (n = 23,284) | ||||||||
| 25.0-29.9 | 1.016 | 0.964 | 1.072 | 0.551 | ||||
| 30.0-34.9 | 1.051 | 0.992 | 1.113 | 0.093 | ||||
| 35.0-39.9 | 1.169 | 1.093 | 1.250 | < 0.0001 | ||||
| ≥ 40.0 | 1.181 | 1.103 | 1.264 | < 0.0001 | ||||
| Psoriasis (n = 4,583) | ||||||||
| 25.0-29.9 | 1.388 | 1.205 | 1.600 | < 0.0001 | ||||
| 30.0-34.9 | 1.126 | 0.973 | 1.305 | 0.112 | ||||
| 35.0-39.9 | 1.123 | 0.944 | 1.336 | 0.189 | ||||
| ≥ 40.0 | 1.306 | 1.080 | 1.578 | 0.006 | ||||
| GERD (n = 50,962) | ||||||||
| 25.0-29.9 | 1.067 | 1.027 | 1.110 | 0.001 | ||||
| 30.0-34.9 | 1.142 | 1.096 | 1.190 | < 0.0001 | ||||
| 35.0-39.9 | 1.136 | 1.082 | 1.192 | < 0.0001 | ||||
| ≥ 40.0 | 1.162 | 1.103 | 1.224 | < 0.0001 | ||||
| Hypertension (n = 49,683) | ||||||||
| 25.0-29.9 | 1.005 | 0.964 | 1.047 | 0.822 | ||||
| 30.0-34.9 | 1.100 | 1.055 | 1.148 | < 0.0001 | ||||
| 35.0-39.9 | 1.094 | 1.044 | 1.147 | 0.0002 | ||||
| ≥ 40.0 | 1.162 | 1.105 | 1.221 | < 0.0001 | ||||
| Dyslipidemia (n = 27,155)a | ||||||||
| 25.0-29.9 | 1.120 | 1.058 | 1.185 | < 0.0001 | ||||
| 30.0-34.9 | 1.167 | 1.102 | 1.236 | < 0.0001 | ||||
| 35.0-39.9 | 1.156 | 1.084 | 1.232 | < 0.0001 | ||||
| ≥ 40.0 | 1.034 | 0.966 | 1.107 | < 0.338 | ||||
| Musculoskeletal pain (n = 101,784) | ||||||||
| 25.0-29.9 | 1.031 | 1.010 | 1.052 | 0.003 | ||||
| 30.0-34.9 | 1.056 | 1.033 | 1.080 | < 0.0001 | ||||
| 35.0-39.9 | 1.089 | 1.059 | 1.119 | < 0.0001 | ||||
| ≥ 40.0 | 1.083 | 1.051 | 1.116 | < 0.0001 | ||||
Note: Generalized linear regression models adjusted for age group, gender, region, payer type, index year, and baseline CCI score.
a Includes only patients identified using ICD-10-CM codes between October 1, 2015, and December 31, 2016.
BMI = body mass index; CCI = Charlson Comorbidity Index; GERD = gastroesophageal reflux disease; HFpEF = heart failure with ejection fraction; ICD-10-CM = International Classification of Diseases, Tenth Revision, Clinical Modification; LCL = lower confidence limit; OA = osteoarthritis; OSA = obstructive sleep apnea; PCOS = polycystic ovarian syndrome; T2DM = type 2 diabetes mellitus; UCL = upper confidence limit.
The highest adjusted cost ratios were observed for OA of the knee; compared with patients with normal weight, patients with class I obesity were associated with 47.3% higher costs, patients with class II obesity with 65.5% higher costs, and patients with class III obesity with 84.8% higher costs (all P < 0.0001). High cost ratios were also observed for patients with psoriasis; compared with normal weight, patients with overweight were associated with 38.8% higher costs (P < 0.0001), and patients with class III obesity were associated with 30.6% higher costs (P = 0.006).
MEAN TOTAL COMPLICATION-SPECIFIC COSTS OVER 2- AND 3-YEAR FOLLOW-UP, OVERALL AND BY BMI CLASS
Complication-related costs increased over the 2-year follow-up (index date + 720) and the 3-year follow-up (index date + 1,080) among patients with CE through those time periods (Supplementary Table 4 and Supplementary Figure 2, available in online article). In general, similar patterns in mean total costs by BMI class were observed when assessing the costs over the 2- and 3-year follow-up. Variation was observed over time for the HFpEF cohort, potentially related to limited sample size (overall, n = 677 with 2-year follow-up and n = 387 with 3-year follow-up). The percentage difference in mean total complication-specific costs between patients with normal weight versus those with class III obesity increased over time for most complications (exceptions: OSA, urinary incontinence, T2DM, and prediabetes). For example, for OA of the knee, patients with class III obesity had 84.2% higher mean total complication-specific costs compared with patients with normal weight over the 1-year follow-up, and this increased to 101.7% higher costs over the 2-year follow-up (among patients with 2-year followup), and then 118.9% higher costs over the 3-year follow-up (among patients with 3-year follow-up).
Discussion
This study was the first that comprehensively quantified the direct medical costs of 13 ORCs of interest by BMI class in a large national sample of adults in the United States with recorded BMI. Following adjustment for baseline confounders, we found significantly higher total complication-specific costs for most BMI class comparisons versus normal weight BMI for 6 out of the 13 ORCs in the 1 year following an incident diagnosis code: OA of the knee, GERD, musculoskeletal pain, hypertension, dyslipidemia, and prediabetes. The association between BMI and complication-specific cost was strongest for OA of the knee where patients with class III obesity were associated with 84.8% higher costs versus normal weight (P < 0.0001). OA of the knee and HFpEF were the costliest ORCs overall, with the highest cost difference between normal weight and class III obesity. Substantially higher cost differences (≥ 20%) were observed among those with class III obesity versus those with normal weight for these 2 complications, as well as for OSA, psoriasis, GERD, and asthma. Costs increased over the 2- and 3-year follow-up, with similar trends observed by BMI class. Considering the high prevalence of obesity among these ORCs (41.6%-73.5% at baseline), the observed higher mean total complication-specific costs among those with higher BMI further highlight the substantial ORC-related economic burden associated with obesity.
The findings in our study are consistent with the peer-reviewed literature that shows a strong association of obesity with disease severity and an increased risk of complications and costs. A study by Leyland et al. (2016) found that patients with obesity and OA of the knee were at a 100% increased risk of total knee replacement (TKR) surgery compared with patients with normal weight.8 A study on TKR recipients found $250 to $300 higher hospitalization costs among patients with obesity versus patients without obesity.20 The results in our study indicated that inpatient hospitalization was the main cost driver among patients with OA of the knee. These results and the findings from the literature are consistent with the substantially higher mean total complication-specific costs by increasing BMI class among those with OA of the knee. Similarly, studies have shown obesity versus nonobesity status to be associated with higher disease activity (19% vs. 12% affected body surface area for patients with class III obesity vs. normal weight, respectively) and lower odds (0.62; 95% CI = 0.49-0.79) of achieving early clinical response to systemic treatment among patients with psoriasis.12,21 We found significantly higher costs for patients with overweight or with class III obesity versus those with normal weight in our psoriasis cohort following adjustment, but not for those with class I or class II obesity. Further investigation is needed to understand this lack of a trend. Pharmacy costs were the primary cost component for our psoriasis cohort, suggesting increasing disease severity and treatment management costs by BMI class. Another study estimated health care costs attributable to obesity and overweight in working patients with asthma to be $878 and $257 in 2015 USD, per person per year, from 2003-2013.22 Our adjusted analysis of the asthma cohort found that patients with class III obesity were associated with 18.1% higher 1-year total complication-specific costs versus patients with normal weight (P < 0.0001).
The mean total complication-specific costs over 1, 2, and 3 years among women with urinary incontinence were highest for patients with class I obesity. Previous research among women with stress urinary incontinence found increasing BMI was significantly associated with increasing incontinence episode frequency (P < 0.0001) and higher mean Urogenital Distress Inventory total scores (P = 0.003).23 It is unclear why costs were observed to be highest among patients with class I obesity in our urinary incontinence cohort, and this may warrant further research. It is of relevance to note that other factors have been shown to be associated with symptom severity and treatment-seeking behavior/receipt of treatment in urinary incontinence (e.g., socioeconomic status, previous number of pregnancies, and negative attitudes toward the condition).24-26 For our T2DM cohort, highest costs were observed for patients with normal weight. However, costs were not significantly different for normal weight versus the other BMI classes. Other studies have identified increasing costs with BMI class in T2DM, but they were not limited to newly diagnosed patients.27,28 It is possible that we would see similar trends among a prevalent T2DM population.
Overall, given the high prevalence of obesity, the associated complications and the substantial national medical spending toward ORCs, the results of our study provide important insights on the economic burden associated with obesity. Significantly higher mean total 1-year complication-specific costs were observed with increasing BMI class (for most BMI class comparisons vs. normal weight) for several ORCs (OA of the knee, GERD, musculoskeletal pain, hypertension, dyslipidemia, and prediabetes), suggesting that appropriate weight management may reduce the costs associated with obesity and ORCs. Previous research using instrumental variable models found that medical care costs rise exponentially in the range of class II and III obesity.27 The estimated savings in annual medical care costs from a 5% reduction in weight was $2,137 (in 2010 USD) for those with a starting BMI of 40 kg/m2 and $528 for those with a starting BMI of 35 kg/m2.
LIMITATIONS
This study has some limitations to consider. In our assessment of complication-related costs we captured outpatient medical claims with a diagnosis code for the ORC in any position. While the costs measured in our study were identified as complication-specific, it is possible that these costs could also be associated with other comorbidities (e.g., an office visit specifically for a comorbidity, where the complication of interest was also recorded). According to clinical coding guidelines for the outpatient setting, documented conditions that coexist at the time of the encounter/visit should be coded if they require or affect patient care treatment and management.17 We therefore considered secondary diagnosis codes to have some relevance in understanding the complication-specific burden as presence or absence of an ORC may affect treatment or management of a different condition.
Our approach may have overestimated some complication-specific costs. However, we considered that restricting outpatient diagnosis codes to the first or secondary position would yield a very conservative underestimate. We attempted to partially address this limitation by adjusting for baseline comorbidity (i.e., CCI score) in the adjusted analyses.
The authors acknowledge that the cost data were not normally distributed, but we primarily focused on the mean, since we considered it relevant from the payer perspective. Note that the median/Wilcoxon rank sum test (presented in Table 2) followed similar trends to the mean/parametric t-test, and in some cases, a few more comparisons were statistically significant.
For the 2- and 3-year follow-up, the possibility of misclassification bias owing to a changing BMI over time in our study cannot be ruled out, as only baseline BMI was used. However, the results of our study indicated increasing accumulated cost over time, with similar patterns in mean total costs by BMI class observed over the 1-, 2-, and 3-year follow-up.
While our study only evaluated direct medical costs, the indirect burden of obesity was substantial. It has been estimated that employees with normal weight cost on average $3,830 per year (in 2011 USD) to employers (considering covered medical, sick day, short-term disability, and workers’ compensation claims), while the cost of employees with morbid obesity was more than double ($8,067).29
Finally, there are limitations related to generalizability of our study findings. The study sample was limited to a patient population with available BMI in the AEMR database and with linkage to the PharMetrics Plus database, and with continuous health plan enrollment in the 1-year pre- and 1-year post-index periods. The final ORC study cohorts meeting all study eligibility criteria comprised between 4.2% (T2DM) and 11.4% (dyslipidemia) of initial study cohorts (patients from the base population with a diagnosis for the ORC of interest during the selection window). Additionally, the study sample from PharMetrics Plus was largely commercially insured or self-insured and may not be representative of uninsured or Medicare or Medicaid populations.
Conclusions
Obesity is an important public health emergency that has reached epidemic proportions. ORCs are important drivers of the economic burden of obesity. The results of our study indicate increasing mean 1-year complication-specific costs by BMI class for 7 out of 13 ORCs evaluated: OA of the knee, GERD, musculoskeletal pain, prediabetes, hypertension, OSA, and asthma. Following adjustment, significantly higher complication-specific costs among those with higher BMI class versus those with normal weight (for most BMI class comparisons) were observed for 6 out of 13 ORCs (previous list with dyslipidemia instead of OSA and asthma). The high costs associated with ORCs and obesity indicate high unmet treatment needs and the need for appropriate management of obesity, which may reduce the economic burden associated with ORCs and help decrease national medical expenditures.
ACKNOWLEDGMENTS
The authors thank Vibha Desai, senior consultant at IQVIA, for her writing and editorial assistance, and Estella Wang, advanced analytics manager at IQVIA, for her involvement with data analysis.
REFERENCES
- 1.Centers for Disease Control and Prevention. Adult obesity facts. February 27, 2020. Accessed November 10, 2020. https://www.cdc.goy/obesity/data/adult.html
- 2.Jensen MD, Ryan DH, Apovian CM, et al. 2013 AHA/ACC/TOS guideline for the management of overweight and obesity in adults: a report of the American College of Cardiology/American Heart Association Task Force on practice guidelines and The Obesity Society. J Am Coll Cardiol. 2014;63(25 Pt B):2985-3023. [DOI] [PubMed] [Google Scholar]
- 3.Waters H, Graf M. America’s obesity crisis: the health and economic costs of excess weight. Milken Institute. 2018. Accessed November 10, 2020. https://milkeninstitute.org/reports/americas-obesity-crisis-health-and-economic-costs-excess-weight [Google Scholar]
- 4.Kim DD, Basu A. Estimating the medical care costs of obesity in the United States: systematic review, meta-analysis, and empirical analysis. Value Health. 2016;19(5):602-13. [DOI] [PubMed] [Google Scholar]
- 5.Biener A, Cawley J, Meyerhoefer C. The high and rising costs of obesity to the U.S. health care system. J Gen Intern Med. 2017;32(Suppl 1):6-8. [DOI] [PMC free article] [PubMed] [Google Scholar]
- 6.Blume SW, Li Q, Huang JC, Hammer M, Graf TR. Variation in the risk of progression between glycemic stages across different levels of body mass index: evidence from a United States electronic health records system. Curr Med Res Opin. 2015;31(1):115-24. [DOI] [PubMed] [Google Scholar]
- 7.Smith AG, Singleton JR. Obesity and hyperlipidemia are risk factors for early diabetic neuropathy. J Diabetes Complications. 2013;27(5):436-42. [DOI] [PMC free article] [PubMed] [Google Scholar]
- 8.Leyland KM, Judge A, Javaid MK, et al. Obesity and the relative risk of knee replacement surgery in patients with knee osteoarthritis: a prospective cohort study. Arthritis Rheumatol. 2016;68(4):817-25. [DOI] [PubMed] [Google Scholar]
- 9.Yuen MM, Earle RL, Kadambi N, et al. T-P-3166. A systematic review and evaluation of current evidence reveals 236 obesity-associated disorders (ObAD). Presented at: Obesity Week 2016; October 31-November 4, 2016; New Orleans, LA. [Google Scholar]
- 10.Li Q, Blume SW, Huang JC, Hammer M, Ganz ML. Prevalence and healthcare costs of obesity-related comorbidities: evidence from an electronic medical records system in the United States. J Med Econ. 2015;18(12):1020-28. [DOI] [PubMed] [Google Scholar]
- 11.Sam S. Obesity and polycystic ovary syndrome. Obes Manag. 2007;3(2): 69-73. [DOI] [PMC free article] [PubMed] [Google Scholar]
- 12.Schwarz PE, Pinter A, Melzer N, Barteczek P, Reinhardt M. ERAPSO: revealing the high burden of obesity in German psoriasis patients. Dermatol Ther (Heidelb). 2019;9(3):579-87. [DOI] [PMC free article] [PubMed] [Google Scholar]
- 13.IQVIA. US claims – IQVIA PharMetrics Plus. May 28, 2020. Accessed November 10, 2020. https://www.iqvia.com/library/fact-sheets/iqvia-pharmetrics-plus
- 14.IQVIA. US EMR – IQVIA Ambulatory EMR. August 27, 2020. Accessed November 10, 2020. https://www.iqvia.com/library/fact-sheets/us-only-iqvia-ambulatory-emr
- 15.Office for Human Research Protections. Attachment C – FAQs on informed consent for use of biospecimens and data. March 2018. Accessed November 10, 2020. https://www.hhs.gov/ohrp/sachrp-committee/recommendations/attachment-c-faqs-recommendations-and-glossary-informed-consent-and-research-use-of-biospecimens-and-associated-data/index.html
- 16.Electronic Code of Federal Regulations. Part 46—protection of human subjects. July 2018. Accessed November 10, 2020. https://www.ecfr.gov/cgi-bin/retrieveECFR?gp=&SID=83cd09e1c0f5c6937cd9d7513160fc3f&pitd=20180719&n=pt45.1.46&r=PART&ty=HTML#se45.1.46_1102
- 17.Centers for Medicare and Medicaid Services. ICD-10-CM official guidelines for coding and reporting FY 2020. October 1, 2019-September 30, 2020. Accessed November 10, 2020. https://www.cms.gov/Medicare/Coding/ICD10/Downloads/2020-Coding-Guidelines.pdf
- 18.Rothman KJ. No adjustments are needed for multiple comparisons. Epidemiology. 1990;1(1):43-46. [PubMed] [Google Scholar]
- 19.Armstrong RA. When to use the Bonferroni correction. Ophthalmic Physiol Opt. 2014;34(5):502-08. [DOI] [PubMed] [Google Scholar]
- 20.Kremers HM, Visscher SL, Kremers WK, Naessens JM, Lewallen DG. The effect of obesity on direct medical costs in total knee arthroplasty. J Bone Joint Surg Am. 2014;96(9):718-24. [DOI] [PubMed] [Google Scholar]
- 21.Naldi L, Addis A, Chimenti S, et al. Impact of body mass index and obesity on clinical response to systemic treatment for psoriasis. Dermatology. 2008;217(4):365-73. [DOI] [PubMed] [Google Scholar]
- 22.Chang C, Lee SM, Choi BW, et al. Costs attributable to overweight and obesity in working asthma patients in the United States. Yonsei Med J. 2017;58(1):187-94. [DOI] [PMC free article] [PubMed] [Google Scholar]
- 23.Richter HE, Kenton K, Huang L, et al. The impact of obesity on urinary incontinence symptoms, severity, urodynamic characteristics and quality of life. J Urol. 2010;183(2):622-28. [DOI] [PMC free article] [PubMed] [Google Scholar]
- 24.Kinchen KS, Burgio K, Diokno AC, Fultz NH, Bump R, Obenchain R. Factors associated with women’s decisions to seek treatment for urinary incontinence. J Womens Health (Larchmt). 2003;12(7):687-98. [DOI] [PubMed] [Google Scholar]
- 25.Seshan V, Muliira JK. Self-reported urinary incontinence and factors associated with symptom severity in community dwelling adult women: implications for women’s health promotion. BMC Womens Health. 2013;13:16. [DOI] [PMC free article] [PubMed] [Google Scholar]
- 26.Li Y, Cai X, Glance LG, Mukamel DB. Gender differences in healthcare-seeking behavior for urinary incontinence and the impact of socioeconomic status: a study of the Medicare managed care population. Med Care. 2007:1116-22. [DOI] [PubMed] [Google Scholar]
- 27.Cawley J, Meyerhoefer C, Biener A, Hammer M, Wintfeld N. Savings in medical expenditures associated with reductions in body mass index among U.S. adults with obesity, by diabetes status. Pharmacoeconomics. 2015;33(7):707-22. [DOI] [PMC free article] [PubMed] [Google Scholar]
- 28.Li Q, Blume SW, Huang JC, Hammer M, Graf TR. The economic burden of obesity by glycemic stage in the United States. Pharmacoeconomics. 2015;33(7):735-48. [DOI] [PMC free article] [PubMed] [Google Scholar]
- 29.Van Nuys K, Globe D, Ng-Mak D, Cheung H, Sullivan J, Goldman D. The association between employee obesity and employer costs: evidence from a panel of U.S. employers. Am J Health Promot. 2014;28(5):277-85. [DOI] [PubMed] [Google Scholar]