

Abstract
BACKGROUND:
Biologics are an important treatment option for solid tumors and hematological malignancies but are a primary driver of health care spending growth. The United States has yet to realize the promise of reduced costs via biosimilars because of slow uptake, partially resulting from commercial payer reimbursement models that create economic incentives favoring the prescribing of reference biologics.
OBJECTIVE:
To examine the economic feasibility of an alternative reimbursement methodology that prospectively shares savings across commercial payers and providers to shift economic incentives in favor of lower-cost oncology biosimilars.
METHODS:
Using 3 oncology monoclonal antibody drugs (trastuzumab, bevacizumab, and rituximab) as examples, we developed an alternative reimbursement model that would offer an additional per unit payment (or “extra consideration”) such that providers’ net income per unit for biosimilars and reference biologics become equal. Provider-negotiated rates (or payer-allowable amounts) and average sales prices were obtained from claims data and projected to develop prices/costs from 2021 through 2025. Scenario analyses by varying key model assumptions were performed.
RESULTS:
The alternative reimbursement model achieved 1-year and 5-year payer savings in the commercial market for all 3 drugs in the sites of service analyzed. The base analysis showed first-year cost savings to payers, net of cost sharing, of up to 9% in physician offices (POs) and up to 1% in non-340B hospital outpatient departments (HOPDs) for patients using the drugs analyzed. Five-year cumulative savings per patient ranged from about $12,600-$16,100 in PO and $2,200-$4,100 in HOPD. Payer savings varied depending on the characteristics of the provider with which the payer was negotiating (eg, lower- vs highermarkup providers, POs vs HOPDs).
CONCLUSIONS:
Positive payer savings shown in our modeling suggest that an alternative reimbursement arrangement could facilitate an economic compromise wherein commercial payers can save on biosimilars while providers’ incomes are preserved.
What is already known about this subject
Biosimilars and their reference biologics are typically reimbursed using the buy-and-bill method in the United States.
While the Centers for Medicare & Medicaid Services incentivizes biosimilar use through differential reimbursement, commercial payers generally have not changed their methodology.
Today’s reimbursement model (buy-and-bill) implemented by commercial payers leads to a perverse incentive in favor of higher-cost medications for most providers.
What this study adds
An alternative reimbursement methodology that prospectively shares savings from lower-cost biosimilars between payers and providers can potentially shift economic incentives to favor use of oncology biosimilars.
The model showed first-year cost savings to payers, net of cost sharing, of up to 9% in physician offices and up to 1% in non-340B hospital outpatient departments for patients using trastuzumab, bevacizumab, and rituximab.
Payer savings varied depending on the characteristics of the provider with which the payer was negotiating (eg, lower- vs higher-markup providers).
Biologic drugs, produced from or containing components of living organisms, are a cornerstone of oncology treatment for solid tumors and hematological malignancies; however, they are also a primary driver of health care spending growth. In 2019, the United States spent $211 billion on biologics, which equated to 43% of total medicine/drug spending.1 Among classes of biologics, oncology biologics had the highest spending in 2019 and had a 21.0% compound annual growth rate from 2015 to 2019.1 With advances in early cancer detection, effective treatment, and an aging US population, prevalence of cancer survivorship is expected to increase, and more oncology patients are expected to be treated for longer periods of time, accelerating the growth in oncology care costs.2,3
A biosimilar is defined as a biologic product that is “highly similar to an already licensed biologic product (referred to as the reference product) notwithstanding minor differences in clinically inactive components,” and one in which, “there are no clinically meaningful differences between the biological product and the reference product in terms of purity, potency, and safety.”4 The passing and implementation of the Biologics Price Competition and Innovation Act in 2010 authorized the US Food and Drug Administration (FDA) to create an abbreviated regulatory process for biosimilars, aiming to facilitate market access, encourage competition, and thus directly reduce the cost of biologics.
According to a 2017 RAND report, biosimilars were estimated to save the US health care system $54 billion on biologic drug spending from 2017 to 2026, approximately 3% of total estimated biologic spending.5 A recent budget impact analysis estimated that the introduction of the bevacizumab-bvzr biosimilar in the United States would result in $7 million in cost savings for a hypothetical commercial US payer, with 10 million lives saved and $4 million in Medicare cost savings over 5 years.6
Within the European Union, biosimilars have achieved the goal of reducing the cost of biologic therapies through rapid uptake and improved patient access.7 Similarly, the UK National Health System saved £210 million between 2017 and 2018 by switching to biosimilars, including rituximab, etanercept, and infliximab.8
However, the promise of savings similar to those achieved in Europe remains to be seen in the United States. As of December 2020, 9 oncology biosimilars have been approved by the FDA,9 yet biosimilar uptake in oncology care has been slow. For example, the US market uptake of filgrastim biosimilar, which was the first FDA-approved biosimilar in 2015, has lagged behind uptake observed in Canada, Japan, and Europe.10 The stalled uptake of biosimilars can be attributed to several unique factors in the US market such as legislation and regulations; patent protection litigations; stakeholder perceptions; and provider, payer, and patient economics.11 Among those factors, the current reimbursement methods employed by commercial payers may play a crucial role in disincentivizing biosimilar adoption.
Biosimilars and their reference biologics are typically reimbursed using the buy-and-bill method; that is, providers purchase these drugs and then bill insurers for the product at a markup, as opposed to patients receiving drugs directly from a pharmacy. Third-party reimbursement and patient cost sharing for anticancer medications account for more than half of the gross revenue of a typical oncology practice.12 Under Medicare fee-for-service, providers are reimbursed for most covered biologics at the product’s average sales price (ASP) plus 6% of the ASP.13 Hence, lower-cost drugs generate less gross revenue for providers. To help encourage biosimilar usage and remedy the economic disincentive, the Centers for Medicare & Medicaid Services (CMS) changed Medicare’s reimbursement of biosimilars in 2018, such that a biosimilar is reimbursed at its own ASP plus 6% of its reference product’s ASP.14
However, the economic disincentive to use biosimilars persists in other markets where similar changes have not taken hold. As a result, adoption of lower-cost biosimilars could reduce the income of most providers who treat commercially insured patients since biosimilars’ lower prices will generate lower provider markups and gross revenue compared with biologics. The perverse incentives of the current approach favor use of more expensive drugs rather than less expensive biosimilars, which may suggest the need for an alternative reimbursement methodology.
Conceptual frameworks related to reform of the buy-and-bill system for oncology care have been proposed, including invoice pricing, least costly alternative reimbursement, and bundling of drugs into episode-of-care payments.15-17 Yet, no methodologies have been proposed based on significant real-world claims data or have accounted for the dramatic differences in provider markups by site of service or have addressed the challenges to providers who may adopt biosimilars.
The objective of the present study was to design and test economic feasibility of an alternative reimbursement methodology that prospectively shares savings from lower-cost biosimilars between payers and providers in order to shift economic incentives to favor use of oncology biosimilars.
Methods
DATA SOURCES
We analyzed claims data for the 3 reference biologic drugs trastuzumab (Herceptin), bevacizumab (Avastin), and rituximab (Rituxan) and the 2 biosimilar drugs trastuzumab-anns (Kanjinti) and bevacizumab-awwb (Mvasi). We used 2018 and 2019 administrative claims data from the IBM MarketScan Database and Milliman’s Consolidated Health Cost Guidelines Sources Database to estimate provider markups in the commercial market for this analysis. Specifically, we used the per unit allowed amounts on relevant claims, which represent the amounts that payers who contribute to these datasets established as reimbursement for commercially insured business.
INCLUSION AND EXCLUSION CRITERIA
We extracted claims with Healthcare Common Procedural Coding System (HCPCS) codes for the drugs included in the analysis. Since our analysis focused only on oncology use of these drugs, we excluded (1) claims that did not have a corresponding oncology International Classification of Diseases, Tenth Revision, Clinical Modification (ICD-10-CM) code in any position; (2) bevacizumab claims that had evidence of use for the treatment of macular degeneration; and (3) claims with the “JW” HCPCS/Current Procedural Terminology modifier code, indicating partial vial use.
Claims were identified as administered in a physician office (PO) or a hospital outpatient department (HOPD) based on the claims’ place of service (POS) code. If POS was unavailable or invalid, physician specialty was mapped to PO or HOPD using Milliman’s Health Cost Guidelines.18 For claims identified as HOPD, we used provider IDs from the Health Resources and Services Administration to exclude providers that qualified for 340B drug pricing, as the 340B acquisition costs were not considered in the present study.19 HOPD claims with masked, blank, or invalid provider IDs that could not be categorized as 340B or non-340B were excluded.
MODEL INPUTS
The provider markup for a claim was calculated as the allowed drug cost divided by the drug acquisition cost. The allowed drug cost is the total reimbursement to providers and includes both the plan liability and any member cost sharing. Drug acquisition costs were estimated based on the date of service on the claim. We used historical ASPs from the CMS quarterly pricing file as the basis for provider acquisition costs in our model.20 The ASP for each claim was set equal to the reported ASP 2 quarters after the date of service, accounting for the delay in the reporting of pricing information to CMS.
There were multiple biosimilars available to the oncology reference biologics as of March 2021 with similar pricing. Rather than select a particular biosimilar to use, we averaged the ASP of all biosimilars and used this average as our starting ASP to project forward. We excluded outlier claims, defined as claims where the allowed cost per unit was below the 5th or above the 95th percentiles.
Markups for trastuzumab, bevacizumab, and rituximab biosimilars were based on data from trastuzumab-anns, bevacizumab-awwb, and an average of the markup experience for trastuzumab-anns and bevacizumab-awwb, given insufficient data on rituximab biosimilars, respectively.
We determined the additional financial consideration needed to be paid to providers to ensure an economically neutral reimbursement landscape for oncology biosimilars compared with their reference biologics. The economic model was formulated for each oncology reference biologic and its biosimilars and for each site of service (PO and HOPD) for a total of 6 iterations. Each iteration included 10 deciles of markup groupings, with each grouping representing 1 decile of claims arranged by the percentage markup implied by provider reimbursement levels.
In the base-case analysis, we assumed the annual reference biologic and biosimilar ASP trends from the third quarter of 2020 to each projection year were −5.0% and −10.0%, respectively. As we did not have sufficient data to identify internal trends for the drugs of interest, we considered trends in pricing of other oncology-related biosimilar/reference drug biologic combinations available in the market. We chose to use a negative trend based on observed reductions in ASP for 2 of the longest-standing biosimilar/reference biologic drug combinations, filgrastim/filgrastim-sndz (Neupogen/Zarxio) and epoetin alfa/epoetin alfa-epbx (Procrit/Retacrit). Trastuzumab and bevacizumab and their biosimilars showed similar pricing patterns to filgrastim and epoetin alfa and their biosimilars, based on the limited experience we observed in the data.
To develop our allowed reimbursement, we assumed the biosimilars and the reference biologics received the same provider markups as we observed in the data for the reference biologics. Using the projected allowed reimbursement and acquisition costs for each reference biologic and its biosimilars, we calculated the revenue and costs per unit for providers and payers net of member cost sharing, assuming a 2021 market share distribution of 45% rituximab and 55% rituximab biosimilars, 35% trastuzumab and 65% trastuzumab biosimilars, and 35% bevacizumab and 65% bevacizumab biosimilars.
In the base-case analysis, for 2022, 2023, 2024, and 2025, we assumed a reference biologic market share of 30%, 25%, 20%, and 15%, respectively, for each reference biologic, with the remaining market share of biosimilars. These market share assumptions were derived from historical data and were compared against other external resources to assess reasonability.21 We applied these assumptions uniformly across our drugs of interest for simplicity.
DESCRIPTION OF ALTERNATIVE REIMBURSEMENT MODEL
Under this model, payers compensate providers with a prospective payment that equalizes providers’ economic incentives when using biosimilars rather than reference biologics. In other words, payers pass some of their savings to providers when biosimilars are adopted. We estimated the impact of this alternative reimbursement model using 3 projections: (1) status quo, (2) alternative reimbursement, and (3) payer optimal.
The “status quo” calculated the combined cost and revenue per unit of biologic drug for the payer and for the provider in the absence of the alternative reimbursement model, using the underlying market share distribution of the drugs of interest. This projection was used as the base case for calculating revenues, costs, and savings.
We then illustrated the “alternative reimbursement” scenario wherein the payer offers sufficient extra consideration to providers for each unit of the biosimilar administered to make providers financially indifferent between administering the biosimilar or the reference biologic. Under this scenario, we also assumed providers would replace all administrations of the reference biologic with the biosimilar. This projection calculated the overall revenue and costs per unit under these conditions.
The “payer optimal” projection was set equal to either the status quo or the alternative reimbursement projection, by decile of provider markup, choosing whichever scenario produced a lower net cost to the payer over the 5-year period.
These 3 projections were calculated for each decile of provider markups. The results of the payer optimal projections were the basis of the savings or losses from the alternative reimbursement model. The savings/losses amounts were developed by taking the difference of the payer optimal and status quo projections. The individual decile savings were then aggregated to develop an overall savings estimate. We determined a savings estimate for the 6 iterations (for each biologic/biosimilar combination and site of service). Supplementary Table 1 (174.5KB, pdf) (available in online article) provided an illustration of the alternative reimbursement model savings using trastuzumab as an example for one decile of an outpatient facility markup for the baseline scenario.
In the base-case analysis, effective member coinsurance was set at 5% across all iterations. All markups were calculated over ASP. In the PO and HOPD settings, markups for the biosimilars were set equal to the markups for their reference biologics.
SCENARIO ANALYSIS
To understand the impact of key model assumptions, we analyzed 4 scenarios in addition to the base-case analysis. These scenarios, therefore, assumed differences in (1) how reference biologic and biosimilar ASPs change over time, (2) the provider mix for a given payer, (3) how payers choose to contract with providers, and (4) how biosimilar market share evolves over the 5-year projection.
Results
STUDY COHORT
In total, 21,941 commercial members’ claims were included in our analysis. The identification process for selecting these claims was summarized in Supplementary Figure 1 (174.5KB, pdf) (available in online article).
PROVIDER MARKUPS OVER ASP BY SITE OF SERVICE
In the PO setting, differential reimbursement was observed; that is, biosimilar markups of ASP were greater than their reference biologic markups. Biosimilars bevacizumab-awwb and trastuzumab-anns were associated with average PO markups of 32% and 35%, respectively. These were high compared with average PO markups of 18%-19% for their reference products. This differential may be due to differences in the mix of plans utilizing biosimilars, as there were less data available for these drugs compared with their reference products. In the HOPD setting, average markups for reference biologics were much larger than those observed in the PO setting, ranging from 116%-121% (Table 1).
TABLE 1.
2018-2019 Average and Decile of Provider Markups Over Average Sales Price Observed in Claims
| 2018-2019 average and decile of provider markups over average sales price | ||||||||
|---|---|---|---|---|---|---|---|---|
| Decile | Physician office | HOPD facilitya | Physician office | HOPD facility | Physician office | HOPD facility | ||
| Trastuzumab % | Trastuzumab-anns, % | Trastuzumab % | Bevacizumab % | Bevacizumab-awwb, % | Bevacizumab, % | Rituximabb % | ||
| Average | 19 | 32 | 120 | 18 | 35 | 116 | 23 | 121 |
| 1 | 2 | 17 | 12 | 2 | 16 | 7 | 2 | 7 |
| 2 | 4 | 19 | 24 | 4 | 20 | 18 | 5 | 18 |
| 3 | 6 | 19 | 46 | 6 | 20 | 44 | 7 | 38 |
| 4 | 9 | 23 | 71 | 9 | 24 | 67 | 9 | 73 |
| 5 | 13 | 25 | 90 | 12 | 28 | 87 | 13 | 105 |
| 6 | 17 | 30 | 123 | 16 | 31 | 112 | 18 | 140 |
| 7 | 20 | 32 | 159 | 20 | 36 | 146 | 21 | 161 |
| 8 | 25 | 36 | 185 | 24 | 41 | 181 | 28 | 186 |
| 9 | 36 | 43 | 229 | 33 | 51 | 215 | 40 | 219 |
| 10 | 57 | 67 | 287 | 54 | 81 | 297 | 88 | 333 |
aFor HOPD facility, only the reference biologic markups were shown due to low claims volume for biosimilars in the HOPD setting.
bFor biosimilar rituximab, the average physician office markups of trastuzumab-anns and bevacizumab-awwb were used, assuming differential reimbursement. This is because we did not have sufficient data to derive a claims-based distribution.
HOPD = hospital outpatient department.
BASE-CASE ANALYSIS
Commercial payers could achieve first-year oncology biologic drug cost savings (net of cost sharing) of up to 9% in POs and up to 1% in HOPDs if the modeled alternative reimbursement methodology were adopted. Over 5 years, cost savings were up to 5% in the PO facilities and up to 1% in the HOPD facilities (Table 2). The 5-year cumulative savings per patient (PP) ranged from about $12,600-$16,100 in POs and $2,200-$4,100 in HOPDs. Before removing the cost of the extra considerations, payers achieved savings of up to 16% PP in both PO and HOPD facilities.
TABLE 2.
Summary of Per-Patient Savings Achieved by Payers in Base-Case Analysis Segmented by Drug and Site of Service
| Average per-patient payer savings achieved from alternative reimbursement model, $ (%) | |||||||
|---|---|---|---|---|---|---|---|
| Reference biologic | Site of servicea | 2021 | 2022 | 2023 | 2024 | 2025 | Total 5-year |
| Trastuzumab | Physician office | 4,073 (6.6) | 3,425 (6.1) | 2,625 (5.2) | 1,714 (3.8) | 728 (1.8) | 12,566 |
| HOPD facility | 878 (0.8) | 692 (0.7) | 468 (0.5) | 217 (0.3) | −51b (−0.1) | 2,203 | |
| Bevacizumab | Physician office | 4,349 (6.1) | 3,722 (5.7) | 2,900 (5.0) | 1,935 (3.7) | 869 (1.9) | 13,773 |
| HOPD facility | 1,152 (0.9) | 974 (0.8) | 744 (0.7) | 474 (0.5) | 178 (0.2) | 3,521 | |
| Rituximab | Physician office | 6,720 (8.6) | 3,887 (5.7) | 2,929 (4.8) | 1,847 (3.4) | 680 (1.4) | 16,064 |
| HOPD facility | 1,701 (1.2) | 993 (0.8) | 753 (0.7) | 483 (0.5) | 191 (0.2) | 4,121 | |
aMarkups for biosimilars and reference biologics were set equal in both sites of service for this model.
bPayers may alter their approach in the event the program produces losses in a given year. We have assumed the program will be maintained for all 5 years if it produces savings over the entire 5-year period.
HOPD = hospital outpatient department.
Payer savings from the alternative reimbursement model were highest in the PO setting, assuming no differential reimbursement. Payer savings in the HOPD setting were below 1% annually and cumulatively over 5 years for all 3 biologic drugs (with the sole exception of rituximab, which achieved 1.2% in year 1). This is because markups exceeded 40% by the 30th percentile of HOPD providers, making the extra consideration required to incentivize biosimilar use too large for payers to absorb profitably in most scenarios.
The alternative reimbursement model achieved savings across all years for all 3 drugs (trastuzumab, bevacizumab, and rituximab) and both sites of service (PO and HOPD). Payer savings peaked in year 1 (2021) and then declined over 5 years (Figure 1 and Figure 2); these results reflect an overall decline in potentially achievable savings due to increasing biosimilar market share over time.
FIGURE 1.
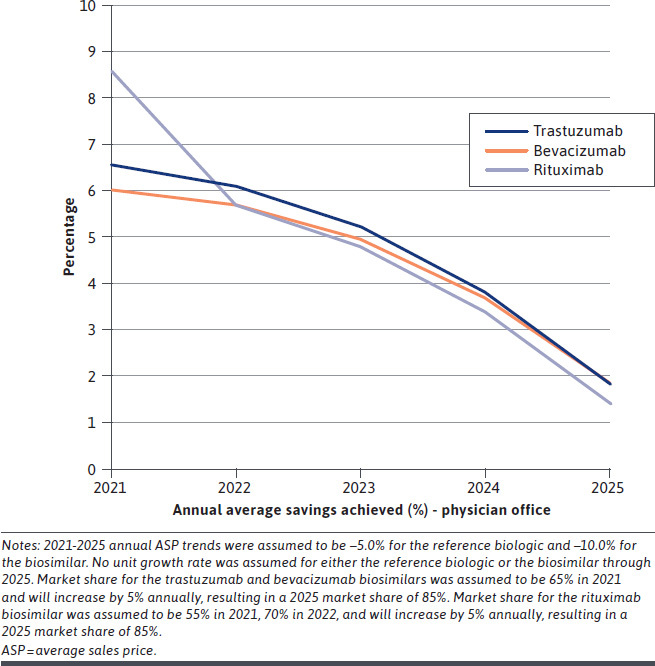
Physician Office Annual Payer Savings Percentage (per Patient) Over Years 1-5 for Base-Case Analysis
FIGURE 2.
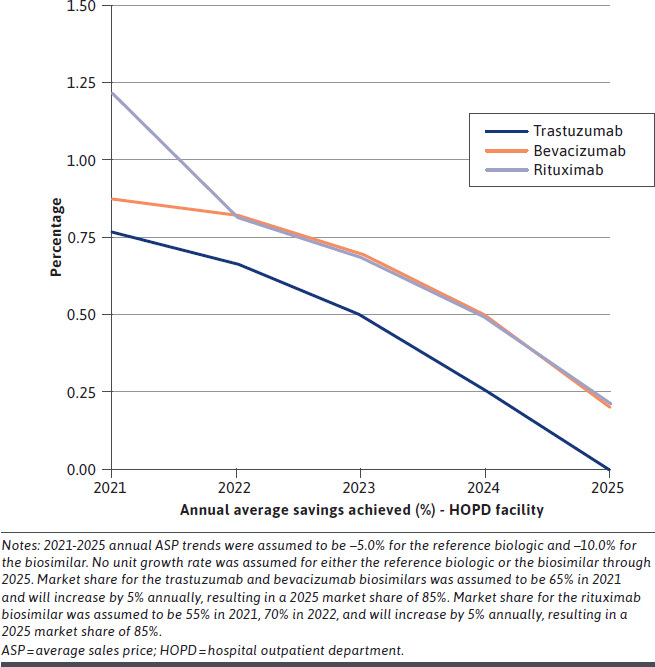
HOPD Facility Annual Payer Savings Percentage (per Patient) Over Years 1-5 for Base-Case Analysis
SCENARIO ANALYSIS
First, as biosimilar competition increases in the oncology space, biosimilar prices may erode more dramatically. Assuming biologic ASPs decline by 5% annually and biosimilar ASPs decline by 15% annually, payers could achieve additional 5-year cost savings of 1.7% ($3,100 PP) in PO facilities and 0.2% ($800 PP) in HOPD facilities compared with the base-case analysis (Table 3).
TABLE 3.
Scenario Results: Change in Payer Savings (per Patient) From the Base-Case Analysis Segmented by Drug and Site of Service
| Scenario | Change in 5-year average payer savings per patient from the base case | |||||
|---|---|---|---|---|---|---|
| Trastuzumab | Bevacizumab | Rituximab | ||||
| Physician office | HOPD facility | Physician office | HOPD facility | Physician office | HOPD facility | |
| Savings, % | ||||||
| Base case | 5.0 | 0.5 | 4.7 | 0.7 | 5.2 | 0.7 |
| Scenario 1 | 1.6 | 0.1 | 1.7 | 0.2 | 1.6 | 0.2 |
| Scenario 2 | 4.0 | 0.9 | 3.6 | 1.1 | 4.5 | 1.5 |
| Scenario 3 | 1.0 | 0.2 | 1.0 | 0.1 | 1.0 | 0.2 |
| Scenario 4 | 1.8 | 0.3 | 1.8 | 0.2 | 1.7 | 0.3 |
| Savings, $ | ||||||
| Base case | 12,566 | 2,203 | 13,773 | 3,521 | 16,064 | 4,121 |
| Scenario 1 | 2,572 | 409 | 3,140 | 792 | 3,020 | 780 |
| Scenario 2 | 7,806 | 2,127 | 8,106 | 2,954 | 10,021 | 4,286 |
| Scenario 3 | 2,549 | 813 | 2,848 | 694 | 3,214 | 1,302 |
| Scenario 4 | 5,071 | 1,275 | 5,676 | 1,427 | 5,917 | 1,895 |
Note: Scenario 1: Biosimilar prices erode more dramatically than projected in the base-case analysis. Scenario 2: Payer’s provider mix is weighted to include more lower-markup providers.
Scenario 3: Providers are made 80% financially whole for biosimilar adoption.
Scenario 4: Lower biosimilar market share than projected in the base-case analysis.
HOPD = hospital outpatient department.
Second, assuming the payer’s provider mix was weighted to include more lower-markup providers, that is, payers only contracted with providers in the first through fifth deciles of markups, with 20% of utilization in each decile, the results demonstrated that payers could save 4.5% ($10,000 PP) more in PO facilities and 1.5% ($4,300 PP) more in HOPD facilities over 5 years compared with the base-case analysis (Table 3).
Third, if payers made providers only 80% financially whole rather than 100% whole, payers could save 1.0% ($3,200 PP) more in PO facilities and 0.2% ($1,300 PP) more in HOPD facilities over 5 years compared with the base-case analysis (Table 3).
Finally, assuming 5% lower annual biosimilar market share than projected in the base case, greater savings were observed for payers: 1.8% ($5,900 PP) more in PO facilities and 0.3% ($1,900 PP) more in HOPD facilities over 5 years compared with the base-case analysis (Table 3).
Discussion
The alternative reimbursement model achieved payer savings in the commercial market for all 3 drugs in the sites of service analyzed. Payer savings varied depending on the characteristics of the provider with which the payer was negotiating. National health systems have adopted various policies to encourage biosimilar use. In Europe, health authorities in different countries have adopted policies to encourage biosimilar usage. For instance, in Poland, hospitals are incentivized to procure the lowest-cost medications within a group, as reimbursement rates are predetermined on the basis of reference price.22,23 Although France does not have reference-based pricing, they have piloted a shared savings program, which provides financial incentives to institutions that prescribe drugs at lower costs, including biosimilars.24 This shared savings program was seen to have significantly positive impact on biosimilar usage, with an annual 8.5% increase for the biosimilar antitumor necrosis factor in 2018.25
In the United States, the Medicare Payment Advisory Commission has proposed that Medicare reimburse reference and biosimilar drugs at their combined ASP.26 This would create a strong economic incentive for providers to choose the lower-priced biosimilar because reimbursement would be less than the price of the reference drug. However, commercial insurance in the United States does not operate as a national system. For this reason, the alternative reimbursement methodology we describe is adaptable and customizable by private payers, but it could still encourage biosimilar use by producing savings for commercial payers while preserving providers’ economic health.
Reimbursement policies are likely affecting prescribing behaviors for reference drugs and biosimilars.27-30 Socal et al have examined Medicare fee-for-service administrative data to identify the patient and facility characteristics associated with filgrastim-sndz uptake.30 The results showed that POs had much faster and larger uptake of the biosimilar filgrastim compared with hospital outpatient departments. Chen et al found similar results using commercial medical claims data.26 Our findings of higher markups for biologics in HOPD settings rather than in PO settings may explain the slower take-up in the HOPD, as the HOPD has a strong incentive to maintain economic margins.
Although buy-and-bill reimbursement is commonly used for physician-administered drugs for both HOPD and PO settings, the markups are much higher for the HOPD setting. Hospitals typically have higher drugpurchasing volume than POs and can negotiate lower drug acquisition costs and command higher reimbursement from commercial payers because hospitals generally have more market power. As a result, hospitals can obtain substantial markups on reference biologic drugs. In this context, the payer and provider could agree to an arrangement that partially compensates the HOPD for the reduced revenue of shifting to biosimilars, similar to our third scenario, or payers could selectively implement our model with lower-markup HOPDs, similar to our second scenario.
Our results have shown that the reimbursement markups for the 3 oncology monoclonal antibody drugs examined were 287%-333%, which were consistent with previous findings.31 Recent commercial medical claims have shown that on average, hospital reimbursement for physician-administered brand drugs was approximately 247% of the acquisition costs (across both 340B and non-340B hospitals), which means HOPDs were reimbursed at 2.5 times the amount the hospitals paid to procure these brand drugs by commercial payers.31 The data had an upper limit of more than 430% and 730% of acquisition costs for non-340 and 340B hospitals, respectively.31
The US movement to value-based care and accountable care is consistent with the goals of the alternative reimbursement model for biosimilars described in the present study. One component of that movement is efficiency in the delivery of care, which includes, “using fewer inputs to produce the same quality output.”32 Shifting from higher-priced reference biologics to lower-priced biosimilars fits well with this description. The federal CMS Innovation Center (CMMI) has been one of the leaders in promoting alternative payment models.32 CMMI has focused on large-scale programs, such as Accountable Care Organizations (ACOs). ACO arrangements are also used increasingly by private payers. Under a typical ACO arrangement, if the ACO can reduce spending below a benchmark level, it can keep a portion of the savings. The alternative reimbursement model described in this study operates on a small scale in comparison with an ACO because it would basically redefine the fees for physician-administered biosimilars that a payer and provider negotiate.
LIMITATIONS
Our study has several limitations to consider. First, the claims data we used for this model are subject to the usual variability considerations for such data. Our assumptions for current and future market share of biosimilars represent averages that could vary considerably by situation, and that variability is not likely to be uniform by biosimilar drug. We assumed certain future uses and prices of reference biologics and biosimilars, but these forecasts are uncertain.
Second, this study did not account for manufacturer or supplier discounts in the acquisition cost estimates or rebates given to payers, which may impact the real drug costs for both players in the market. If significant manufacturer or supplier discounts are pervasive in the market, payers may find that this alternative reimbursement model produces lower savings than projected. In some cases, rebates paid to payers could create incentives in favor of higher-priced reference biologics despite biosimilars’ lower price tags. For example, rebates paid to payers might be retained by the payer (or administrator) and not passed on to the patient or insurance policyholder, which would encourage the payer to favor high-priced drugs that pay high rebates. Similarly, facilities participating in the 340B Drug Pricing Program acquire drugs at high discounts. This low-acquisition price can generate dramatic provider markups at 340B facilities, which are unlikely to be offset by any economically feasible consideration from a payer. Costs associated with formulary management, education, and nonmedical switching from reference products to biosimilars were not included, as those costs are individual-payer dependent.
Third, as more biosimilar biologics enter the US market, competition may accelerate price decreases for both reference products and biosimilars, which may result in even greater savings. However, the timing of biosimilar entries and magnitude of price erosion remain uncertain. Indeed, if biosimilar prices do not erode as rapidly as we anticipate, this alternative reimbursement model may not be as favorable to payers.
Fourth, our assumption that certain providers will shift all utilization to biosimilars under our model may not hold in some circumstances. If providers do not completely shift their utilization to biosimilars, payer savings may be different than forecasted. We did not attempt to model circumstances where the cost to the payer for a biosimilar would be more than for the reference drug. For example, we assumed that payers would not participate in this arrangement if the reimbursement for biosimilars plus the extra consideration was greater than the reimbursement for the reference product, so we did not model those scenarios.
Finally, there are other well-acknowledged barriers for biosimilar adoption in the United States in addition to reimbursement arrangements, such as gaps in prescriber knowledge and hesitancy toward biosimilars, which should be taken into consideration to maximize biosimilar usage.33-35
Conclusions
The strong positive results observed in our model suggest that a prospective alternative reimbursement arrangement could facilitate an economic compromise wherein payers can save on biosimilar drugs while providers’ incomes are preserved. Certainly, payers have other tools that can be used alongside the reimbursement model to promote biosimilars, including education about therapeutic equivalence of biosimilars, formulary design, step edits, and reduced patient cost sharing.
ACKNOWLEDGMENTS
The development of the manuscript was supported by Pyenson, Smith, Carioto, Jacobson, and Pittinger, employees of Milliman Inc., and was funded by Pfizer Inc.
REFERENCES
- 1.The IQVIA Institute. Biosimilars in the United States 2020-2024. September 29, 2020. Accessed December 11, 2020. https://www.iqvia.com/insights/the-iqvia-institute/reports/biosimilars-in-the-united-states-2020-2024
- 2.Bluethmann SM, Mariotto AB, Rowland JH. Anticipating the “silver tsunami”: prevalence trajectories and comorbidity burden among older cancer survivors in the United States. Cancer Epidemiol Biomarkers Prev. 2016;25(7):1029-36. [DOI] [PMC free article] [PubMed] [Google Scholar]
- 3.Bradley CJ, Yabroff KR, Warren JL, Zeruto C, Chawla N, Lamont EB. Trends in the treatment of metastatic colon and rectal cancer in elderly patients. Med Care. 2016;54(5):490-97. [DOI] [PubMed] [Google Scholar]
- 4.Gottlieb S. Remarks from FDA Commissioner Scott Gottlieb, M.D., as prepared for delivery at the Brookings Institution on the release of the FDA’s Biosimilars Action Plan. US Food and Drug Administration. July 18, 2018. Accessed December 11, 2020. https://www.fda.gov/news-events/press-announcements/remarks-fda-commissioner-scott-gott-lieb-md-prepared-delivery-brookings-institution-release-fdas [Google Scholar]
- 5.Mulcahy AW, Hlavka JP, Case SR. Biosimilar cost savings in the United States: initial experience and future potential. Rand Health Q. 2018;7(4):3. [PMC free article] [PubMed] [Google Scholar]
- 6.Yang J, Liu R, Ektare V, Stephens J, Shelbaya A. Does biosimilar bevacizumab offer affordable treatment options for cancer patients in the USA? A budget impact analysis from US commercial and Medicare payer perspectives. Appl Health Econ Health Policy. 2021;19(4):605-18. [DOI] [PMC free article] [PubMed] [Google Scholar]
- 7.Konstantinidou S, Papaspiliou A, Kokkotou E. Current and future roles of biosimilars in oncology practice. Oncol Lett. 2020;19(1):45-51. [DOI] [PMC free article] [PubMed] [Google Scholar]
- 8.Robinson J. Ten things pharmacists should know about biologics and biosimilars. Pharm J. Published online October 2018. doi:10.1211/PJ.2018.20205551. [Google Scholar]
- 9.US Food and Drug Administration. Biosimilar product information. 2020. Accessed December 11, 2020. https://www.fda.gov/drugs/biosimilars/biosimilar-product-information
- 10.Courage N, Parsons A. The comparability conundrum: biosimilars in the United States, Europe and Canada. Food Drug Law J. 2011;66(2):203-24, i-ii. [PubMed] [Google Scholar]
- 11.Crespi-Lofton J, Skelton JB. The growing role of biologics and biosimilars in the United States: perspectives from the APhA Biologics and Biosimilars Stakeholder Conference. J Am Pharm Assoc. 2017;57(5):e15-e27. [DOI] [PubMed] [Google Scholar]
- 12.Towle EL, Barr TR, Senese JL. National Oncology Practice Benchmark, 2012 report on 2011 data. J Oncol Pract. 2012;8(6):51s-70s. [DOI] [PMC free article] [PubMed] [Google Scholar]
- 13.Medicare Prescription Drug, Improvement, and Modernization Act of 2003. Public Law 108-173. Accessed December 11, 2020. https://www.govinfo.gov/content/pkg/PLAW-108publ173/pdf/PLAW-108publ173.pdf
- 14.Medicare Program; Revisions to Payment Policies Under the Physician Fee Schedule and Other Revisions to Part B for CY 2016. Fed Reg. 2015;80(220):70886. Accessed December 11, 2020. https://www.govinfo.gov/content/pkg/FR-2015-11-16/pdf/2015-28005.pdf [PubMed] [Google Scholar]
- 15.Polite B, Conti RM, Ward JC. Reform of the buy-and-bill system for outpatient chemotherapy care is inevitable: perspectives from an economist, a realpolitik, and an oncologist. Am Soc Clin Oncol Educ Book. 2015;e75-80. doi: 10.14694/EdBook_AM.2015.35.e75 [DOI] [PMC free article] [PubMed] [Google Scholar]
- 16.Polite BN, Ward JC, Cox JV, et al. Payment for oncolytics in the United States: a history of buy and bill and proposals for reform. J Oncol Pract. 2014;10(6):357-62. [DOI] [PMC free article] [PubMed] [Google Scholar]
- 17.American Society of Clinical Oncology. Potential approaches to sustainable, long-lasting payment reform in oncology. J Oncol Pract. 2014;10(4):254-8. [DOI] [PubMed] [Google Scholar]
- 18.Milliman Inc. Health Cost Guidelines—Grouper. Software. Accessed October 12, 2021. https://www.milliman.com/-/media/products/hcgsuite/hcg_grouper.ashx?la=en&hash=04B9CDB58271747490032B3ABF13A05D
- 19.Health Resources and Services Administration, Office of Pharmacy Affairs. Medicaid Exclusion File. 2021. Accessed February 26, 2021. https://www.hrsa.gov/opa/updates/2015/october.html
- 20.Centers for Medicare & Medicaid Services. 2020 ASP drug pricing files. Accessed February 26, 2021. https://www.cms.gov/medicare/medicare-part-b-drug-average-sales-price/2020-asp-drug-pricing-files
- 21.IQVIA. Commercial Data Warehouse. 2020. Accessed August 15, 2020. https://www.iqvia.com/locations/united-states/solutions/life-sciences/information-solutions/information-technology/commercial-data-warehouse
- 22.Moorkens E, Vulto AG, Huys I, et al. Policies for biosimilar uptake in Europe: an overview. PLoS One. 2017;12(12):e0190147. [DOI] [PMC free article] [PubMed] [Google Scholar]
- 23.Mestre-Ferrandiz J, Towse A, Berdud M. Biosimilars: how can payers get long-term savings? PharmacoEconomics. 2016;34(6):609-16. [DOI] [PMC free article] [PubMed] [Google Scholar]
- 24.KPMG Advisory N.V. Improving healthcare delivery in hospitals by optimized utilization of medicines: a study into 8 European countries. Accessed December 11, 2020. https://www.medicinesforeurope.com/wp-content/uploads/2019/10/20190903_Hospital-Reform-Study_final.pdf
- 25.Bajard P, Duhamel J, Bourguignon S. The incentive financial framework regarding French hospital prescription of biosimilar medicines when delivered in retail pharmacy: impact analysis of Article 51 experimentation for 2018. Abstract PMU53 presented at: ISPOR Europe 2019; November 2-7, 2019; Copenhagen, Denmark. [Google Scholar]
- 26.Medicare Payment Advisory Commission. Creating consolidated billing codes that group a reference biologic with its biosimilars. In: Report to the Congress: Medicare and the health care delivery system. June 15, 2017. Page 48. Accessed October 7, 2021. http://www.medpac.gov/docs/default-source/reports/jun17_reporttocongress_sec.pdf?sfvrsn=0
- 27.Chen AJ, Ribero R, Van Nuys K. Provider differences in biosimilar uptake in the filgrastim market. Am J Manag Care. 2020;26(5):208-13. [DOI] [PubMed] [Google Scholar]
- 28.Dean EB, Johnson P, Bond AM. Physician, practice, and patient characteristics associated with biosimilar use in Medicare recipients. JAMA Netw Open. 2021;4(1):e2034776. [DOI] [PMC free article] [PubMed] [Google Scholar]
- 29.Baker JF, Leonard CE, Lo Re V 3rd, Weisman MH, George MD, Kay J. Biosimilar uptake in academic and Veterans Health Administration settings: influence of institutional incentives. Arthritis Rheumatol. 2020;72(7):1067-71. [DOI] [PMC free article] [PubMed] [Google Scholar]
- 30.Socal MP, Anderson KE, Sen A, Bai G, Anderson GF. Biosimilar uptake in Medicare part B varied across hospital outpatient departments and physician practices: the case of filgrastim. Value Health. 2020;23(4):481-86. [DOI] [PMC free article] [PubMed] [Google Scholar]
- 31.Bunger A, Hunter MT, Carol Kim. Analysis of 340B hospitals’ outpatient department acquisition cost and commercial reimbursement for physician-administered brand medicines. December 2019. Accessed December 11, 2020. https://us.milliman.com/-/media/milliman/pdfs/articles/margin_analysis_of_hopd_rx_at_340b_hospitals.ashx
- 32.Medicare Payment Advisory Commission. Chapter 2: Assessing payment adequacy and updating payments in fee-for-service Medicare. In: Report to the Congress: Medicare Payment Policy. March 2018. October 7, 2021. http://www.medpac.gov/docs/default-source/reports/mar18_medpac_entirereport_sec_rev_0518.pdf?sfvrsn=0
- 33.Greene L, Singh RM, Carden MJ, Pardo CO, Lichtenstein GR. Strategies for overcoming barriers to adopting biosimilars and achieving goals of the biologics price competition and innovation act: a survey of managed care and specialty pharmacy professionals. J Manag Care Spec Pharm. 2019;25(8):904-12. doi:10.18553/jmcp.2019.18412 [DOI] [PMC free article] [PubMed] [Google Scholar]
- 34.Lam SW, Amoline K, Marcum C, Leonard M. Healthcare system conversion to a biosimilar: trials and tribulations. Am J Health Syst Pharm. Published online July 13, 2021. doi:10.1093/ajhp/zxab279 [DOI] [PubMed] [Google Scholar]
- 35.Boccia R, Jacobs I, Popovian R, de Lima Lopes G, Jr.. Can biosismilars help achieve the goals of US health care reform? Cancer Manag Res. 2017;9:197-205. doi:10.2147/CMAR.S133442 [DOI] [PMC free article] [PubMed] [Google Scholar]