

Abstract
The ionization and fragmentation patterns of 24 compounds with elemental composition of CmH2mO2, including isomeric esters and alkanoic acids, were investigated by atmospheric pressure corona discharge ionization collision-induced dissociation (CID) mass spectrometry in the positive-ion mode. All compounds were ionized as protonated molecules and NH4+ adducts. In addition, fragment ions were observed in mass spectra of esters other than methyl esters, which are owing to the dissociation of the alkyl group in the alcohol side from the protonated molecules. In CID spectra, protonated alkanoic acids/methyl esters split off H2O/CH3OH and CO or the alkyl group in the acid side, depending on the carbon chain length. Protonated esters (other than methyl esters) mainly fragmented the alkyl group in the alcohol side. These general rules on ionization and fragmentation patterns can provide relevant information on the discrimination of isomers.
Keywords: ester, alkanoic acid, atmospheric pressure corona discharge ionization, fragmentation, positive-ion mode, isomer
1. INTRODUCTION
Fruits biosynthesize and emit a large variety of aroma volatile compounds, and terpenoids and fatty-acid derivatives are the dominant classes. Fruit aroma is an important indicator of the quality of the fruit flavor. For examples, esters are the most abundant volatile compounds emitted by apple, and their use has been proposed for cultivar classification.1,2) Furthermore, it has been reported that watercored (WC) apples have a stronger aroma than non-WC apples because of their relatively high methyl and ethyl esters content; thus, they are widely popular among Japanese consumers.3)
As an important trait of fruit quality, fruit aroma volatile research has gained increasing attention in recent years.4–10) The main instrumentation for aroma research used to date are (i) gas chromatography/mass spectrometry (GC/MS)5–8) and (ii) proton-transfer reaction mass spectrometry (PTR-MS).9,10) Comprehensive two-dimensional GC has been used to improve the separation of different compounds, allowing the separate measurements of hundreds of compounds, including structural and steric isomers. However, the GC technique is time and labor intensive, which limits the number of samples that can be analyzed in practice. Conversely, the PTR-MS, one of the chemical ionization mass spectrometry techniques using H3O+ reagent ions, allows the real-time and online measurements of various volatile organic compounds with a high sensitivity and fast response.11–13) However, the PTR-MS methodology cannot measure isomers separately with the same molecular formulas/mass. Fruit aroma is a complex mixture of a large number of volatile compounds, including isomers. Therefore, the development of real-time measurement techniques that can simultaneously detect various volatile compounds and distinguish isomers would be useful for aroma research in the future.
To achieve this purpose, as a preliminary study, various ester isomers with elemental composition of CmH2mO2 and related compounds (e.g., alkanoic acids) are positively ionized by the atmospheric pressure corona discharge ionization technique (APCDI), which is an atmospheric pressure chemical ionization (APCI)-like ambient ionization technique.14,15) Thereafter, collision-induced dissociation (CID) is performed for protonated molecules. Resultantly, it is found that those mass spectral data allow distinguishing the isomers. Herein, we discuss general rules on the ionization and fragmentation patterns of alkanoic acid, methyl esters, and other esters. Additionally, we show how the isomers can be distinguished using those rules.
2. EXPERIMENTAL
2.1. Analytes
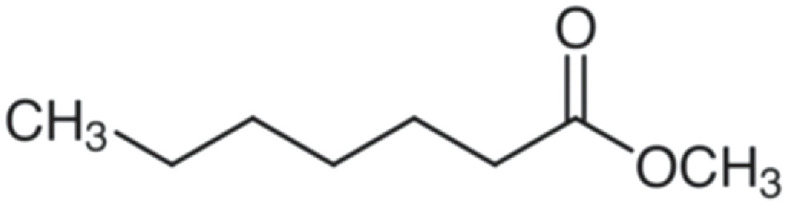
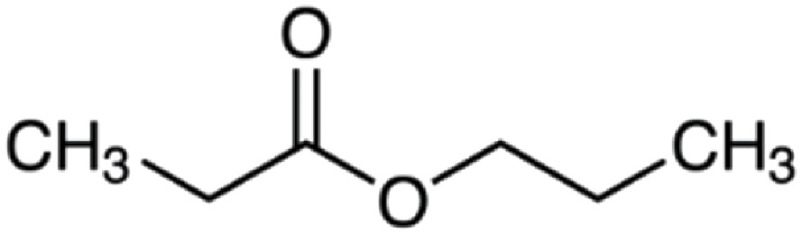
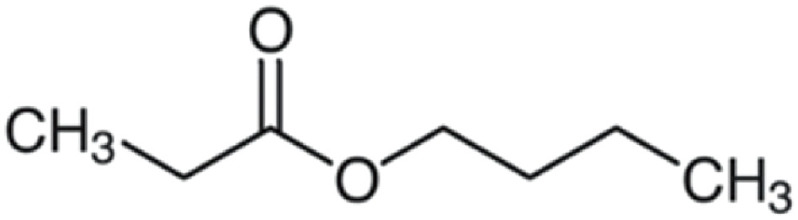
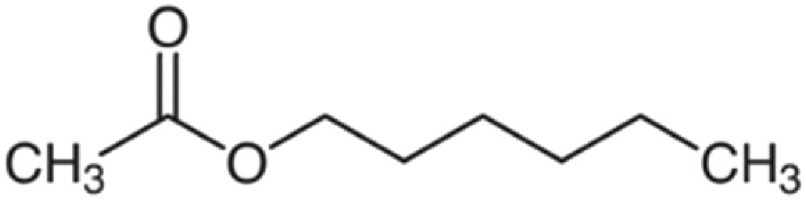
The analytes used in this study were seven alkanoic acids, seven methyl esters, and ten other esters, as summarized in Tables 1–3. All the analytes were purchased from the Tokyo Chemical Industry (Tokyo, Japan) and had over 98% purity. Hereafter, we use the acronym “R1COOR2” to denote different compounds according to the length of the carbon chain in the acid (R1) or alcohol side (R2).
Table 1. Summary of seven alkanoic acids (R2=H): the molecular properties and results of positive-ion APCDI mass spectra obtained by the Q-orbitrap MS.
| Molecular properties | Results of positive-ion APCDI mass spectra: m/z, chemical formula, and relative intensities (%) of major ions | |||||||||
|---|---|---|---|---|---|---|---|---|---|---|
| Analyte (M) | Molecular mass (nominal Da) | Formula | R1 | R2 | Protonated molecule, [M+H]+ | NH4+ adduct, [M+NH4]+ | H2O loss from protonated molecule, R1CO+ | |||
| Acetic acid | 60 | C2H4O2 | CH3 | H | 61.0283 | 100 | 78.0548 | 71.2 | N.D.a | |

|
C2H5O+ | C2H8O2N+ | ||||||||
| Propanoic acid | 74 | C3H6O2 | C2H5 | H | 75.0439 | 100 | 92.0703 | 24.2 | 57.0333 | 3 |
|
C3H7O2+ | C3H10O2N+ | C3H5O+ | |||||||
| Butanoic acid | 88 | C4H8O2 | C3H7 | H | 89.0595 | 100 | 106.086 | 31.7 | 71.049 | 5 |
|
C4H9O2+ | C4H12O2N+ | C4H7O+ | |||||||
| Pentanoic acid | 102 | C5H10O2 | C4H9 | H | 103.0751 | 100 | 120.1016 | 18.6 | 85.0646 | 3.3 |
|
C5H11O2+ | C5H14O2N+ | C5H9O+ | |||||||
| Hexanoic acid | 116 | C6H12O2 | C5H11 | H | 117.0907 | 100 | 134.1171 | 37.6 | 99.0802 | 4.1 |

|
C6H13O2+ | C6H16O2N+ | C6H11O+ | |||||||
| Heptanoic acid | 130 | C7H14O2 | C6H13 | H | 131.1058 | 100 | 148.1321 | 11.3 | 113.0953 | 2.5 |
|
C7H15O2+ | C7H18O2N+ | C7H13O+ | |||||||
| Octanoic acid | 144 | C8H16O2 | C7H15 | H | 145.1221 | 100 | 162.1486 | 19.4 | 127.1116 | 3.4 |
|
C8H17O2+ | C8H20O2N+ | C8H15O+ | |||||||
aNot detected due to detection limit of m/z range.
APCDI, atmospheric pressure corona discharge ionization technique; MS, mass spectrometry.
Table 2. Summary of seven methyl esters (R2=CH3): the molecular properties and results of positive-ion APCDI mass spectra obtained by the Q-orbitrap MS.
| Molecular properties | Results of positive-ion APCDI mass spectra: m/z, chemical formula, and relative intensities (%) of major ions | |||||||||
|---|---|---|---|---|---|---|---|---|---|---|
| Analyte (M) | Molecular mass (nominal Da) | Formula | R1 | R2 | Protonated molecule, [M+H]+ | NH4+ adduct, [M+NH4]+ | CH3OH loss from protonated molecule, R1CO+ | |||
| Methyl acetate | 74 | C3H6O2 | CH3 | CH3 | 75.0439 | 100 | 92.0703 | 29.3 | N.D.a | |

|
C3H7O2+ | C3H10O2N+ | ||||||||
| Methyl propionate | 89 | C4H8O2 | C2H5 | CH3 | 89.0595 | 100 | 106.086 | 16.8 | 57.0334 | <1 |

|
C4H9O2+ | C4H12O2N+ | C3H5O+ | |||||||
| Methyl butyrate | 102 | C5H10O2 | C3H7 | CH3 | 103.075 | 100 | 120.102 | 47.5 | 71.049 | 1 |
|
C5H11O2+ | C5H14O2N+ | C4H7O+ | |||||||
| Methyl valerate | 116 | C6H12O2 | C4H9 | CH3 | 117.091 | 100 | 134.117 | 13.5 | 85.0648 | <1 |
|
C6H13O2+ | C6H16O2N+ | C5H9O+ | |||||||
| Methyl hexanoate | 130 | C7H14O2 | C5H11 | CH3 | 131.106 | 100 | 148.132 | 27.9 | 99.0804 | <1 |
|
C7H15O2+ | C7H18O2N+ | C6H11O+ | |||||||
| Methyl heptanoate | 144 | C8H16O2 | C6H13 | CH3 | 145.121 | 100 | 162.148 | 11.6 | 113.096 | <1 |
|
C8H17O2+ | C8H20O2N+ | C7H13O+ | |||||||
| Methyl octanoate | 158 | C9H18O2 | C7H15 | CH3 | 159.138 | 100 | 176.164 | 76.7 | 127.112 | <1 |

|
C9H19O2+ | C9H22O2N+ | C8H15O+ | |||||||
aNot detected due to detection limit of m/z range.
APCDI, atmospheric pressure corona discharge ionization technique; MS, mass spectrometry.
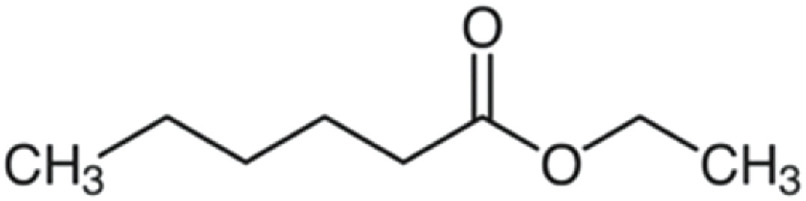
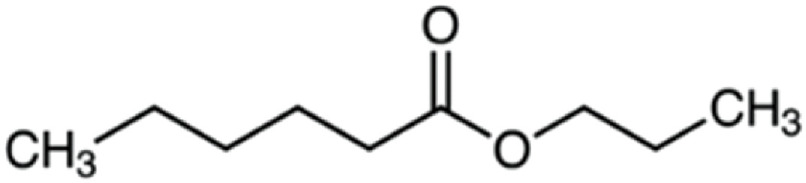
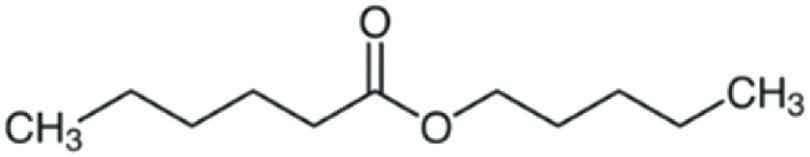
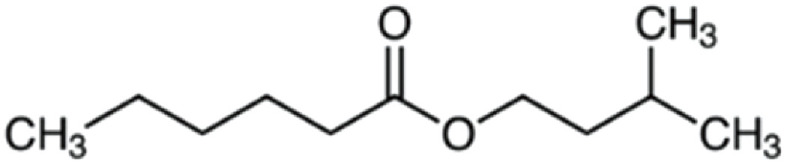
Table 3. Summary of 10 esters other than methyl ester (R2≠CH3): molecular properties and results of positive-ion APCDI mass spectra obtained by the Q-orbitrap MS.
| Molecular properties | Results of positive-ion APCDI mass spectra: m/z, chemical formula, and relative intensities (%) of major ions | |||||||||||
|---|---|---|---|---|---|---|---|---|---|---|---|---|
| Analyte (M) | Molecular mass (nominal Da) | Formula | R1 | R2 | Protonated molecule, [M+H]+ | NH4+ adduct, [M+NH4]+ | [R2–H] loss from protonated molecule, [R1COOH+H]+ | R1-COOH loss from protonated molecule, R2+ | ||||
| Propyl propanoate | 116 | C6H12O2 | C2H5 | C3H7 | 117.0909 | 100 | 134.117 | 64.3 | 75.0441 | 29.8 | N.D.a | |
|
C6H13O2+ | C6H16O2N+ | C3H7O2+ | |||||||||
| Isopropyl propionate | 116 | C6H12O2 | C2H5 | C3H7 | 117.0909 | 100 | 134.117 | 70.5 | 75.0441 | 60.3 | N.D.a | |

|
C6H13O2+ | C6H16O2N+ | C3H7O2+ | |||||||||
| Butyl propionate | 130 | C7H14O2 | C2H5 | C4H9 | 131.1066 | 90 | 148.133 | 100 | 75.044 | 28.5 | 57.0698 | <1 |
|
C7H15O2+ | C7H18O2N+ | C3H7O2+ | C4H9+ | ||||||||
| Isobutyl propionate | 130 | C7H14O2 | C2H5 | C4H9 | 131.1066 | 84.4 | 148.133 | 100 | 75.044 | 15.4 | 57.0698 | 17.5 |

|
C7H15O2+ | C7H18O2N+ | C3H7O2+ | C4H9+ | ||||||||
| Hexyl acetate | 144 | C8H16O2 | CH3 | C6H13 | 145.1218 | 100 | 162.148 | 55.2 | 61.0282 | 17.1 | 85.1009 | 12.8 |
|
C8H17O2+ | C8H20O2N+ | C2H5O2+ | C6H13+ | ||||||||
| Ethyl hexanoate | 144 | C8H16O2 | C5H11 | C2H5 | 145.1218 | 100 | 162.148 | 33.1 | 117.091 | 14.1 | N.D.a | |
|
C8H17O2+ | C8H20O2N+ | C6H13O2+ | |||||||||
| Propyl hexanoate | 158 | C9H18O2 | C5H11 | C3H7 | 159.1374 | 100 | 176.164 | 67.5 | 117.091 | 48.6 | N.D.a | |
|
C9H19O2+ | C9H22O2N+ | C6H13O2+ | |||||||||
| Butyl hexanoate | 172 | C10H20O2 | C5H11 | C4H9 | 173.153 | 100 | 190.179 | 37.7 | 117.091 | 66.5 | 57.0698 | <1 |

|
C10H21O2+ | C10H24O2N+ | C6H13O2+ | C4H9+ | ||||||||
| Amyl hexanoate | 186 | C11H22O2 | C5H11 | C5H11 | 187.1686 | 100 | 204.1951 | 61.3 | 117.0906 | 51.4 | 71.0853 | <1 |
|
C11H23O2+ | C11H26O2N+ | C6H13O2+ | C5H11+ | ||||||||
| Isoamyl hexanoate | 186 | C11H22O2 | C5H11 | C5H11 | 187.1686 | 100 | 204.1951 | 67.6 | 117.0906 | 20.6 | 71.0853 | 13 |
|
C11H23O2+ | C11H26O2N+ | C6H13O2+ | C5H11+ | ||||||||
aNot detected due to detection limit of m/z range.
APCDI, atmospheric pressure corona discharge ionization technique; MS, mass spectrometry.
2.2. Atmospheric pressure corona discharge ionization mass spectrometry (APCDI-MS)
Most of the mass spectra were acquired using a Q Exactive Focus quadrupole-orbitrap mass spectrometer (Thermo Fisher Scientific, Bremen, Germany). The mass resolving power for this instrument was 70,000 at m/z 200 at full width at half maximum, and the measurable m/z was above 50. A TSQ Quantum Discovery MAX triple-quadrupole mass spectrometer (Thermo Fisher Scientific) was used to observe ions below m/z 50. Herein, the two mass spectrometers are abbreviated as “Q-orbitrap MS” and “TQMS.”
The analytes were positively ionized by the well-established APCDI in ambient air with a relative humidity of 50% at 298K, which were controlled using an air conditioner.14,15) The corona needle used as the point electrode was a headless stainless steel pin (Shiga, Tokyo, Japan) with a diameter of 200 μm, 20 mm in length. The needle tip had a radius of curvature of ca. 1 μm, and the shape of the needle tip surface was adequately approximated by a hyperboloid of revolution. The opposite electrode was the stainless steel orifice plate of the mass spectrometers. A positive corona discharge was generated by applying +3.7 kV between the point-to-plane electrodes with 3 mm gap. An Eppendorf microtube (1.5 mL) with each analyte was placed between the needle and the orifice plate. Analytes were diffused into the discharge region and were protonated with hydronium ion H3O+ and its water clusters H3O+(H2O)n, which were produced as the major atmospheric background ions in APCDI. This protonation mechanism was analogous to the APCI-like ambient ionization technique, such as direct analysis in real time.16)
In the CID experiments, the width for the selected precursor ions for the Q-orbitrap MS and TQMS was ca. ±0.4 Da and ±1 Da, respectively. The target gas was N2 for the Q-Orbitrap MS and Ar for the TQMS. The collision energies in the laboratory were 10–20 eV for both the instruments. In use of 10 eV, ion dissociation was observed at approximately the minimum energies.
3. RESULTS AND DISCUSSION
3.1. Ionization and fragmentation patterns
3.1.1. Alkanoic acids
Table 1 summarizes the major ions and corresponding intensities detected in the positive-ion APCDI mass spectra of seven alkanoic acids (R1COOH; R1=C1–7H3–15). Individual analytes were detected dominantly as protonated molecules [R1COOH+H]+ and NH4+ adducts [R1COOH+NH4]+. In using the APCI-like (i.e., plasma-based) ambient ionization technique, ammonium ion, NH4+, can be easily formed as the background ion from air constituents and can attach to heteroatoms in analyte molecules.17) Notably, H2O loss from the protonated molecules, [R1COOH+H–H2O]+, was observed at a significantly low intensity (≤5% relative to the protonated molecules, as shown in Table 1). For the PTR-MS, relatively high intensities of H2O loss were observed (92%, 47%, 32%, 34%, and 60% from the protonated molecules of the alkanoic acids with R1=CH3, C2H5, C3H7, C4H9, and C5H11, respectively).18) This indicates that the APCDI-MS is a softer ionization technique than the PTR-MS.
The CID experiments were performed for the protonated molecules [R1COOH+H]+. The CID spectra obtained at a collision energy of 10 eV are shown in Fig. 1. The fragmentation patterns varied depending on the carbon chain length of R1. When the carbon chain was short (R1=C1–3H3–7), H2O loss was dominant to form acylium ion, R1CO+ (product ions in red color in Fig. 1a–1c). Furthermore, CO was lost from the R1CO+ ion with R1 larger than C3H7 (product ions in green color in Fig. S1a in the Supplementary Information and Fig. 1d and 1e). For the relatively long carbon chain (R1=C4–7H9–15), the loss of CnH2n (n≥2), originating from a part of the alkyl group in R1, became more dominant than the loss of H2O+CO. The resulting product ions, [R1COOH+H–CnH2n]+ (blue color in Fig. 1d–1g) have the same chemical structure as the protonated molecules of relatively small alkanoic acids. For example, the product ions at m/z 89 (assigned as C4H9O2+) observed in the CID spectra for [C4–7H9–15COOH+H]+ (Fig. 1d–1g) corresponded with protonated butanoic acid. This is evidenced by the similarity of the CID spectral patterns between the C4H9O2+ at m/z 89 originating from [C5–7H11–15COOH+H]+ (which were obtained in combination with in-source CID, as shown in Fig. S2a) and the protonated butanoic acid (Fig. 1c). Among the product ions [R1COOH+H–CnH2n]+ observed from various precursor ions, C4H9O2+ at m/z 89 (i.e., protonated butanoic acid) was dominant, thereby indicating its significant stability.
Fig. 1. CID spectra of protonated molecules for seven alkanoic acids (R1COOH) obtained at a collision energy of 10 eV; (a) acetic acid, (b) propanoic acid, (c) butanoic acid, (d) pentanoic acid, (e) hexanoic acid, (f) heptanoic acid, and (g) octanoic acid. All the spectra other than those of acetic acid (A) were acquired by the Q-orbitrap MS, whereas acetic acid spectra were obtained by the triple-quadrupole mass spectrometer. Mass spectral data for ion species with relative intensities higher than 1.5% are summarized in Table S1. CID, collision-induced dissociation; MS, mass spectrometry. The spectrum data files are available in J-STAGE Data. https://doi.org/10.50893/data.massspectrometry.23591499.

With increasing collision energies, fragmentation proceeded, resulting in higher intensities of product ions formed from secondary dissociation. As an example, CID spectra of protonated pentanoic acid [C4H9COOH+H]+ obtained at collision energies of 15 and 20 eV are shown in Fig. S3a.
3.1.2. Methyl esters
The ionization and fragmentation patterns for methyl esters were considerably similar to those for the alkanoic acids described earlier. The methyl esters (R1COOCH3) were ionized as protonated molecules, [R1COOCH3+H]+, and NH4+ adducts, [R1COOCH3+NH4]+ (Table 2). The dominant fragmentation pattern of the [R1COOCH3+H]+ ions with relatively short carbon chains of R1 (R1=C1–4H3–9) was the loss of CH3OH to form the acylium ion, R1CO+ (red color in Fig. 2a–2d). Furthermore, as the carbon chain became longer, CO loss occurred successively (product ions in green color in Fig. S1b in the Supplementary information and Fig. 2d). For protonated methyl hexanoate (R1=C5H11) with middle length of carbon chain, the loss of alkyl fragments, CnH2n, from R1 (n≥2), as well as CH3OH+CO, was observed (product ions in blue vs. red+green color in Fig. 2e). Protonated methyl esters with relatively long carbon chains (R1=C6,7H13,15) dominantly dissociated CnH2n to form product ions [R1COOCH3+H–CnH2n]+, as compared with the loss of CH3OH+CO (Fig. 2f and 2g). The product ions [R1COOCH3+H–CnH2n]+ were identical to the protonated molecules of relatively small methyl esters, evidenced by the similarity of their CID spectral patterns (Fig. S2b). Higher collision energies progressed fragmentation in which intensities of product ions formed by secondary dissociation were increased (see CID spectra of protonated methyl valerate [C4H9COOCH3+H]+ obtained at collision energies of 15 and 20 eV shown in Fig. S3b).
Fig. 2. CID spectra of protonated molecules for seven methyl esters (R1COOCH3) obtained at a collision energy of 10 eV; (a) methyl acetate, (b) methyl propionate, (c) methyl butyrate, (d) methyl valerate, (e) methyl hexanoate, (f) methyl heptanoate, and (g) methyl octanoate. All the spectra other than those of methyl acetate (A) were acquired by the Q-orbitrap MS, whereas the methyl acetate spectra were obtained by the triple-quadrupole mass spectrometer. Mass spectral data for ion species with relative intensities higher than 1.5% are summarized in Table S1. CID, collision-induced dissociation; MS, mass spectrometry. The spectrum data files are available in J-STAGE Data. https://doi.org/10.50893/data.massspectrometry.23591574.

3.1.3. Esters other than methyl ester
Esters other than methyl esters (R1COOR2; R2≠H, CH3) were ionized as protonated molecules [R1COOR2+H]+ and NH4+ adducts [R1COOR2+NH4]+ as with the alkanoic acids and methyl esters (Table 3). Additionally, fragment ions due to the dissociation of [R2–H] or R1COOH from the protonated molecules, i.e., [R1COOH+H]+ or R2+, were observed with relatively high intensities (Table 3). Those fragment ions originated from McLafferty rearrangement19) and are dominant product ions in the CID spectra of the protonated molecules (red and blue colors in Fig. 3). Furthermore, secondary dissociation from the product ions [R1COOH+H]+ was observed (product ions in yellow color in Fig. 3), with similar CID patterns of the protonated alkanoic acids, as shown in Fig. 1. If the proton transfers to the fragment [R2–H], the product ion R2+ is detected. Higher collision energies resulted in progress of secondary dissociation (see CID spectra of protonated propyl propionate [C2H5COOC3H7+H]+ obtained at collision energies of 15 and 20 eV shown in Fig. S3c).
Fig. 3. CID spectra of protonated molecules for ten esters other than methyl esters (R1COOR2; R2≠H, CH3) obtained at a collision energy of 10 eV; (a) propyl propionate, (b) isopropyl propionate, (c) butyl propionate, (d) isobutyl propionate, (e) hexyl acetate, (f) ethyl hexanoate, (g) propyl hexanoate, (h) butyl hexanoate, (i) amyl hexanoate, and (j) isoamyl hexanoate. The secondary dissociation from product ions CxH2x+1O2+ (in red color) was confirmed by CID with in-source CID (Fig. S2c). Mass spectral data for ion species with relative intensities higher than 1.5% are summarized in Table S1. CID, collision-induced dissociation; MS, mass spectrometry. The spectrum data files are available in J-STAGE Data. https://doi.org/10.50893/data.massspectrometry.23591583.

Notably, in the CID spectra obtained here, the intensities of the precursor ions at the lowest collision energy of 10 eV were considerably low (approximately zero) for all the esters. These results suggest that the protonated esters (R2≠H, CH3) can easily dissociate the R2 part to form the protonated alkanoic acids including the R1 part, which is independent of the carbon chain length of R2.
3.2. Discrimination of isomeric compounds
The systematic ionization and fragmentation patterns described earlier allow us to distinguish the isomeric compounds of alkanoic acids, methyl esters, and other esters. First, suppose that a protonated molecule and NH4+ adduct of an unknown CmH2mO2 with an m number less than or equal to 3 (m≤3) is detected in a mass spectrum. If the CID of the protonated molecule [CmH2mO2+H]+ leads to the detection of a product ion resulting from the loss of H2O or CH3OH, CmH2mO2 can be identified as an alkanoic acid or methyl ester; if neither H2O nor CH3OH is lost, CmH2mO2 should be esters other than methyl ester.
Next, suppose that an unknown CmH2mO2 has an m number greater than 4 (m≥4). If the CID of its protonated molecule generates product ions resulting from CH3OH loss, the CmH2mO2 is determined as a methyl ester; no loss of CH3OH indicates other ester or alkanoic acid. CmH2mO2 can be distinguished as an ester or an alkanoic acid by determining the intensity of the precursor ion [CmH2mO2+H]+ in the CID spectrum. If the relative intensity of [CmH2mO2+H]+ is considerably low (<5%), CmH2mO2 should be an ester. Differences in precursor ion intensity are clearly seen when the collision energy is low such as 10 eV. Therefore, it is preferable to use low collision energy for discrimination of isomers focused in this study.
If there is only the protonated molecule of CmH2mO2 (not NH4+ adduct), the [CmH2mO2+H]+ should be a fragment from the protonated molecule of esters other than methyl esters. In this case, we should check whether [CmH2mO2+H]+ and [CmH2mO2+NH4]+ originating from esters are in high m/z regions.
4. CONCLUSIONS
This study provided some basic data on isomeric esters and alkanoic acids with elemental composition of CmH2mO2 measured by APCDI-CID-MS in the positive-ion mode. We explained that there are general rules for the ionization and fragmentation patterns of protonated molecules for those compounds, which makes it possible to distinguish the isomers. These rules should enable the development of real-time measurement techniques that can detect various compounds simultaneously but distinguish isomers; furthermore, they will contribute to aroma research in the future.
Supplementary Information
Figure S1. CID spectra of the protonated molecules of (a) butanoic acid and (b) methyl butyrate obtained by the TQMS
Figure S2. Pseudo MS3 spectra obtained by combining in-source CID (40 V) with CID; (a) the precursor ion is C4H9O2+ from protonated heptanoic acid. The resulting spectral pattern is analogous to that for protonated butanoic acid [C3H7COOH + H]+ (Fig. 1c). (b) The precursor ion is C5H11O2+ from protonated methyl heptanoate. The resulting spectral pattern is analogous to that for protonated methyl butyrate [C3H7COOCH3 + H]+ (Fig. 2c). (c) The precursor ion is C6H13O2+ from protonated amyl hexanoate. The resulting spectral pattern is analogous to that for protonated hexanoic acid [C5H11COOH + H]+ (Fig. 1e).
Figure S3. CID spectra of protonated molecules for (a) pentanoic acid, (b) methyl valerate, (c) propyl propionate obtained at collision energies of 15 and 20 eV.
Table S1. CID spectral data shown in Figures 1–3 in the main text. Ion species with relative intensities higher than 1.5% are listed.
ACKNOWLEDGMENT
This work was supported by JSPS KAKENHI grant numbers JP21K19111, JP21K12223, and JP23H04969.
Mass Spectrom (Tokyo) 2023; 12(1): A0127
REFERENCES
- 1).D. Holland, O. Larkov, I. Bar-Yaákov, E. Bar, A. Zax, E. Brandeis, U. Ravid, E. Lewinsohn. Developmental and varietal differences in volatile ester formation and acetyl-CoA: Alcohol acetyl transferase activities in apple (Malus domestica Borkh.) fruit. J. Agric. Food Chem. 53: 7198–7203, 2005. [DOI] [PubMed] [Google Scholar]
- 2).R. G. Berger. Flavours and Fragrances – Chemistry, Bioprocessing and Sustainability; Springer-Verlag, Berlin, Germany, 2007. [Google Scholar]
- 3).F. Tanaka, K. Okazaki, T. Kashimura, Y. Ohwaki, M. Tatsuki, A. Sawada, T. Ito, T. Miyazawa. Profiles and physiological mechanisms of sensory attributes and flavor components in watercored apple. Nippon Shokuhin Kagaku Kogaku Kaishi 63: 101–116, 2016. (in Japanese). [Google Scholar]
- 4).M. A. M. El Hadi, F.-J. Zhang, F.-F. Wu, C.-H. Zhou, J. Tao. Advances in fruit aroma volatile research. Molecules 18: 8200–8229, 2013. [DOI] [PMC free article] [PubMed] [Google Scholar]
- 5).C. B. Steingass, R. Carle, H.-G. Schmarr. Ripening-dependent metabolic changes in the volatiles of pineapple (Ananas comosus (L.) Merr.) fruit: I. Characterization of pineapple aroma compounds by comprehensive two-dimensional gas chromatography-mass spectrometry. Anal. Bioanal. Chem. 407: 2591–2608, 2015. [DOI] [PubMed] [Google Scholar]
- 6).C. B. Steingass, M. Jutzi, J. Muller, R. Carle, H.-G. Schmarr. Ripening-dependent metabolic changes in the volatiles of pineapple (Ananas comosus (L.) Merr.) fruit: II. Multivariate statistical profiling of pineapple aroma compounds based on comprehensive two-dimensional gas chromatography-mass spectrometry. Anal. Bioanal. Chem. 407: 2609–2624, 2015. [DOI] [PubMed] [Google Scholar]
- 7).A. Muto, C. T. Muller, L. Bruno, L. McGregor, A. Ferrante, A. A. C. Chiappetta, M. B. Bitonti, H. J. Rogers, N. D. Spadafora. Fruit volatilome profiling through GC × GC-TOF-MS and gene expression analyses reveal differences amongst peach cultivars in their response to cold storage. Sci. Rep. 10: 18333, 2020. [DOI] [PMC free article] [PubMed] [Google Scholar]
- 8).X. Song, L. Zhu, X. Geng, Q. Li, F. Zheng, Q. Zhao, J. Ji, J. Sun, H. Li, J. Wu, M. Zhao, B. Sun. Analysis, occurrence, and potential sensory significance of tropical fruit aroma thiols, 3-mercaptohexanol and 4-methyl-4-mercapto-2-pentanone, in Chinese Baijiu. Food Chem. 363: 130232, 2021. [DOI] [PubMed] [Google Scholar]
- 9).F. Ciesa, I. Höller, W. Guerra, J. Berger, J. Dalla Via, M. Oberhuber. Chemodiversity in the fingerprint analysis of volatile organic compounds (VOCs) of 35 old and 7 modern apple cultivars determined by proton-transfer-reaction mass spectrometry (PTR-MS) in two different seasons. Chem. Biodivers. 12: 800–812, 2015. [DOI] [PubMed] [Google Scholar]
- 10).T. Bianchi, Y. Weesepoel, A. Koot, I. Iglesias, I. Eduardo, M. Gratacos-Cubarsi, L. Guerrero, M. Hortos, S. van Ruth. Investigation of the aroma of commercial peach (Prunus persica L. Batsch) types by proton transfer reaction-mass spectrometry (PTR-MS) and sensory analysis. Food Res. Int. 99: 133–146, 2017. [DOI] [PubMed] [Google Scholar]
- 11).W. Lindinger, A. Hansel, A. Jordan. On-line monitoring of volatile organic compounds at PPTV levels by means of proton-transfer-reaction mass spectrometry (PTR-MS) medical applications, food control and environmental research. Int. J. Mass Spectrom. Ion Process. 173: 191–241, 1998. [Google Scholar]
- 12).B. Yuan, A. R. Koss, C. Warneke, M. Coggon, K. Sekimoto, J. de Gouw. Proton-transfer-reaction mass spectrometry: Applications in atmospheric sciences. Chem. Rev. 117: 13187–13229, 2017. [DOI] [PubMed] [Google Scholar]
- 13).K. Sekimoto, A. R. Koss. Modern mass spectrometry in atmospheric sciences: Measurement of volatile organic compounds in the troposphere using proton-transfer-reaction mass spectrometry. J. Mass Spectrom. 56: e4619, 2021. [DOI] [PubMed] [Google Scholar]
- 14).K. Sekimoto, M. Takayama. Negative ion formation and evolution in atmospheric pressure corona discharges between point-to-plane electrodes with arbitrary needle angle. Eur. Phys. J. D 60: 589–599, 2010. [Google Scholar]
- 15).K. Sekimoto, M. Sakai, M. Takayama. Specific interaction between negative atmospheric ions and organic compounds in atmospheric pressure corona discharge ionization mass spectrometry. J. Am. Soc. Mass Spectrom. 23: 1109–1119, 2012. [DOI] [PubMed] [Google Scholar]
- 16).R. B. Cody, J. A. Laramee, H. D. Durst. Versatile new ion source for the analysis of materials in open air under ambient conditions. Anal. Chem. 77: 2297–2302, 2005. [DOI] [PubMed] [Google Scholar]
- 17).T. Zhang, W. Zhou, W. Jin, J. Zhou, E. Handberg, Z. Zhu, H. Chen, Q. Jin. Direct desorption/ionization of analytes by microwave plasma torch for ambient mass spectrometric analysis. J. Mass Spectrom. 48: 669–676, 2013. [DOI] [PubMed] [Google Scholar]
- 18).E. von Hartungen, A. Wisthaler, T. Mikoviny, D. Jaksch, E. Boscaini, P. J. Dunphy, T. D. Märk. Proton-transfer-reaction mass spectrometry (PTR-MS) of carboxylic acids: Determination of Henry’s law constants and axillary odour investigations. Int. J. Mass Spectrom. 239: 243–248, 2004. [Google Scholar]
- 19).E. Aprea, F. Biasioli, T. D. Märk, F. Gasperi. PTR-MS study of esters in water and water/ethanol solutions: Fragmentation patterns and partition coefficients. Int. J. Mass Spectrom. 262: 114–121, 2007. [Google Scholar]
Associated Data
This section collects any data citations, data availability statements, or supplementary materials included in this article.
Supplementary Materials
Figure S1. CID spectra of the protonated molecules of (a) butanoic acid and (b) methyl butyrate obtained by the TQMS
Figure S2. Pseudo MS3 spectra obtained by combining in-source CID (40 V) with CID; (a) the precursor ion is C4H9O2+ from protonated heptanoic acid. The resulting spectral pattern is analogous to that for protonated butanoic acid [C3H7COOH + H]+ (Fig. 1c). (b) The precursor ion is C5H11O2+ from protonated methyl heptanoate. The resulting spectral pattern is analogous to that for protonated methyl butyrate [C3H7COOCH3 + H]+ (Fig. 2c). (c) The precursor ion is C6H13O2+ from protonated amyl hexanoate. The resulting spectral pattern is analogous to that for protonated hexanoic acid [C5H11COOH + H]+ (Fig. 1e).
Figure S3. CID spectra of protonated molecules for (a) pentanoic acid, (b) methyl valerate, (c) propyl propionate obtained at collision energies of 15 and 20 eV.
Table S1. CID spectral data shown in Figures 1–3 in the main text. Ion species with relative intensities higher than 1.5% are listed.