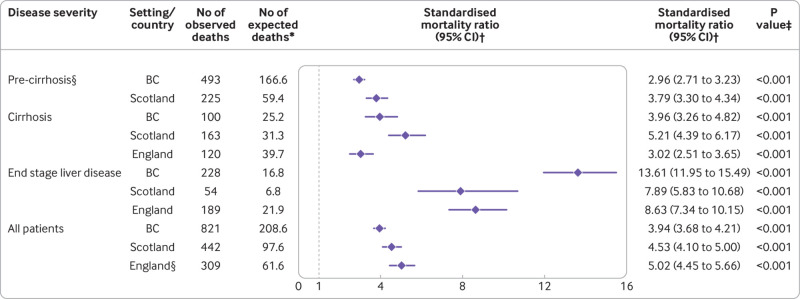
Fig 3.
Standardised mortality ratio for all cause mortality by setting and liver disease severity. *Expected deaths indicates the number of deaths that would have occurred if people who had been successfully treated for hepatitis C had the same age-sex-year specific mortality rates as the corresponding general population. †Standardised mortality ratio is the ratio of observed to expected deaths; values >1 indicate excess mortality (number of observed deaths exceed number of expected deaths). ‡Null hypothesis is that standardised mortality ratio=1 (dashed line). §Mortality data for patients without cirrhosis (pre-cirrhosis) were not available for England cohort. 95% CI=95% confidence interval; BC=British Columbia

