

Abstract
BACKGROUND:
Promacta (eltrombopag; EPAG) and Nplate (romiplostim; ROMI) have not been compared in head-to-head trials for treatment of chronic immune thrombocytopenia (cITP); however, indirect treatment comparisons have indicated similar efficacy and safety outcomes, and the drugs are generally accepted as therapeutic alternatives.
OBJECTIVE:
To determine which of the 2 therapies would result in the lowest overall cost from a US health plan perspective, under the assumption of equivalent clinical efficacy and safety.
METHODS:
A cost-minimization model was developed in Microsoft Excel. The model incorporated only costs that differ between the treatments, including drug acquisition, administration, and monitoring costs, over a 52-week horizon. Average dosing for EPAG and ROMI was taken from the long-term EXTEND trial and from a published metaanalysis of 14 clinical trials, respectively. ROMI is injectable and EPAG is oral, so only ROMI had administration costs. The model assumed patients used 25 mg EPAG tablets and the 250 μg vial size of ROMI. ROMI wastage was included in drug acquisition costs by rounding up average dose to the nearest whole vial. Monitoring requirements were determined from US prescribing information, with platelet monitoring assumed equal, and hepatic panel testing every 4 weeks for EPAG. The model was adjustable to commercial, Medicare, and Medicaid plan perspectives, with optional inclusion of drug wastage, monitoring, or administration costs.
RESULTS:
The base case used a commercial plan perspective, with average dosing of 51.5 mg/day for EPAG and 4.20 μg/kg/week for ROMI. The analysis found a cost difference per treated patient of $64,770 in favor of EPAG on an annual basis. Breakdown by unique costs for EPAG included drug-acquisition cost of $123,135 and monitoring cost of $705. Breakdown by unique costs for ROMI included drug-acquisition cost of $183,234, with wastage of $63,179 and administration cost of $5,377. Based on a hypothetical commercial plan with 1 million members and an estimated 11 patients with cITP receiving ROMI, potential annual savings for switching all patients from ROMI to EPAG is $712,473 or $0.06 per member per month. EPAG remained the less costly option for all plan types and assumptions. A sensitivity analysis found that the result was most sensitive to drug pricing and wastage inputs.
CONCLUSIONS:
Because of lower drug-acquisition costs (including drug wastage) and administration costs, treatment of cITP with EPAG is associated with a lower net cost per patient than ROMI.
What is already known about this subject
Two frequently prescribed thrombopoietin-receptor agonists, eltrombopag (EPAG) and romiplostim (ROMI), have not been compared in head-to-head trials for the treatment of chronic immune thrombocytopenia (cITP); however, they are generally accepted as therapeutic alternatives with comparable safety and efficacy.
A cost-consequence analysis conducted in 2018 found that EPAG (tablets for oral use) was less costly than ROMI (for subcutaneous injection) on a 26-week basis in treating adult patients with cITP refractory to primary therapy.
What this study adds
A cost-minimization analysis, assuming equivalent safety and efficacy, found EPAG was associated with a lower net cost ($64,770 less costly using commercial plan costing) on an annual basis per adult patient than ROMI, driven by lower drug wastage and administration costs.
Based on a hypothetical 1 million-member US commercial plan with 11 adult patients receiving ROMI, potential annual savings of switching from ROMI to EPAG were $712,473, or $0.06 per member per month (PMPM).
Study findings showed that under Medicare and Medicaid costing, the cost difference per adult patient was $67,427 and $42,681, respectively, in favor of EPAG.
Chronic immune thrombocytopenia (cITP) is an autoimmune disorder characterized by low blood platelet counts lasting longer than 12 months that often lead to bruising and excessive bleeding.1 The prevalence of cITP in the United States was found to be between 7.1 and 9.5 per 100,000 persons, with prevalence increasing with age and females experiencing the condition more often than males.2 Bleeding risks, such as intracranial hemorrhages, represent the most serious complications for those with the disease.1 Initial therapy for cITP involves corticosteroids, intravenous immunoglobulin G, or anti-D immune globulin, all of which aim to reduce platelet destruction by macrophages.1 Patients refractory to these treatments move to second-line treatments, which include rituximab, splenectomy, and thrombopoietin receptor agonists (TPO-RAs) such as romiplostim (ROMI), a 14-amino-acid peptide for subcutaneous administration, and eltrombopag (EPAG), an orally bioavailable small molecule.1,3 Unlike first-line treatments that aim to reduce platelet destruction, TPO-RAs activate TPO receptors on hematopoietic tissues, thereby inducing increased platelet production.1 EPAG and ROMI are both indicated for the treatment of patients with ITP (EPAG for cITP specifically) who have had an insufficient response to corticosteroids, immunoglobulins, or splenectomy. EPAG is administered at 50 mg once daily for patients aged 6 years and older, with a lower starting dose for patients with hepatic impairment and for some patients of East Asian ancestry.4 The EPAG dose is adjusted to maintain a patient platelet count at least 50 × 109/L, to a maximum dose of 75 mg per day.4 ROMI is administered as a 1 μg/kg subcutaneous injection once weekly.5 The weekly dose of ROMI is adjusted by increments of 1 μg/kg up to a maximum of 10 μg/kg, until the patient achieves a platelet count at least 50 × 109/L; however, if the platelet count exceeds 200 × 109/L for 2 consecutive weeks, the dose is reduced by 1 μg/kg.5 Patients receiving EPAG should have liver function monitored before and during therapy.4 Portal vein thrombosis has been reported in patients with chronic liver disease receiving either EPAG or ROMI.4,5
Considering that those hospitalized for ITP stay an average of 6.0 days (28% longer than the overall US discharge population) and spend an average of $16,594 (2017 US dollars [USD]) per hospitalization (48% more than the overall US discharge population), comparisons of the cost of available treatments are useful in providing information to help allocate resources to manage this condition more efficiently.6
A cost-effectiveness analysis from a UK perspective showed EPAG dominated ROMI in most sensitivity analyses, and was cost-effective when indirect efficacy estimates were included in the model.7 Nonetheless, these results may not hold in the US setting, given differences in costs and clinical practice. A US cost-consequence analysis comparing the 2 drugs was conducted in 2018; however, that analysis used a short time horizon (26 weeks), constrained by the length of pivotal trial data. As there are clearly dose-adjustment periods for both drugs and dose-titration profiles differ between the two, these data are not fully generalizable to long-term usage and dosing. Additionally, the general US payer perspective of the cost-consequence model could usefully be extended to specific Medicaid, commercial, or Medicare populations.8
Another US cost-consequence analysis comparing these drugs—also published in 2018—found that while EPAG was less costly than ROMI, ROMI yielded a lower incremental cost-effectiveness ratio due to a slightly higher estimate of treatment efficacy.9 Longer-term trial extension and observational data now exist for both drugs that could be used as inputs to confirm that these cost differences are valid for long-term use.10,11 Given the longer-term data are based partly on trial-extension periods and observational data, confidence in differences in efficacy data may be lower than when using clinical trial data.
A targeted literature review conducted in July 2019 revealed only 1 head-to-head trial comparing the safety and efficacy of EPAG and ROMI. This trial extended for only 2 weeks and was insufficiently powered (N = 13) to detect a significant clinical difference.12 Indirect treatment comparisons found no significant difference in safety and efficacy of the 2 drugs.13-15 Given this, assuming clinical equivalence may be a reasonable, and useful, simplifying assumption. Cost-minimization models are an appropriate design under that assumption, specifically when “two therapies embody a near-identical technology (eg, drugs of the same pharmacological class).”16 Therefore, a cost-minimization analysis (CMA) was developed, comparing EPAG with ROMI in the treatment of adult cITP to determine the least costly TPO-RA for long-term usage, for several typical US formulary types. The model also extends the analysis with the first assessment of potential cost impact on a hypothetical million-member health plan, which may be achieved by switching patients to the less expensive treatment.
Methods
MODEL OVERVIEW
The target population analyzed in this CMA was adults (aged ≥ 18 years) with cITP who were candidates for systemic therapy and had an insufficient response to first-line treatments (eg, corticosteroids, immunoglobulins, or splenectomy). The CMA was conducted using a 52-week time horizon. As the time horizon chosen is exactly 1 year, no discounting was required.
The CMA was conducted from the perspective of a US health plan. Drug acquisition, drug wastage, administration, and monitoring costs were all calculated in 2019 USD. Separate results were evaluated for commercial, Medicare, and Medicaid plans. Only unique costs associated with each drug were considered. Working under the assumption of equivalent safety and efficacy, all other cost inputs, including hospitalization, outpatient, bleeding event, and rescue medication costs, were assumed identical for both treatments.
The model’s patient flow for the commercial plan setting is summarized in Figure 1, and the calculation structure for the CMA to calculate the cost difference per treated patient is detailed in Figure 2.
FIGURE 1.

Patient Flow
FIGURE 2.
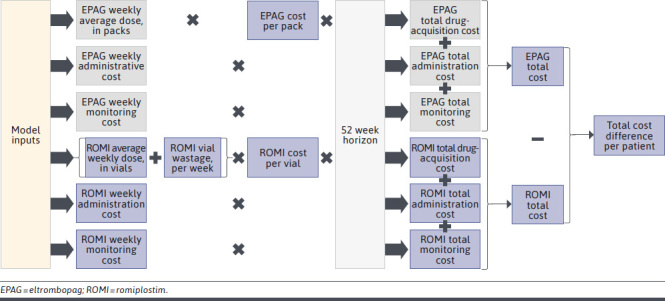
Model Structure
MODEL INPUTS
Drug Dosing.
Mean dosing inputs per patient were obtained from largest available long-term trial dosing data. EPAG mean dose (in mg) was obtained from the extension period of the pivotal clinical trial (EXTEND), and ROMI mean dose (in μg/kg) came from a published meta-analysis of 14 clinical trials.10,11 A meta-analysis was identified for primarily long-term use for ROMI, but not for EPAG. Real-world studies presenting data on EPAG and ROMI average dosage in a US context were not identified; however, the dose employed in this model matches the values used in other models.9 Patients were included in the model on a prevalence basis and were assumed to have undergone an initial dose-stabilization period. Average patient weight was taken from the ROMI pivotal trial, as this figure was not available in the ROMI meta-analysis.17 Units per pack, dosing frequency per week, and route of administration were sourced from the US prescribing information for each treatment.4,5
Drug Pricing.
Drug price inputs used either Medicare wholesale acquisition cost (WAC) or average sales price (ASP). WAC was from IBM’s RED BOOK Micromedex (EPAG $4,926.47 per pack of 30 × 25 mg tablets, ROMI $1,858.58 per 250 μg vial), and ASP was from the Centers for Medicare & Medicaid Services (CMS) website (ROMI $73.51 per 10 μg, equivalent to $1,837.63 per 250 μg vial).18,19 Since EPAG is an oral drug not reimbursed under Medicare Part B, ASP was not available. EPAG in 50 mg or 75 mg tablets is $0.63 less expensive per mg than 25 mg tablets.19 According to the prescribing information, dosing titration usually occurs in 25 mg steps; as such, we assume physicians would most commonly use the 25 mg strength EPAG tablets.4 Originally, ROMI was only available in 250/500 μg vial sizes in the United States, and we did not find pricing information for any other vial sizes in the United States in 2019; however, a 125 μg vial is now available, and we have included this as a scenario analysis (ROMI vials have a constant price per μg).19
Average dosing for EPAG (mg) and ROMI (vials) was used to calculate the required number of packs/vials of each drug over 52 weeks. Wastage calculations for each therapy depended on the route of administration. For EPAG, dosing is typically in multiples of 25 mg pills, there is no short-term expiry, and it was assumed that there was no drug wastage either during or at the end of treatment. For ROMI, dose calculations are weight-based, most likely using a fraction of the final vial, while excess remaining drug volume cannot be safely stored and reused.5 Wastage was calculated by rounding up the mean weekly dose to the nearest whole vial.
Drug prices obtained from Medicare sources were adjusted to commercial and Medicaid plan pricing. The Medicaid-to-Medicare pharmacy cost ratio of 59% was obtained from a 2014 US Government Accountability Office report.20 Under WAC pricing, commercial and Medicare prices were assumed equal. Under ASP pricing, commercial was 95.9% of Medicare, due to Medicare Part B bundle pricing.21
Administration and Monitoring Costs.
Administration cost for oral treatment (EPAG) was assumed to be zero. Administration cost per use for injectable treatments (ROMI) was based on Medicare CPT code 96401 “chemotherapy administration, subcutaneous or intramuscular, non-hormonal anti-neoplastic,” at $80.73.22 Under ASP pricing for Medicare, administration costs were assumed included in the bundled rate. Under WAC pricing for Medicare, or under ASP for any other plan type, administration costs were included separately.
Platelet-monitoring costs (and associated office visit costs) were assumed to be equivalent for the comparators, and therefore not included.4,5 Cost for hepatic enzyme monitoring, specified for EPAG on a monthly basis during the stable dosing period,4,23 was based on Medicare CPT code 80076 “hepatic function panel,” Medicare billed rate of $40.96 in 2017.24 The cost of an office visit was not included for hepatic monitoring, as the patient was assumed to be already attending the office for regular platelet monitoring.
To adjust medical procedure costs from Medicare to commercial and Medicaid plans, cost ratios were identified for Medicaid to Medicare (66%) and commercial to Medicare (128%).25,26 All prices were inflated to 2019 USD using the medical component of the Consumer Price Index.27
Estimated Size of the Treated Population.
The model estimated the number of adult patients currently receiving ROMI in a default 1 million-member plan. The proportion of adults in each plan was sourced from the US Census Bureau and the CMS.28,29 The entire Medicare population was assumed to be aged 18 years or older. Commercial populations were assumed to all be aged younger than 65 years. The prevalence of cITP in adults was based on a 2008 US claims analysis in which separate rates were reported for adults aged older and younger than 65 years.2 The overall prevalence rate in the model was calculated based on the proportion of patients aged older and younger than 65 years in the plan type.29,30 The proportion of patients refractory to primary therapy was based on a 2010 review of studies on sustained response rates (SR) for dexamethasone (median SR 67.6% over 2-5 years) and methylprednisolone (23% at 39 months),31-35 using the mean of these 2 figures (45.3%). For ROMI market share as a second-line treatment for cITP, an estimate of 17% was used (data on file, Novartis Pharmaceuticals Corporation, Novartis Market Share, 2019).
A summary of model inputs outlining base-case values can be found in Supplementary Table 1 (14.7KB, pdf) (available in online article).
MODEL OUTPUTS
Cost Difference per Treated Patient.
The main model output was the cost difference per treated patient. Weekly drug acquisition, administration, and monitoring cost inputs for each drug were multiplied by the 52-week time horizon and summed to give a total for unique costs. The cost difference per treated patient was calculated as the difference in unique costs between the 2 therapies.
Net Cost Impact to a Hypothetical Health Plan.
The model estimated the number of adults in a given plan with cITP, refractory to primary therapy, who were treated with ROMI. This patient total was used to calculate the potential cost impact of switching all adult patients in a hypothetical plan taking ROMI to EPAG. By default, the population was set to 1 million members. Cost difference per treated patient was multiplied by the number of adults taking ROMI, to estimate the potential annual cost impact of shifting patients taking ROMI to EPAG. A per-member per-month (PMPM) cost impact value was also calculated.
Sensitivity/Scenario Analyses.
The sensitivity of the cost difference per treated patient was assessed by conducting a deterministic 1-way sensitivity analysis. Key model inputs including EPAG price, ROMI price, patient weight, dosing, wastage costs, administration costs, and monitoring costs were varied by plus or minus 20% to determine the sensitivity of outputs to changes in inputs.
A scenario analysis was also conducted to assess the impact of key changes to model inputs on cost difference per treated patient. These scenarios included the following: an assumption of no wastage, costs in a Medicare/Medicaid context, no administration costs, no monitoring costs, use of WAC pricing (instead of ASP), and 125 μg ROMI vial size instead of 250 μg.
Results
A summary of per-patient and plan-level base-case results is shown in Table 1. Dosage for EPAG was 360.5 mg per week, or an annual 24.99 packs of 30 × 25 mg per year, with drug acquisition cost of $123,135. Mean dosage for ROMI was 1.31 vials per week, rounded up to 2.00 vials per week, 104 vials per year, with a drug acquisition cost of $183,234. This drug acquisition cost for ROMI comprised $63,179 due to drug wastage and $120,055 excluding wastage. The total administration cost for EPAG was $0 and for ROMI was $5,377 per year. The total unique monitoring cost was $705 per year for EPAG and $0 for ROMI.
TABLE 1.
Cost Difference per Treated Patient and Potential Cost Impact, Commercial Plan Perspective
| EPAG | ROMI | |
|---|---|---|
| Cost difference per treated patient, $ | ||
| Drug-acquisition cost (52 weeks)a | 123,135 | 183,234 |
| Cost due to wastage | 0 | 63,179 |
| Administration cost (52 weeks)b | 0 | 5,377 |
| Monitoring cost (52 weeks)c | 705 | 0 |
| Total cost (52 weeks) | 123,841 | 188,611 |
| Cost difference per treated patient (ROMI minus EPAG) | 64,770 | |
| Potential budget impact | ||
| Number of patients currently taking ROMI, adultsd | 11 | |
| Potential budget impact, totale, $ | $712,473 | |
| Potential budget impact, per member per monthe, $ | $0.06 | |
aUnder Medicare ASP, ROMI administration costs are included in a bundled rate under drug costs, with a 4.3% premium. Under all other plan types and under WAC, ROMI administration costs appear separately.
bEPAG administration costs are assumed to be zero due to oral administration. ROMI is injectable, and administration costs use Medicare CPT code 96401.
cThis includes liver panel monitoring only. Platelet-monitoring costs are not included because they are assumed to be the same for both. Liver panel monitoring uses Medicare CPT code 80076 (hepatic function panel).
dNumber of patients is based on the number of patients in the plan (default 1 million), chronic ITP prevalence, proportion refractory to primary therapy, and market share of ROMI.
eThe estimated potential budget impact is calculated based on the assumption that all patients currently taking ROMI in the plan are switched to EPAG. This should be considered a maximum potential budget impact.
ASP = average sales price; CPT = Current Procedural Terminology; EPAG = eltrombopag; ITP = immune thrombocytopenia; ROMI = romiplostim; WAC = wholesale acquisition cost.
Aggregating drug acquisition, administration, and monitoring costs yielded an estimate that in a commercial plan, treating an adult patient using ROMI was $64,770 more expensive per year than treatment with EPAG. Treating an adult using ROMI was $67,427 and $42,681 more expensive per annum than treatment with EPAG for Medicare and Medicaid plans, respectively.
Based on a hypothetical commercial plan with 1 million members, 665,011 were assumed to be adults aged between 18 and 64 years, and of those, 147 had cITP. Just less than half of patients with cITP (67) were refractory to primary therapy, leaving an estimated 11 patients with cITP receiving ROMI. The total potential cost impact of switching these patients from ROMI to EPAG was $712,473 per year or $0.06 when expressed as a PMPM amount. For a hypothetical 1 million-member Medicare plan, 27 adults were assumed to be taking ROMI, increasing the potential cost impact to $1,820,525 or $0.15 PMPM. The potential cost impact decreased to $426,807 or $0.04 PMPM with Medicaid as the plan type and an assumed 10 adult patients switching from ROMI to EPAG.
SENSITIVITY ANALYSIS
A sensitivity analysis was conducted to evaluate the robustness of the calculated cost difference to variability in model parameters (Figure 3). The cost difference per treated patient was most sensitive to changes in drug pricing, with variation in wastage, administration, and monitoring costs having a smaller impact on results. Change in mean dosing had the same sensitivity as drug price for each treatment, and weight has the same variability as ROMI pricing. For a 20% plus or minus change in ROMI price, the cost difference per treated ranged between $101,417 and $28,123. For a plus or minus 20% change in EPAG price, the cost difference per treated patient ranged between $40,143 and $89,397.
FIGURE 3.

Sensitivity Analysis, Cost Difference per Treated Patient (Commercial Plan)a
SCENARIO ANALYSIS
The results of a scenario analysis are outlined in Table 2. Changing the plan type from commercial to Medicaid reduced the cost difference per treated patient to $42,681 per year. Setting wastage costs to zero resulted in a cost difference per treated patient of $1,591, a much smaller cost difference than the base-case scenario; however, even under this conservative assumption of zero wastage, EPAG remained the lower-cost treatment. Using WAC pricing for both treatments increased the cost difference to $74,829. When a 125 μg dose of ROMI was used instead of the base-case 250 μg, the cost difference per patient decreased to $18,962 due to lower vial wastage costs. In all scenarios, EPAG remained less expensive than ROMI on an annual per-patient basis.
TABLE 2.
Scenario Analysis, Cost Difference per Treated Patient
| Scenario | Cost difference per patient, $ |
|---|---|
| Baselinea | 64,770.25 |
| No wastage | 1,591.19 |
| Medicare | 67,426.84 |
| Medicaid | 42,680.68 |
| No difference in administration costs | 59,393.09 |
| No difference in monitoring costs | 65,475.63 |
| Use WAC pricing for both (commercial) | 74,828.63 |
| Romiplostim 125 μg vial | 18,961.77 |
aBase-case values reflect the following inputs: commercial plan, including wastage costs, ASP pricing for romiplostim, default values for pricing and dosage. Base case under these inputs is $64,770.
ASP = average sales price; WAC = wholesale acquisition cost.
Discussion
Given the relatively high expenditures associated with treatment and hospitalization of patients with cITP, and the long-term nature of the disease, it is important for payers to understand differences in costs associated with therapeutic alternatives, and the sources of these differences. In the case of the 2 most commonly used TPO-RA therapies EPAG and ROMI, comparison of drug prices is complicated by differences in administration, dosing methodology, dose-adjustment protocols, and different pricing mechanisms for oral and injectable therapies, which also vary between plan types (such as Medicare Part B ASP, which bundles the administration cost of injectable drugs). Accordingly, to help illuminate the total cost difference as well as sources of that difference for long-term use, our model used longer-term observational and trial extension period data to elucidate these differences.
From a commercial plan perspective, this CMA estimated that the annual saving associated with switching from ROMI to EPAG was $64,770 per patient for long-term chronic use. This cost saving for EPAG is consistent with results reported in the Tremblay et al cost-consequence model. In the baseline intent-to-treat populations of the cost-consequence model, ROMI was estimated to cost $24,480 more than EPAG over a 26-week period, with differences in drug acquisition costs driving the majority of this cost difference, and with administration costs for ROMI also contributing.8 Along with minor differences in methodology, differences between this CMA and Tremblay et al may arise due to the shorter time horizon restricted to 26-week clinical trial data that include a meaningful period of dose adjustment. EPAG was also found to be meaningfully cheaper than ROMI in a UK-based cost-effectiveness analysis, and a recent US-based cost-effectiveness analysis, which reported a base-case lifetime cost difference of $545,562, with similar efficacy.7 A US-based 2018 cost-per-response model using short-term trial inputs found that EPAG had a higher incremental cost per additional responder, but lower incremental costs than ROMI (EPAG: $31,922 vs ROMI: $33,815, 2015 USD).9 The consistent finding of lower costs associated with EPAG across several model types and regions supports the finding that EPAG is indeed the lower cost treatment for cITP.
The breakdown of cost results by type in the CMA showed that drug wastage drove a substantial portion of the difference in cost between the 2 treatments. Although the estimation of wastage based on rounding of a single figure for average dose may decrease accuracy compared with potential real-world wastage estimates, the scenario analysis highlighted that even with the unlikely assumption of no drug wastage, EPAG remained less expensive than ROMI, by $1,591. ROMI’s annual administration cost, calculated at $5,377 per patient, was also an element of the higher total cost for ROMI.
At the health plan level, this analysis also highlighted the potential cost impact if all patients currently receiving ROMI treatment are switched to EPAG. Based on a hypothetical commercial plan with 1 million members, and an expected 11 adult patients per million receiving ROMI, the plan could potentially save $712,473 annually, or $0.06 PMPM. The saving was more than doubled for a Medicare plan ($1,820,525, $0.15 PMPM).
Given that the prevalence of cITP increases with age, plans with a high proportion of older patients would be expected to save more from switching treatments both as an aggregate and on a PMPM basis.2 Moreover, the apparent higher prevalence of cITP in women indicates that plans with female-skewed gender ratios would likely benefit more from such treatment switching.2 Cost savings for a Medicaid plan were somewhat lower ($426,807, $0.04 PMPM), driven by lower pricing and a lower proportion of adult patients.
Overall, these results suggest that meaningful cost savings may be achieved, in any US plan, if patients were to be treated with EPAG rather than ROMI.
LIMITATIONS
As with any economic model, the results of this CMA depend on a number of assumptions and inputs; nonetheless, the results of the sensitivity and scenario analysis indicated that the conclusions were generally robust to changes in the underlying inputs.
The model did not adjust EPAG dosing calculations for the proportion of East Asian patients in the plan. According to the US prescribing information, East Asian patients should start with a 25 mg dose per day rather than the standard 50 mg; albeit after dose titration, this dose difference is likely to reduce or even equalize when patients are in the stable dosing period.4 Although starting doses are given in the prescribing information, data on a stable dose for long-term EPAG use in East Asian patients were not identified. As such, the model did not adjust EPAG dosing to account for East Asian ancestry. The model also does not include pediatric patients, as an exploratory analysis revealed that long-term data in the pediatric population were limited.
The pricing used for EPAG was based on the 25 mg tablet size, which is slightly higher per mg than the 50 mg and 75 mg tablet sizes. As dose changes are titrated in 25 mg intervals, the model assumed 25 mg is the most common tablet size used. In the real world, dosing is likely to be achieved with a mixture of tablet sizes including the lower-priced 50 mg and 75 mg tablets. Using this simplified tablet sizing assumption may have led to slightly overestimated EPAG costs. Another noteworthy limitation with the application of this model is that it did not account for the substantial cost due to variances in billing/reimbursement rates that may often exist on the medical benefit for ROMI in commercial lines of business. This suggests the cost savings opportunity is likely to be larger from a commercial payer perspective.
Wastage calculations for EPAG and ROMI were assumed sufficiently accurate representations of real-world wastage. It is possible that EPAG remaining in the package after the final week of treatment in the model could have been counted as wastage, or a simulated distribution of individuals taking ROMI could have yielded individualized wastage counts rather than an estimate based on average dosing. However, as demonstrated in the scenario analysis, even under the very conservative assumption of no ROMI wastage, EPAG was still the less expensive treatment.
Conclusions
Overall, this CMA found that EPAG was substantially less expensive than ROMI in treating adult patients with cITP refractory to first-line therapies. Under commercial pricing assumptions, EPAG was $64,770 lower in annual cost per treated patient than ROMI. The main drivers of this cost difference per treated patient were drug prices and vial wastage costs, with administration and monitoring having minor effects on cost. EPAG was the less expensive treatment in each scenario. Scenarios with a Medicare plan perspective or using WAC instead of ASP costing both yielded a greater cost difference between the 2 drugs. Based on a hypothetical commercial health plan with 1 million members and 11 adult patients taking ROMI, there is the potential for $712,473 annual cost savings if those patients are switched to EPAG, or $0.06 PMPM.
Further research to support or extend these findings could include head-to-head observational (or clinical) trial data, real-world evidence of drug wastage, and inclusion of a pediatric population based on longer-term trial data as the data emerge.
REFERENCES
- 1.Kahn AM, Mydra H, Nevarez A. Clinical practice updates in the management of immune thrombocytopenia. Pharm Ther. 2017;42(12):756-763. [PMC free article] [PubMed] [Google Scholar]
- 2.Feudjo-Tepie MA, Robinson NJ, Bennett D. Prevalence of diagnosed chronic immune thrombocytopenic purpura in the US: analysis of a large US claim database: a rebuttal. J Thromb Haemost. 2008;6(4):711-712. [DOI] [PubMed] [Google Scholar]
- 3.Kuter D. The biology of thrombopoietin and thrombopoietin receptor agonists. Int J Hematol. 2013;98(1):10-23. [DOI] [PubMed] [Google Scholar]
- 4.Promacta. Prescribing information. Novartis Pharmaceuticals Corporation; 2021. Accessed July 6, 2021. https://www.novartis.us/sites/www.novartis.us/files/promacta.pdf
- 5.Nplate. Prescribing information. Amgen Incorporated; 2019. 2021. Accessed July 6, 2021. https://www.pi.amgen.com/~/media/amgen/repositorysites/pi-amgen-com/nplate/np_late_pi_hcp_english.pdf
- 6.An R, Wang PP. Length of stay, hospitalization cost, and in-hospital mortality in US adult inpatients with immune thrombocytopenic purpura, 2006-2012. Vasc Health Risk Manag. 2017;13:15-21. [DOI] [PMC free article] [PubMed] [Google Scholar]
- 7.Allen R, Bryden P, Grotzinger KM, Staplelkamp C, Woods B. Cost-effectiveness of eltrombopag versus romiplostim for the treatment of chronic immune thrombocytopenia in England and Wales. Value Health. 2016;19(5):614-622. [DOI] [PubMed] [Google Scholar]
- 8.Tremblay G, Dolph M, Bhor M, Said Q, Elliot B, Briggs A. Cost-consequence model comparing eltrombopag versus romiplostim for adult patients with chronic immune thrombocytopenia. Clinicoecon Outcomes Res. 2018;10:705-713. [DOI] [PMC free article] [PubMed] [Google Scholar]
- 9.Fust D, Parthan A, Li X, et al. Cost per response analysis of strategies for chronic immune thrombocytopenia. Am J Manag Care. 2018;24(8 Spec No.):SP294-SP302. [PubMed] [Google Scholar]
- 10.Cines D, Gernsheimer T, Wasser J, et al. Integrated analysis of long term safety in patients with chronic immune thrombocytopaenia (ITP) treated with the thrombopoietin (TPO) receptor agonist romiplostim. Int J Hematol. 2015;102(3):259-270. [DOI] [PubMed] [Google Scholar]
- 11.Saleh M, Bussel J, Cheng G, et al. Safety and efficacy of eltrombopag for treatment of chronic immune thrombocytopenia: results of the long-term, open-label EXTEND study. Blood. 2013;121(3):537-545. [DOI] [PubMed] [Google Scholar]
- 12.Mitchell W, Pinheiro M, Boulad N, et al. Effect of thrombopoietin receptor agonists on the apoptotic profile of platelets in patients with chronic immune thrombocytopenia. Am J Hematol. 2014;89(12):E228-E234. [DOI] [PubMed] [Google Scholar]
- 13.Cooper K, Fitzgerald P, Dillingham K, Helme K, Akehurst R. Romiplostim and eltrombopag for immune thrombocytopenia: methods for indirect comparison. Int J Technol Assess Health Care. 2012;28(3):249-258. [DOI] [PubMed] [Google Scholar]
- 14.Zhang J, Liang Y, Ai Y, et al. Eltrombopag versus romiplostim in treatment of adult patients with immune thrombocytopenia: a systematic review incorporating an indirect-comparison meta-analysis. PLoS One. 2018;13(6):e0198504. [DOI] [PMC free article] [PubMed] [Google Scholar]
- 15.Yang R, Lin L, Yao H, Ji O, Shen Q. Therapeutic options for adult patients with previously treated immune thrombocytopenia – a systematic review and network meta-analysis. Hematology. 2019;24(1):290-299. [DOI] [PubMed] [Google Scholar]
- 16.Drummond M, Sculpher M, Claxton K, Stoddart G, Torrance G. Methods for the Economic Evaluation of Health Care Programmes. 4th ed. Oxford University Press; 2015. [Google Scholar]
- 17.Kuter D, Bussel J, Lyons R, et al. Efficacy of romiplostim in patients with chronic immune thrombocytopenic purpura: a double-blind randomised controlled trial. Lancet. 2008;371(9610):395-403. [DOI] [PubMed] [Google Scholar]
- 18.Centers for Medicare & Medicaid Services. 2019 ASP drug pricing files. 2019. Accessed August 23, 2019. https://www.cms.gov/Medicare/Medicare-Fee-for-Service-Part-B-Drugs/McrPartBDrugAvgSalesPrice/2019ASPFiles.html
- 19.IBM. Microdex RED BOOK Online. Database. 2019. Accessed October 22, 2019. https://www.ibm.com/us-en/marketplace/micromedex-red-book
- 20.United States Government Accountability Office. Comparison of DOD, Medicaid, and Medicare part D retail reimbursement. June 2014. Accessed August 23, 2019. https://www.gao.gov/products/GAO-14-578
- 21.Werble C. The Medicare Part B "buy and bill" payment structure for physician-administered drugs also influences private-sector prices. Health Affairs. August 10, 2017. Accessed June 29, 2021. https://www.healthaffairs.org/do/10.1377/hpb20171008.000171/full/
- 22.Centers for Medicare & Medicaid Services. Physician fee schedule search. 2019. Accessed August 23, 2019. https://www.cms.gov/medicare/physician-fee-schedule/search
- 23.HealthNet. Clinical policy: romiplostim (Nplate), eltrombopag (Promacta). 2016. Accessed October 22, 2019. https://www.healthnet.com/static/general/unprotected/html/national/pa_guidelines/3058.pdf
- 24.Find-a-Code. 80076 hepatic function panel - Medicare services and charges history. 2019. Accessed August 23, 2019. https://www.findacode.com/code.php?set=CPT&c=80076
- 25.Zuckerman S, Goin D, The Urban Institute . How much will Medicaid physician fees for primary care rise in 2013? Evidence from a 2012 survey of Medicaid physician fees: Kaiser Comission on Medicaid and the uninsured. December 2012. Accessed October 22, 2019. https://www.kff.org/wp-content/uploads/2013/01/8398.pdf
- 26.Fox W, Pickering J. Hospital & physician cost shift: payment level comparison of Medicare, Medicaid, and commercial payers. Milliman. December 2008. Accessed June 29, 2021. https://www.aha.org/system/files/content/00-10/081209costshift.pdf [Google Scholar]
- 27.Federal Reserve Bank of St. Louis. Consumer Price Index for all urban consumers: medical care in U.S. city average. 2019. Accessed August 23, 2019. https://fred.stlouisfed.org/series/CPIMEDSL
- 28.US Census Bureau, Population Division. Annual estimates of the resident population by single year of age and sex: April 1, 2010 to July 1, 2019. 2020. Accessed July 6, 2021. https://www.census.gov/data/tables/time-series/demo/popest/2010s-national-detail.html
- 29.Centers for Medicare & Medicaid Services. Medicaid beneficiaries by age group. 2012. Accessed September 25, 2019. https://www.cms.gov/Research-Statistics-Data-and-Systems/Computer-Data-and-Systems/MedicaidDataSourcesGenInfo/MSIS-Tables-Items/MSIS2012Table12.html?DLPage=3&DLEntries=10&DLSort=0&DLSortDir=descending
- 30.Berchick E, Hood E, Barnett J. Health insurance coverage in the United States: 2017. U.S. Census Bureau. September 12, 2018. Accessed June 29, 2021. https://www.census.gov/library/publications/2018/demo/p60-264.html
- 31.Provan D, Stasi R, Newland A, et al. International consensus report on the investigation and management of primary immune thrombocytopenia. Blood. 2010;115(2):168-186. [DOI] [PubMed] [Google Scholar]
- 32.Mazzucconi M, Fazi P, Bernasconi S, et al. Therapy with high-dose dexamethasone (HD-DXM) in previously untreated patients affected by idiopathic thrombocytopenic purpura: a GIMEMA experience. Blood. 2007;109(4):1401-1407. [DOI] [PubMed] [Google Scholar]
- 33.Alpdogan O, T BA, Ratip S, et al. Efficacy of high-dose methylprednisolone as a first-line therapy in adult patients with idiopathic thrombocytopenic purpura. Br J Haematol. 1998;103(4):1061-1063. [DOI] [PubMed] [Google Scholar]
- 34.von dem Borne AEG, Vos JJE, Pegels JG, Thomas LLM, van derLelie H. High dose intravenous methylprednisolone or high dose intravenous gammaglobulin for autoimmune thrombocytopenia. Br Med J. 1988;296(6617):249-250. [DOI] [PMC free article] [PubMed] [Google Scholar]
- 35.Cheng Y, Wong R, Soo Y, et al. Initial treatment of immune thrombocytopenic purpura with high-dose dexamethasone. N Engl J Med. 2003;349(9):831-836. [DOI] [PubMed] [Google Scholar]