

Abstract
Duloxetine (DLX) is widely used to treat major depressive disorder. Little is known about the mechanistic basis for DLX-related adverse effects (e.g., liver injury). Human CYP1A2 and CYP2D6 mainly contributes to DLX metabolism, which was proposed to be involved in its adverse effects. Here, we investigated the roles of Cyp1a2 and Cyp2d on DLX pharmacokinetic profile and tissue distribution using a Cyp1a2 knockout (Cyp1a2-KO) mouse model together with a Cyp2d inhibitor (propranolol). Cyp1a2-KO has the few effects on the systematic exposure (area under the plasma concentration–time curve, AUC) and tissue disposition of DLX and its primary metabolites. Propranolol dramatically increased the AUCs of DLX by 3 folds and 1.5 folds in WT and Cyp1a2-KO mice, respectively. Meanwhile, Cyp2d inhibitor decreased the AUC of Cyp2d-involved DLX metabolites (e.g., M16). Mouse tissue distribution revealed that DLX and its major metabolites were the most abundant in kidney, followed by liver and lung with/without Cyp2d inhibitor. Cyp2d inhibitor significantly increased DLX levels in tissues (e.g., liver) in WT and KO mice and decreases the levels of M3, M15, M16 and M17, while it increased the levels of M4, M28 and M29 in tissues. Our findings indicated that Cyp2d play a fundamental role on DLX pharmacokinetic profile and tissue distribution in mice. Clinical studies suggested that CYP1A2 has more effects on DLX systemic exposure than CYP2D6. Further studies in liver humanized mice or clinical studies concerning CYP2D6 inhibitors-DLX interaction study could clarify the roles of CYP2D6 on DLX pharmacokinetics and toxicity in human.
Keywords: Duloxetine, Cyp1a2-knockout mouse, Cyp2d inhibitor, Pharmacokinetics, Tissue distribution
1. Introduction
Duloxetine (DLX), a dual serotonin and norepinephrine reuptake inhibitor, is used to treat major depressive disorder (Bech et al., 2006; Nelson et al., 2005), to manage stress urinary incontinence (Guay, 2005; Millard et al., 2004), and to alleviate peripheral neuropathic pain (Goldstein et al., 2005; Raskin et al., 2005). Generally, DLX has shown good efficacy and tolerance in the clinic. Nevertheless, rare cases with severe adverse effects have been reported, including idiosyncratic hepatotoxicity (Bunchorntavakul and Reddy, 2017; DeSanty and Amabile, 2007), hypertension and myocardial infarction (Park et al., 2020). The knowledge concerning the mechanisms of DLX toxicity is very limited. Drugs are metabolized by detoxification pathways that evolved to protect against xenobiotics, and such metabolism influences not only the efficacy but also the safety of a drug. How DLX metabolism might influence its toxicity remains unknown (Gramec et al., 2014; Lobo et al., 2008), so exploring DLX metabolism, especially the roles of metabolic enzymes in DLX pharmacokinetic profiles, might help to understand the mechanism(s) of DLX toxicity from metabolic aspects.
Oxidation of the DLX naphthyl ring is mediated mainly by CYP1A2 and CYP2D6 in humans (Lantz et al., 2003). We have reported 39 DLX metabolites in mice and in human or mouse liver microsomes (HLM/MLM) (Qin et al., 2022). The chemical structures of DLX and its major metabolites involved in this study are presented in Fig. 1. We showed that CYP1A2 and CYP2D6 inhibitors can block the production of most oxidative metabolites in vitro (Qin et al., 2022). In the present study, we employed wild-type (WT), Cyp1a2-knockout (Cyp1a2-KO) mouse model together with Cyp2d inhibitor, propranolol, to evaluate the roles of Cyp1a2 and Cyp2d in DLX pharmacokinetic and tissue distribution. We found that the systemic exposure of DLX was slightly decreased in Cyp1a2-KO compared with those of WT mice. DLX and its metabolites showed unchanged distribution profiles in main organs like liver, kidney, brain and lung. Propranolol, a mechanism-based human and mouse Cyp2d inhibitor (Tolledo et al., 2020), significantly elevated DLX systemic exposure and tissue concentration in both WT and Cyp1a2-KO mice. This study comprehensively evaluated the contribution of Cyp1a2 and Cyp2d to pharmacokinetic profile and tissue distribution of DLX and its major metabolites in mice. Our findings indicated that Cyp2d plays a dominant role in the DLX metabolism in mice. Further studies in liver humanized mice or initiating a clinical DLX-drug interaction study related to CYP2D6 could be valuable to clarify its role in the metabolism of DLX in human subjects.
Fig. 1. Chemical structures of DLX and its major metabolites involved in this study.
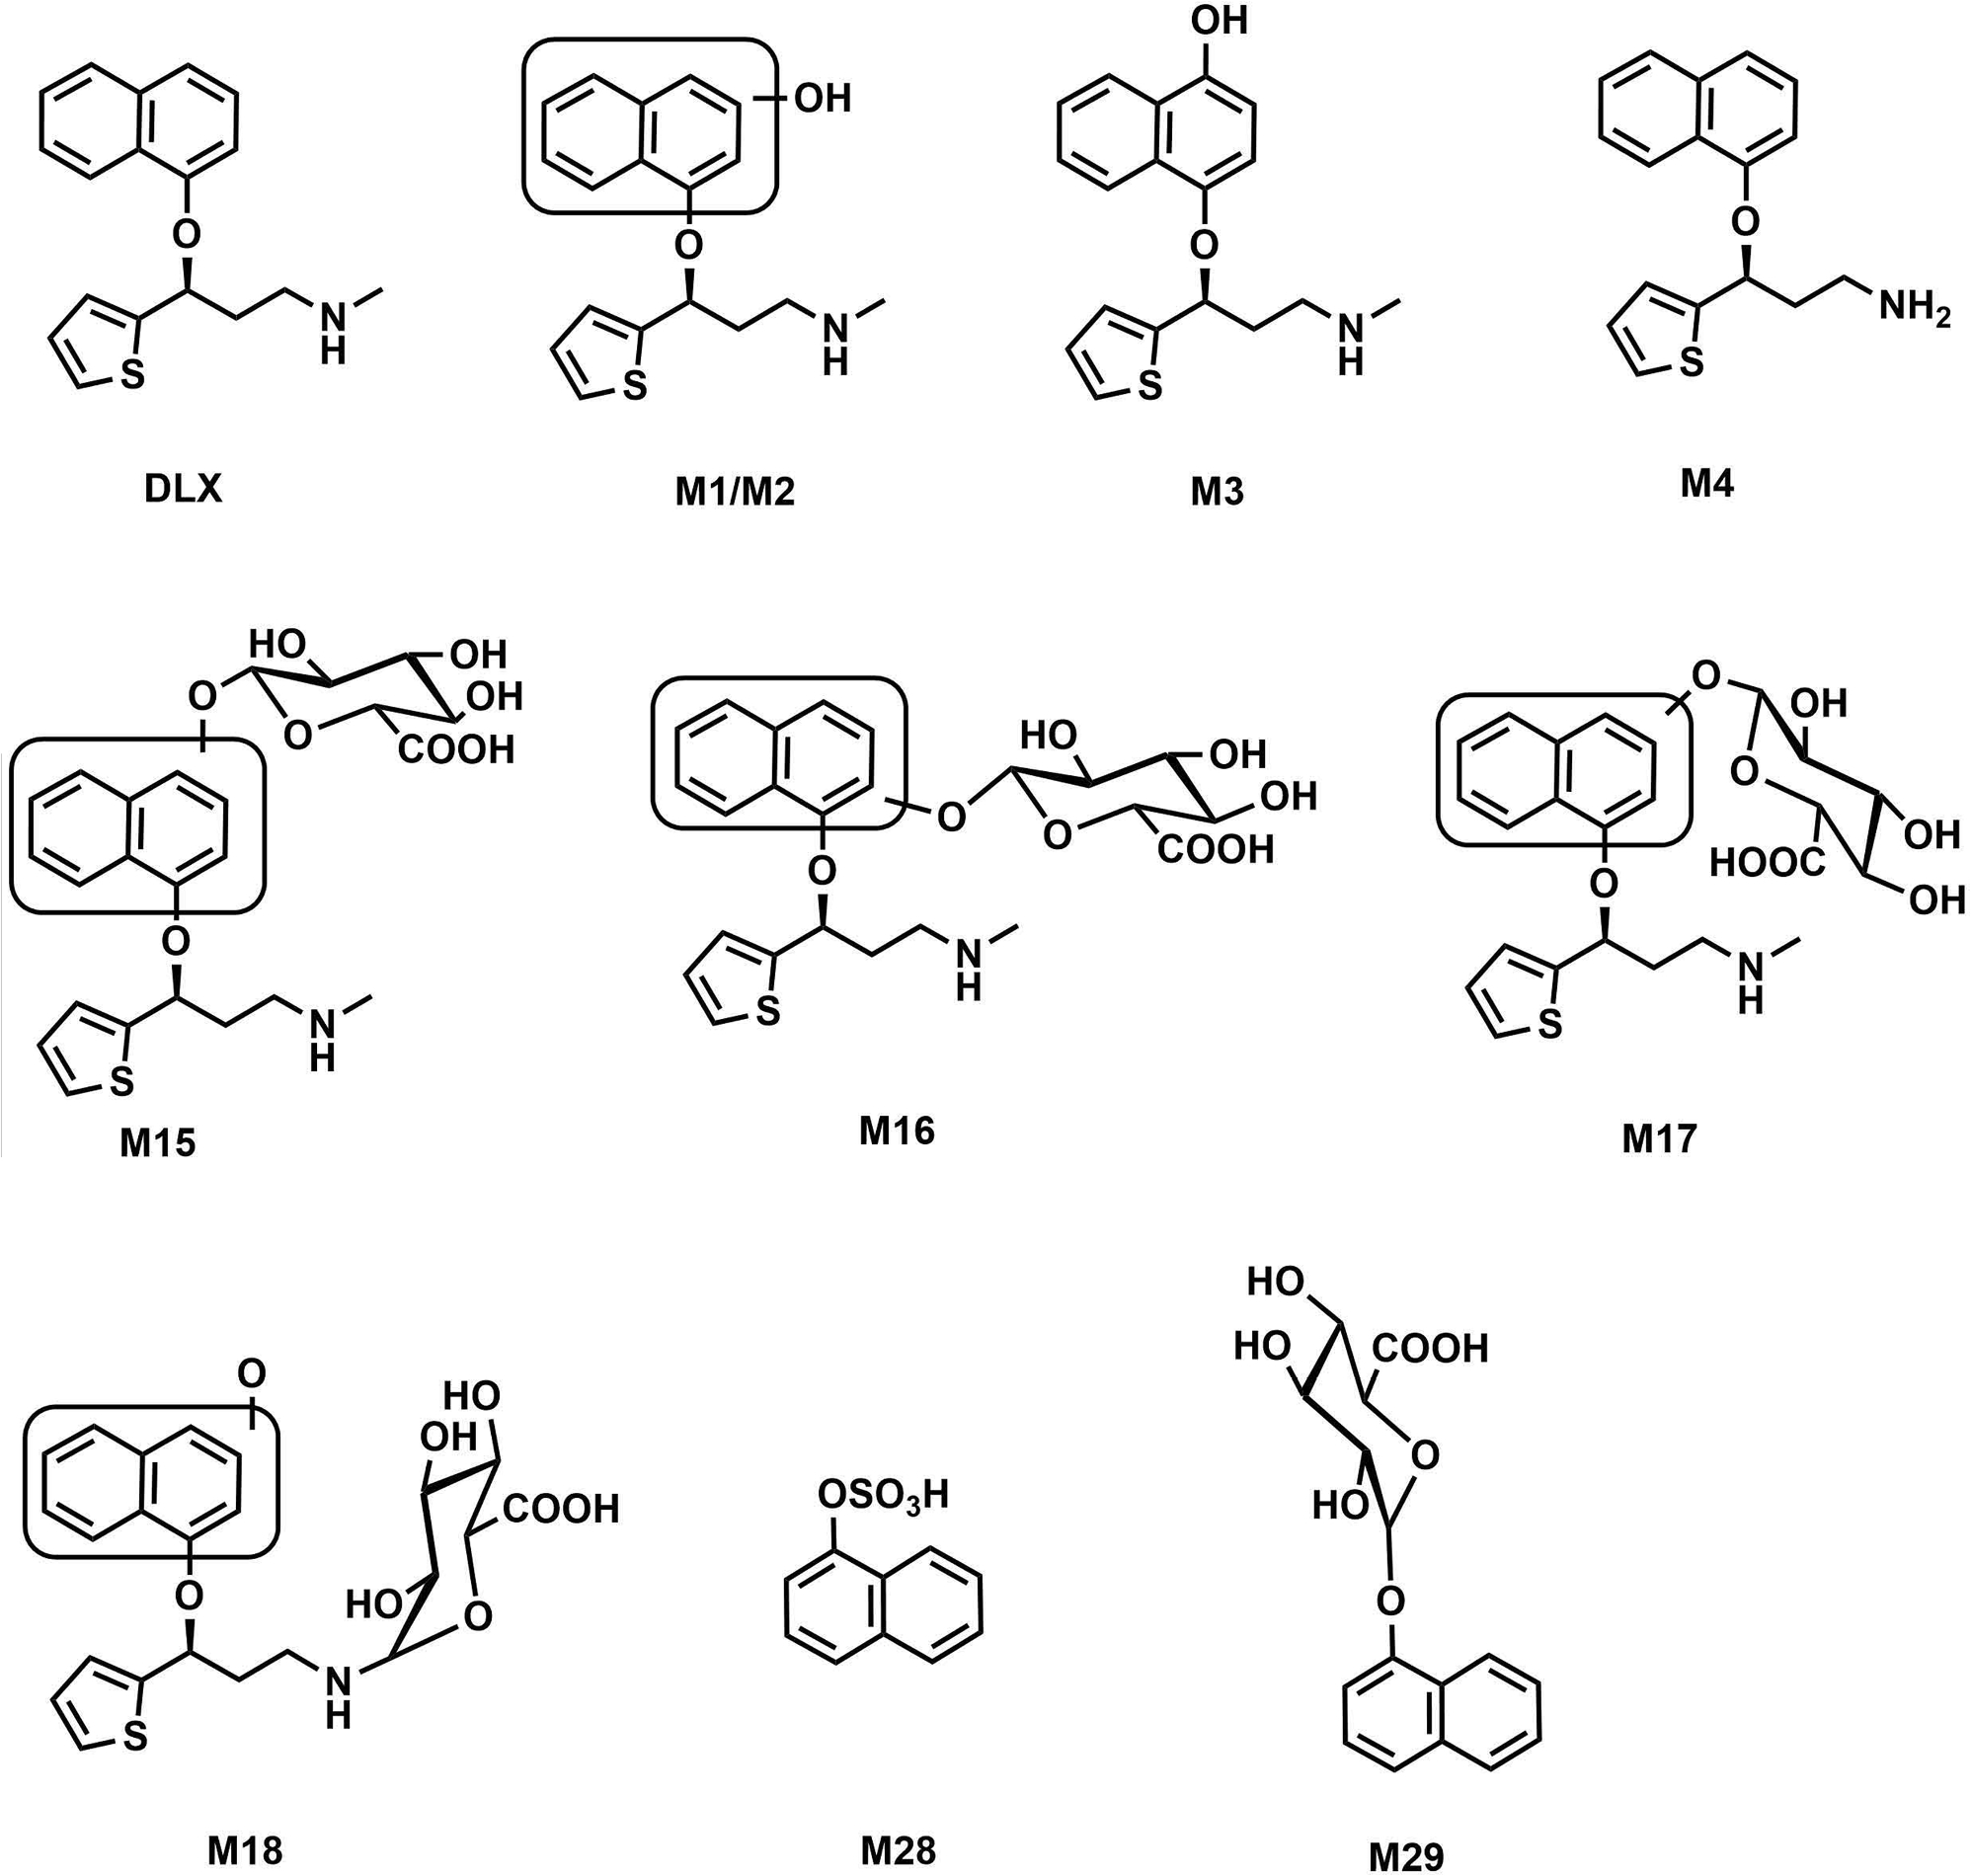
The structures and numbers were kept consistent with the former study (Qin et al., 2022) (Reference 13: Supporting link: https://urldefense.proofpoint.com/v2/url?u=http-3A__dmd.aspetjournals.org_cgi_reprint_50_2_128.pdf-3Fijkey-3D5awoFZYnwzJYztc-26keytype-3Dfinite&d=DwIDAw&c=ZQs-KZ8oxEw0p81sqgiaRA&r=zFlSUTVa_alPeycgsHGCnQ&m=5oU0k4B6tlk2OIRbJeJXc05Pe-paZ3IJ5DGldtuPwH8Yb_3QToI1XJJuuzOVtkB2&s=wyzc-khEJoWq3Yz2dTx73nCfnOmLke6JYQMKn2g6JXk&e=).
2. Materials and methods
2.1. Chemicals and animals
DLX [(3S)-N-methyl-3-(1-naphthyloxy)-3-(2-thienyl)propan-1-amine)], lithocholic acid-d5, and agomelatine were purchased from Cayman Chemical (Ann Arbor, Michigan). NADPH, phenacetin, methyl cellulose (viscosity 400 cPs), dextromethorphan and propranolol were obtained from MilliporeSigma (St. Louis, MO). 10x PBS solution was a product of BioRad and was further diluted to 1x PBS with HPLC grade water. Blotting grade nonfat dry milk (NFDM) was obtained from Apex Bioresearch (Houston, TX). All solvents for liquid chromatography and mass spectrometry (LC-MS) were of the highest grade commercially available.
2.2. Cyp1a2-KO mouse model generation and characterization
Cyp1a2-KO mouse model (C57B/6J background) was constructed via the CRISPR-Cas9 technology by the Baylor College of Medicine Genetically Engineered Rodent Models Core (Lanza et al., 2018; Stroup et al., 2020). Briefly, a pair of guide RNAs (gRNAs) were selected using the Wellcome Trust Sanger Institute Genome Editing website. These gRNAs target double strand breaks 5’ of exon 2 (https://wge.stemcell.sanger.ac.uk/crispr/545204958) and 3’ of exon 5 (https://wge.stemcell.sanger.ac.uk/crispr/545204424) within Cyp1a2 gene. The gRNAs chosen have no predicted off-target sites in exons or introns with less than 3-base mismatches. Synthesized single guide RNAs (Synthego, Redwood City, CA) and Cas9 protein (PNA Bio, Newbury Park, CA) were pre-complexed in a ratio of 6.6 μM total sgRNA to 6 μM Cas9 protein in a final volume of 10 μL 1x Modified TE (RNAse-free). C57BL/6J female mice, 24 to 32 days old, were injected with 5 IU/mouse of pregnant mare serum, followed 46.5 h later with 5 IU/mouse of human chorionic gonadotropin and subsequently mated to C57BL/6J males. Fertilized oocytes were collected at 0.5 dpc for electroporation and 100 pronuclear stage zygotes in a total volume of 20 μL was electroporated: Embryos were resuspended in 10 μL OptiMEM medium combined with 10 μL Cas9 RNP/donor mixture (30 V, 12 × 1 msec square wave pulses, BioRad Gene Pulser). A total of 200 embryos were electroporated in two cuvettes (0.1 cm gap). Electroporated zygotes were transferred into pseudopregnant ICR females. Founder animals (F0) mice were genotyped by standard PCR to identify founders with deleted exons 2 through 5. PCR was done using a three-primer system, a single forward primer (F primer 5’ - AAT TCC CAC CTG GCA TTG GA shared between two different reverse primers (endogenous R primer 5’ - GGA GAA CGC CAT CTG TAC CA, null R primer 5’ - ACT TGA GTG TGA GCT GAG CT). The shared F with the null R primers reside ~200 flanking the critical exons, which amplify a smaller deletion amplicon (423 bp) compared to the wildtype amplicon (3791 bp). A separate reaction using the shared F and endogenous R primer, placed within the predicted deletion interval, amplifies a product (647 bp) in the endogenous allele. Targeted KO F0 founders were backcrossed with stock C57B6/J animals to generate F1 pups. Heterozygous KO F1 mice were sequence confirmed prior to establishing a colony by further crossed with heterozygous F1 to get homozygous WT and Cyp1a2-KO F2 pups. The mice were kept under 12 h dark/light cycle with free access to food and water. The animals were handled according to the animal study protocols approved by the Baylor College of Medicine Institutional Animal Care and Use Committee.
The absence of liver Cyp1a2 was validated at the expression and function levels. For protein expression, 100 mg of liver tissue from both male WT and Cyp1a2-KO mice aged between 8 and 12 weeks was homogenized in 400 μL of lysis buffer (25 mM Tris-HCl, 150 mM NaCl, 1% NP-40, 1% sodium deoxycholate, 1% Triton X-100 and 0.1% sodium dodecyl sulfate) supplemented with Halt protease inhibitor cocktail (Thermo Fisher Scientific, San Jose, CA) using zirconium oxide beads (2.0 mm, Next Advance, Troy, NY) and a bullet blender (Next Advance, Troy, NY). Homogenized lysates were further incubated on ice for 45 min with continuous, gentle agitation. Tissue lysates were clarified of debris by centrifugation at 15,000 × rpm at 4 °C for 20 min. Total protein concentration for each sample was determined at 1:50 dilution using the detergent compatible BioRad DC Protein Assay (Bio Rad, Hercules, CA) and measured using a CLARIOStar Plus Microplate Reader. Thirty μg lysate for each sample was separated by SDS PAGE using Bio Rad 4–20% Mini PROTEAN TGX Gels. Separated samples were transferred to a Bio Rad nitrocellulose membrane using the BioRad Trans-Blot Turbo and Trans-Blot Turbo RTA Transfer Kit. Membranes were blocked with 5% NFDM in TBST (20 mM Tris, 150 mM NaCl, 0.1% Tween 20, pH 7.6) for one hour at room temperature with gentle rocking. Blocked membranes were probed for CYP1A2 (1:1000 in NFDM, Cat No. ab22717, Abcam, Boston, MA) and GAPDH (1:2500 in NFDM, Cat No. HRP-60004, Proteintech, Rosemont, IL) over-night at 4 °C with gentle rocking. Membranes were washed with TBST for 5 min for a total of three washes. Membranes were then incubated with HRP conjugated secondary antibodies (1:10,000 in NFDM, Cat No. 31430, Thermo Fisher Scientific) for one hour at room temperature with gentle rocking. Membranes were washed with TBST for 8 min for a total of three washes each. Membranes were imaged by chemiluminescence using the Pierce ECL Western Blotting Substrate (Thermo Fisher Scientific) and a Bio Rad ChemiDoc MP Imaging System.
The selective probe phenacetin was used to validate the function of Cyp1a2 in the liver from WT and Cyp1a2-KO mice (Li et al., 2018). Liver S9 fraction (LS9) was prepared by adding 10 folds of pre-chilled 1x PBS (w/v) to the livers from male WT or Cyp1a2-KO mice aged between 8 and 12 weeks (n = 4). The liver samples were thoroughly homogenized with zirconium oxide beads and a bullet blender. The supernatant was transferred into a 1.5 mL Eppendorf tube and centrifuged at 9,000 rcf for 30 min at 4 °C. The supernatant was transferred to another 1.5 mL Eppendorf tube and the total protein concentration was quantified with a Pierce BCA Protein Assay Kit (Thermo Fisher Scientific, San Jose, CA). The incubation was performed with a total volume of 100 μL including 2 mg/mL of LS9, 40 μM of phenacetin and 1 mM of NADPH in 1x PBS (final DMSO concentration 1%, v/v). After incubation at 37 °C for 10 min, reactions were quenched with 100 μL ice-cold methanol (containing 0.1 μM of agomelatine as the internal standard, IS), well mixed and centrifuged at 15,000 rcf for 15 min at 4 °C. The supernatant was transferred into sample vials for phenacetin O-deethylation quantification by LC-MS. The peak area of phenacetin O-deethylation was used for activity quantification. The activity of the LS9 from WT + control group was set as 100%.
2.3. The effectiveness of propranolol on the inhibition of Cyp2d activity
Sixteen male mice (8 WT and 8 Cyp1a2-KO, 8–12 weeks) were divided equally and randomly into 4 groups: WT mice receiving vehicle (WT + control), WT mice receiving Cyp2d inhibitor (WT + inhibitor), KO mice receiving vehicle (KO + control) and KO mice receiving Cyp2d inhibitor (KO + inhibitor). The mice were treated with either vehicle (1x PBS, 10 μL/g) or 30 mg/kg propranolol hydrochloride (3 mg/mL in 1x PBS, 10 μL/g) per oral gavage. Sixteen hours after treatment, the liver samples were harvested. LS9 were prepared and protein concentrations were measured in the same method as described above. For the validation of irreversible Cyp2d inhibition by propranolol, the probe reaction dextromethorphan O-demethylation was used to evaluate the Cyp2d activity in the LS9. The incubation was performed with a total volume of 100 μL including 2 mg protein/mL of LS9, 5 μM of dextromethorphan and 1 mM of NADPH in 1x PBS (final DMSO concentration 1%, v/v). After incubation at 37 °C for 5 min, the reactions were quenched with 100 μL ice-cold methanol (containing 0.1 μM of agomelatine as the IS). The resultant mixtures were vortexed and centrifuged at 15,000 rcf for 15 min at 4 °C. The supernatant was transferred into sample vials for LC-MS analysis and the peak area of dextrorphan (dextromethorphan O-demethylation) was used for activity quantification. The activity of the LS9 from WT + control group was set as 100%.
DLX was incubated in the LS9 to evaluate the effects of propranolol on its metabolism. 20 μM of DLX was used and the reaction system was incubated for 20 min at 37 °C. The methods for reaction termination and sample preparation for LC-MS analysis were used as above. The supernatant was used for DLX and metabolite analysis by LC-MS. The peak areas of DLX metabolites were used for activity quantification. The activity of the LS9 from the WT + control group was set as 100%.
2.4. Pharmacokinetics of DLX in wild-type and Cyp1a2-KO mice with/without Cyp2d inhibitor
Sixteen male mice (8 WT and 8 Cyp1a2-KO, 8–12 weeks) were divided equally and randomly into 4 groups: WT + control, WT + inhibitor, KO + control and KO + inhibitor. The mice were pretreated with vehicle (1x PBS, 10 μL/g) or 30 mg/kg propranolol hydrochloride (3 mg/mL in 1x PBS, 10 μL/g) per oral gavage. After 16 hours, all the mice were given 12 mg/kg DLX dissolved in 0.5% (w/v) methyl cellulose (p.o.,10 μL/g). The dose administrated to mice is clinically relevant, which is converted from human dose (60 mg daily) (Nair and Jacob, 2016). About 20 μL of blood (anticoagulated by sodium heparin) was collected via the tail vein at 0, 0.25, 0.5, 1, 2, 4, 6, 8, and 24 h post dose. The whole blood samples were centrifuged at 2,000 rcf for 5 min at 4 °C to separate the plasma. The plasma samples were stored at −80 °C before analysis.
2.5. Tissue distribution of DLX in wild-type and Cyp1a2-KO mice with/without Cyp2d inhibitor
Sixteen male mice (8 WT and 8 Cyp1a2-KO, 8–12 weeks) were grouped and pre-treated as performed in pharmacokinetic study. After 16 h, all the mice (n = 4 for each group) were administrated with DLX (12 mg/kg, p.o.). Two hours after treatment, the tissues including brain, liver, kidney, spleen, lung, testis, and epididymis were collected. The tissue samples were snap-frozen in liquid nitrogen and then stored at −80 °C before analysis.
2.6. Sample preparation
The plasma and tissue samples were prepared according to the previous study (Qin et al., 2022). In brief, for plasma samples, 10 μL of plasma was added into 60 μL of methanol containing 0.1 μM agomelatine and 0.5 μM lithocholic acid-d5 as the positive and negative IS, respectively. The resulting mixtures were vortexed and centrifuged at 15,000 rcf for 15 min. The supernatants were transferred into sample vials for LC-MS analysis. For tissue samples, 50 mg of tissue was homogenized in 300 μL of 50% methanol, followed by adding 50 μL of tissue homogenate to 200 μL of ice-cold methanol containing IS described above. The mixture was vortexed and centrifuged at 15,000 rcf for 15 min and the supernatants were transferred into sample vials for analysis.
2.7. UHPLC-Q Exactive MS analysis
All the samples from the LS9 incubation, pharmacokinetic and tissue distribution studies were analyzed with Q Exactive Orbitrap MS (Thermo Fisher Scientific) coupled with Vanish UHPLC (Thermo Fisher Scientific) using the method established in our previous study (Qin et al., 2022). Briefly, the analytes were separated on an Acquity BEH C18 column (2.1 mm × 100 mm, 1.7 μm, Waters, Milford, MA) with a water/acetonitrile (A/B) mobile phase containing 0.1% formic acid in both phases and a gradient from 2% B to 98% B over 15 min. The column temperature was maintained at 40°C and the flow rate was set at 0.3 mL/min. 3 μL was injected to LC-MS system for analysis. Q Exactive MS, coupled with an electrospray ion source, was operated in both positive and negative modes to detect DLX and its metabolites. Ultra-pure nitrogen was applied as the sheath (45 arbitrary unit), auxiliary (10 arbitrary unit) and sweep (1.0 arbitrary unit) gas. The capillary gas temperature was set at 350°C and the capillary voltages was set at 4.5 kV and 2.5 kV for positive and negative modes, respectively. MS data acquired and processed using the Xcalibur software (Thermo Fisher Scientific, San Jose, CA) in profile mode from m/z 80 to 1200 Da. The ions at m/z 371.1012 (positive mode) and 174.6592 (negative mode) were used as reference ions during acquisition. DLX and its metabolites were identified based on their exact masses and retention times (RT) according to the previous work (Qin et al., 2022). DLX levels in plasma and tissue samples quantified based on the calibration curves generated in their corresponding plasma and tissue matrices: 10 μL of work solutions (containing 0.01–2.5 μM of DLX) were spiked into 10 μL of blank mouse plasma or tissue homogenates and then prepared in the same protocol as plasma and tissue samples. Calibration curve regression with a weight of 1/x2 gave high linearity (r2 > 0.99) and accuracy with Relative Standard Deviation less than 15%. DLX in tissue samples was quantified based on calibration curves prepared in the respective blank tissue homogenates.
2.8. Pharmacokinetic parameter calculation and statistical analysis
PK parameters of DLX including half-time (T1/2), area under the plasma concentration–time curve during the period of observation (AUC0–t), area under the plasma concentration–time curve from zero to infinity (AUC0–∞), clearance normalized by bioavailability (CL/F), apparent volume of distribution normalized by bioavailability (Vd/F), the mean residence time during the period of observation (MRT0–t) and the mean residence time from zero to infinity (MRT0–∞) were calculated on WinNonlin software (Certara, Princeton, NJ) by noncompartmental analysis. For DLX, absolute plasma concentrations were used, while relative abundance (peak area) was used for the metabolites as no standards available. The AUCs were plotted as mean ± S.E.M. Two-way ANOVA with Tukey’s post comparisons was used to calculate the significance of differences of concentration (DLX), peak area for DLX metabolites or Cyp2d activity in LS9 among the WT + control, WT + inhibitor, KO + control and KO + inhibitor groups. Two-tailed Student’s t-test was used to calculate the significance of differences between the WT and Cyp1a2-KO groups as well as the groups with and without Cyp2d inhibitor. P-values less than 0.05 were considered as statistically significant differences.
3. Results
3.1. Cyp1a2-knockout results in the loss of Cyp1a2 protein expression and activity
Cyp1a2 is predominantly expressed in the mouse liver (Choudhary et al., 2003). Fig. 2A showed that Cyp1a2 protein expression is absent in Cyp1a2-KO mouse livers. The O-deethylation of phenacetin is regarded as one of the probe reactions primarily catalyzed by human CYP1A2 or mouse Cyp1a2 (Li et al., 2018). The formation of O-deethylation-phenacetin was suppressed by 80% in LS9 from Cyp1a2-KO mice compared with WT mice (Fig. 2B). Overall, the protein expression and enzymatic activity of Cyp1a2 are proved to be deprived in Cyp1a2-KO mouse liver.
Fig. 2. Characterization of Cyp1a2-KO mouse model at the protein expression and enzyme activity levels in liver.
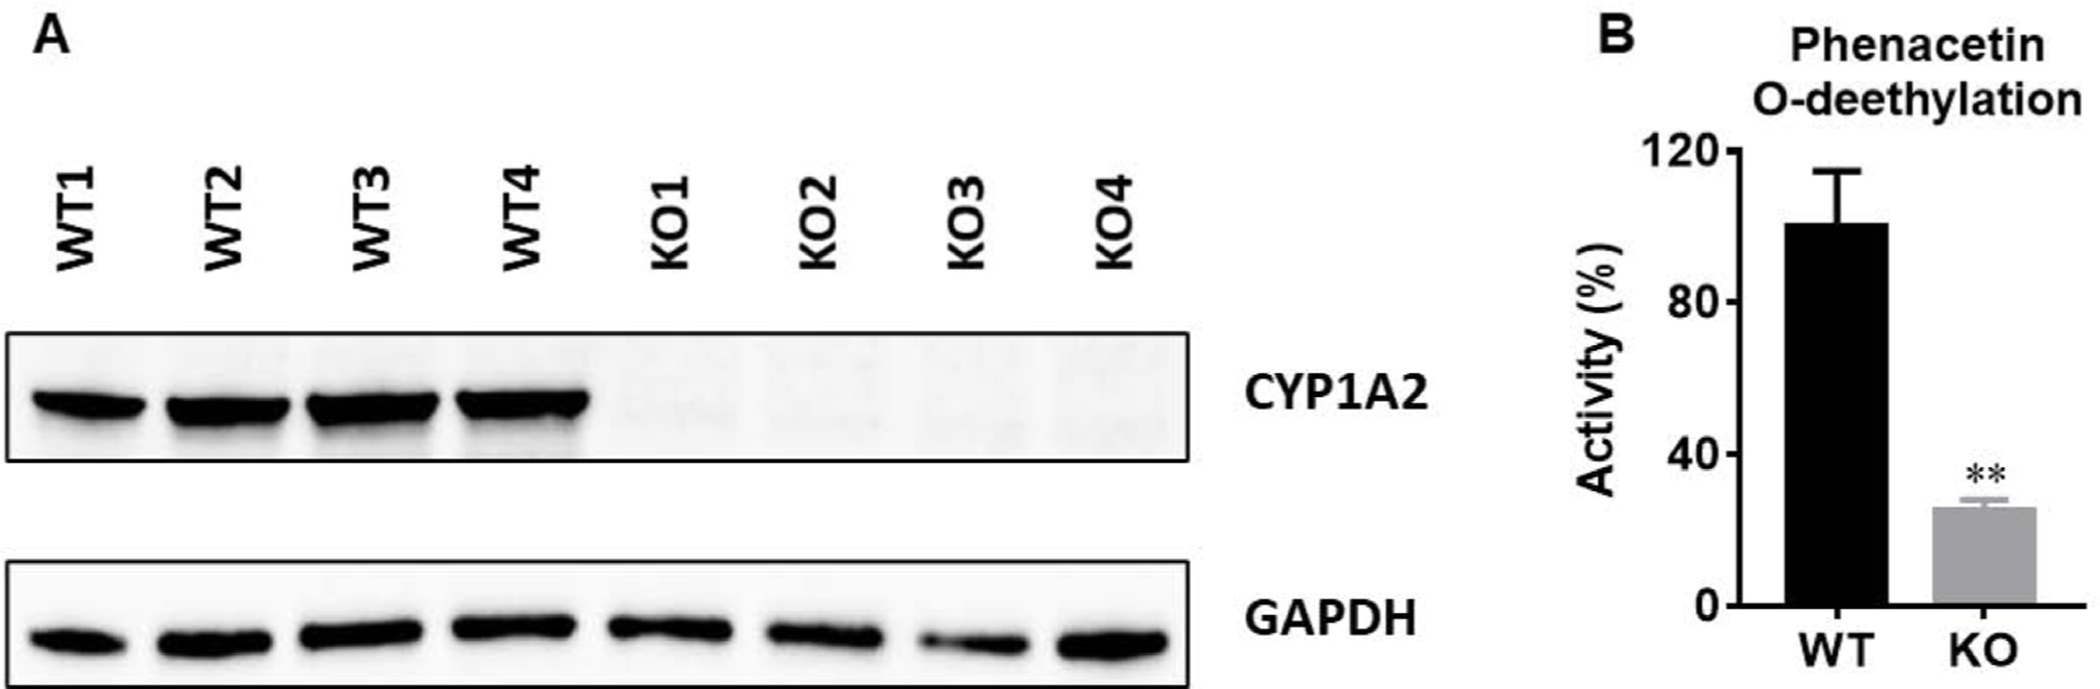
(A) Expression of Cyp1a2 protein in WT and Cyp1a2-KO mouse livers. (B) Phenacetin O-deethylation in liver S9 fractions (LS9) prepared from WT and Cyp1a2-KO mouse livers (n = 4). Phenacetin (40 μM, incubation for10 min), a probe of Cyp1a2, was incubated in LS9. The peak area of deethylated phenacetin was used for relative quantification. The peak area from WT group was set as 100%. Two-tail Student’s t-test was used for 2B. The data were expressed as mean ± S.E.M. **p<0.01.
3.2. Cyp2d activity is irreversibly inhibited by propranolol in vivo
Propranolol has been demonstrated as a mechanism-based human CYP2D6 and mouse Cyp2d inhibitor in vivo, indicated by decreased serum dextrorphan/dextromethorphan ratio (Tolledo et al., 2020). To test if propranolol has the inhibitory effects on Cyp2d in our mouse model used in the present study, 16 h after propranolol treatment the LS9s were prepared from mice. The Cyp2d function was first evaluated using Cyp2d probe dextromethorphan (Li et al., 2018). No significant difference was observed between WT + control and KO + control groups, indicating that Cyp1a2-KO had no effect on Cyp2d activity (Fig. 3A). Cyp2d activity decreased for about 50% in LS9 from both WT and KO mice pre-treated with propranolol compared with the corresponding control groups, which is consistent with other studies (Tolledo et al., 2020). Thus, the dose of propranolol (30 mg/kg, p.o.) and pre-treatment time (16 h before DLX dosing) were kept consistent in the pharmacokinetics and tissue distribution studies.
Fig. 3. The effectiveness of Cyp2d inhibitor on its activity using dextromethorphan and DLX in mouse LS9.
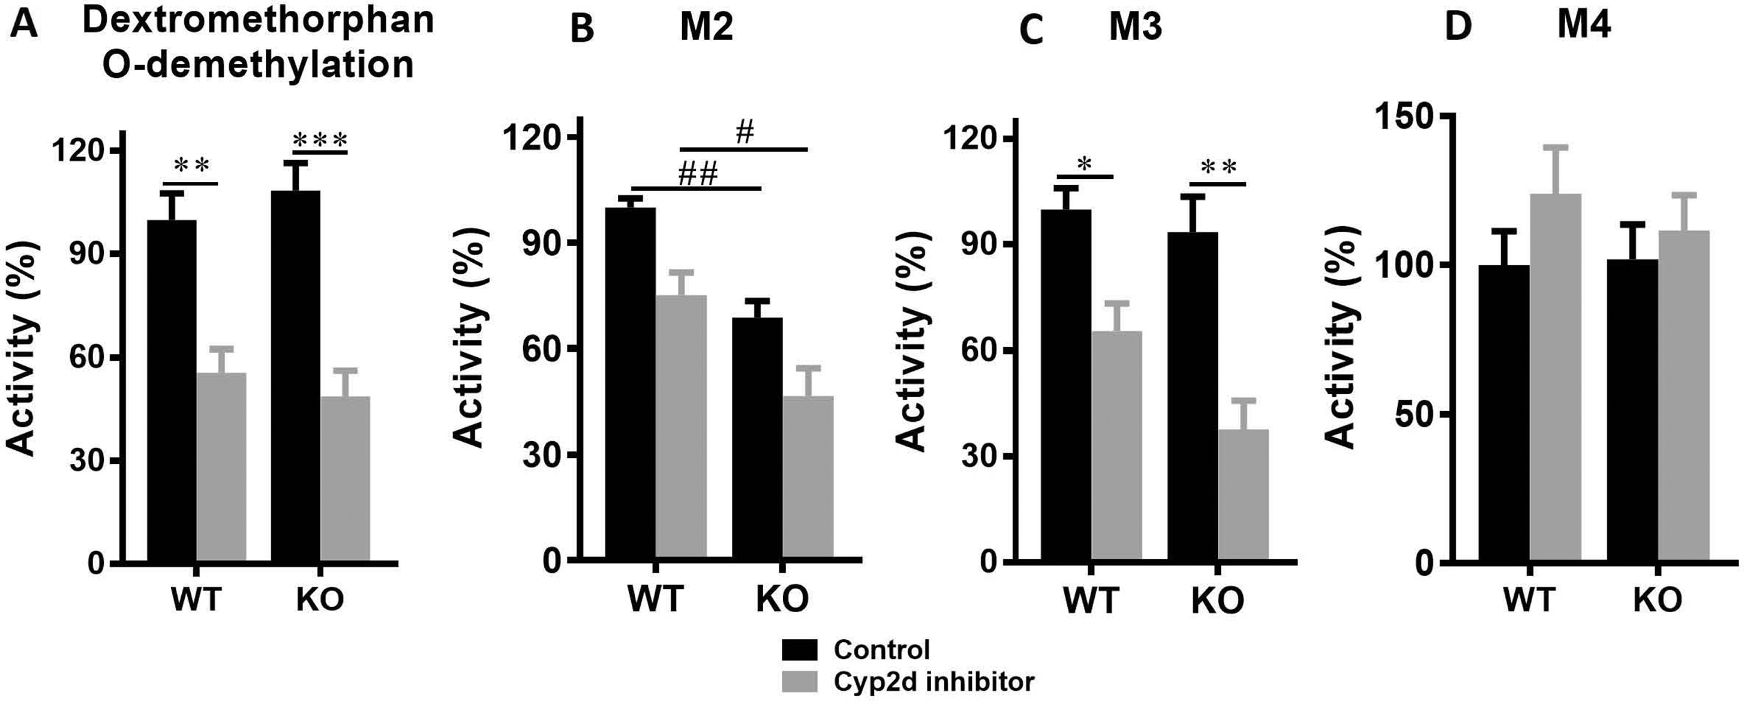
Sixteen male mice (8 WT and 8 Cyp1a2-KO, 8–12 weeks) were divided equally and randomly into 4 groups (n = 4): WT + control, WT + inhibitor, KO + control, and KO + inhibitor. The mice were orally administered with either vehicle or 30 mg/kg propranolol hydrochloride. Sixteen hours later, the mice were euthanized and LS9 was prepared for each mouse. Dextromethorphan (5 μM) and DLX (20 μM) were incubated for 5 and 20 min in LS9, respectively. The metabolites were relatively quantified according to their peak areas. The peak areas from WT + control group were set as 100%. (A) Dextrorphan (Dextromethorphan-O-demethylation) formation in LS9. (B) M2 formation in LS9. (C) M3 formation in LS9. (B) M4 formation in LS9. Two-way ANOVA with Tukey’s post comparisons was used to compare among the 4 groups. *p<0.05, **p<0.01, ***p<0.001, comparisons between WT + control and WT + inhibitor groups, or between KO + control and KO + inhibitor groups; #p<0.05 and ##p<0.01, comparisons between WT + control and KO + control groups, or between WT + inhibitor and KO + inhibitor groups. The data was expressed as mean ± S.E.M.
We also evaluated the effects of propranolol on DLX metabolism using LS9 and found that the formation of DLX major metabolites was suppressed in LS9 from both WT and KO mice pre-treated with propranolol. Our previous study demonstrated that M2, M3 and M4 are the major phase I metabolites formed in MLM (Qin et al., 2022). Cyp1a2-KO decreased 31% and 38% of M2 formation with/without Cyp2d inhibitor compared to WT + control and WT + inhibitor groups, respectively (Fig. 3B). Cyp2d inhibitor slightly decreased the M2 formation in WT and Cyp1a2-KO mice, but not significantly (Fig. 3B). Cyp1a2-KO has the limited effect on M3 generation, but Cyp2d inhibitor suppressed 35% and 60% of M3 formations in WT and Cyp1a2-KO mice, respectively (Figs. 3C). M4 formation was not affected by Cyp1a2-KO or Cyp2d inhibitor (Fig. 3D).
3.3. Cyp2d inhibition but not Cyp1a2-KO increases DLX systemic exposure
DLX is rapidly absorbed in mice, and the time to reach maximum plasma concentration (Tmax) was somewhat delayed in Cyp1a2-KO mice (1.38 h for the WT + control vs. 2.50 h for the KO + control) as shown in Fig. 4A and Table 1, but this difference was not statistically significant. We found that Cyp1a2-KO has no marked effect on the DLX pharmacokinetic profile by comparing the data of KO + control with WT+ control groups (Table 1). In WT and KO mice, Cyp2d inhibitor propranolol significantly increased the DLX systemic exposure and slowed its elimination. By comparison of WT + control and WT + inhibitor groups, propranolol increased Cmax by 177% and AUC0-t by 304%. In KO mice, the similar trends were observed, where Cmax increased by 295% and AUC0-t increased by 129% in the KO + inhibitor group compared with those of KO + control group (Table 1).
Fig. 4. Pharmacokinetic profiles of DLX and its major circulating metabolites in WT and Cyp1a2-KO mice with/without Cyp2d inhibitor.
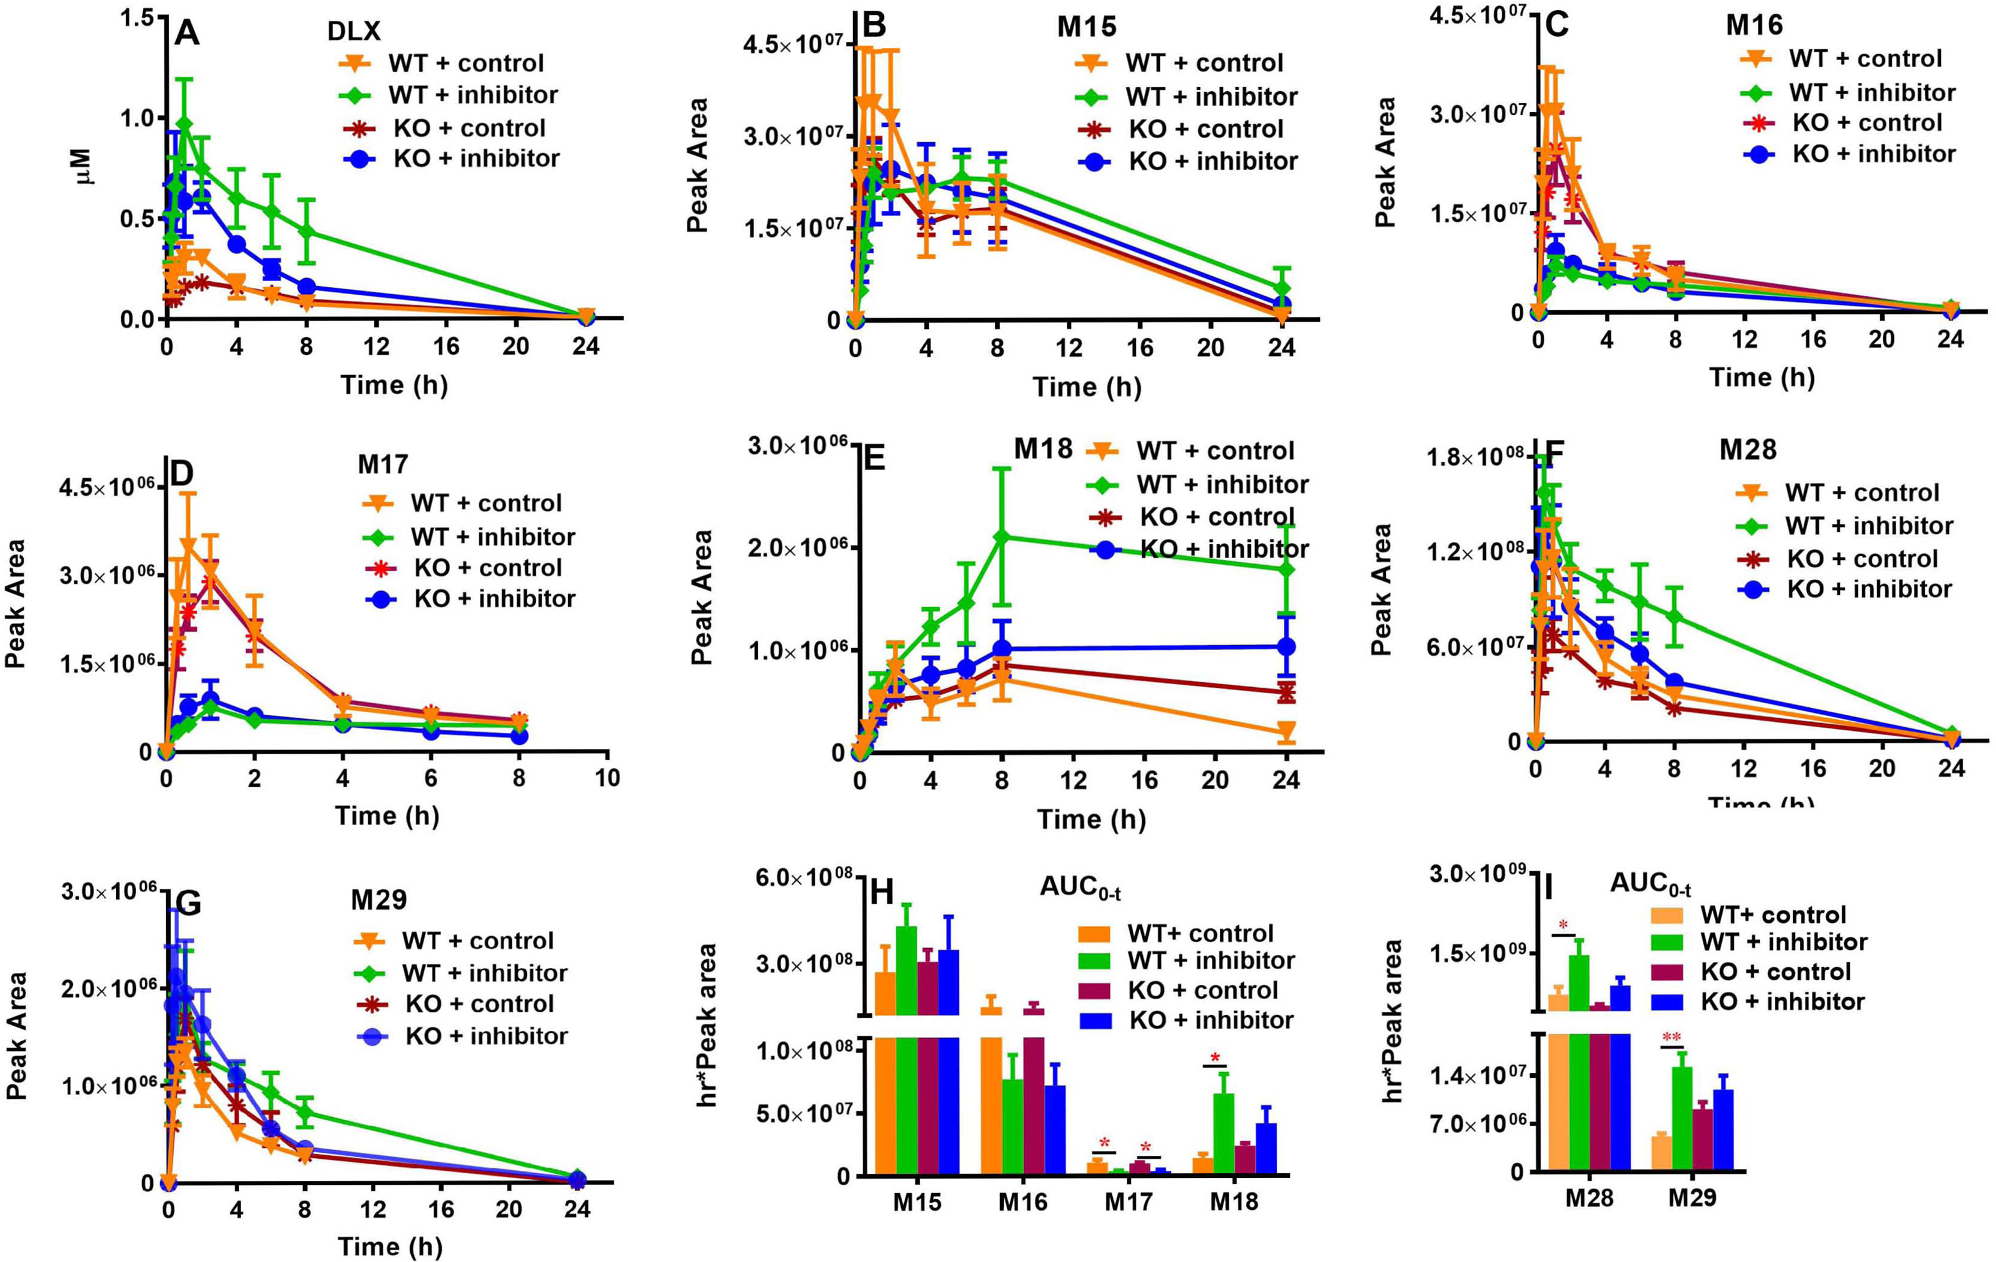
Sixteen male mice (8 WT and 8 Cyp1a2-KO, 8–12 weeks) were divided equally and randomly into 4 groups (n = 4) as in Fig. 3. Sixteen hours before DLX treatment, the mice were orally administrated with vehicle or 30 mg/kg propranolol. After DLX treatment (12 mg/kg, p.o.), the blood was collected via the tail vein at 0, 0.25, 0.5, 1, 2, 4, 6, 8, and 24 h. (A) DLX. (B) M15. (C) M16. (D) M17. (E) M18. (F) M28. (G) M29. (H) AUC0–t of M15-M18 (in positive mode). (I) AUC0–t of M28 and M29 (in negative mode). Two-way ANOVA with Tukey’s post comparisons was used to compare among the 4 groups, *p<0.05, **p<0.01. The data were expressed as mean ± S.E.M. AUC, Areas under the plasma concentration–time curve during the period of observation.
Table 1.
Pharmacokinetic parameters of Duloxetine in WT and Cyp1a2-KO mice with or without Cyp2d inhibitor.
| Parameter | Unit | WT | KO | KO control/WT control | ||||
|---|---|---|---|---|---|---|---|---|
| Control | Cyp2d+I | Cyp2d+I/Control | Control | Cyp2d+I | Cyp2d+I/Control | ratio | ||
|
| ||||||||
| Cmax | μmol/L | 0.36 ± 0.05 | 1.00 ± 0.21* | 2.78 | 0.20 ± 0.02 | 0.79 ± 0.21# | 3.95 | 0.56 |
| Tmax | hr | 1.38 ± 0.38 | 1.25 ± 0.25 | 0.91 | 2.50 ± 0.50 | 1.00 ± 0.35 | 0.40 | 1.81 |
| T1/2 | hr | 4.28 ± 0.41 | 3.32 ± 0.52 | 0.76 | 4.43 ± 0.64 | 3.66 ± 0.24 | 0.83 | 1.04 |
| AUC0-t | hr*μmol/L | 2.09 ± 0.41 | 8.45 ± 2.46* | 4.04 | 1.85 ± 0.39 | 4.23 ± 0.56# | 2.29 | 0.89 |
| AUC0-∞ | hr*μmol/L | 2.12 ± 0.40 | 8.50 ± 2.45* | 4.01 | 1.89 ± 0.39 | 4.27 ± 0.57# | 2.26 | 0.89 |
| CL/F | mg/(hr*μmol/L)/kg | 6.19 ± 0.97 | 1.88 ± 0.60* | 0.30 | 7.32 ± 1.60 | 2.94 ± 0.34# | 0.40 | 1.18 |
| Vd/F | mg/(μmol/L)/kg | 39.87 ± 9.28 | 10.27 ± 5.02* | 0.26 | 51.03 ± 18.18 | 15.44 ± 1.71# | 0.30 | 1.28 |
| MRT0-t | hr | 5.02 ± 0.18 | 5.51 ± 0.16 | 1.10 | 5.73 ± 0.22 | 4.61 ± 0.29# | 0.80 | 1.14 |
| MRT0-∞ | hr | 5.52 ± 0.34 | 5.75 ± 0.21 | 1.04 | 6.39 ± 0.26 | 4.83 ± 0.27## | 0.76 | 1.16 |
WT and Cyp1a2-KO mice (male, 8–12 weeks, n = 4), pretreated with vehicle or 30 mg/kg propranolol (Cyp2d I) 16 h before pharmacokinetic study, were orally administered with DLX (12 mg/kg). The blood samples were collected 0, 0.25, 0.5, 1, 2, 4, 6, 8, and 24 h post dose. The samples were analyzed using LC-MS and the DLX concentrations were calculated according to its standard curve. The parameters were calculated on WinNonlin software by noncompartmental analysis and expressed as mean ± S.E.M. Two-tail Student’s t-test was used in the statistical analysis. Compared with WT + control group
p<0.05; compared with KO + control group
p<0.05
p<0.01. Cyp2d+I, Cyp2d inhibitor.
The major circulating metabolites in all the 4 mouse groups were phase II metabolites, which are the derivatives of phase I metabolites of DLX: the glucuronide conjugates of monohydroxylated DLX (M15-M17) (Fig. 1 and Figs. 4B–4D), the glucuronide conjugate of monohydroxylated demethylated DLX (M18) (Figs. 1 and 4E), 1-naphthol sulfate (M28) (Figs. 1 and 4F), and 1-naphthol glucuronide (M29) (Figs. 1 and 4G). Compared with the WT + control group, Cyp1a2-KO did not significantly impact the AUCs of the phase II metabolites (Figs. 4H and 4I). In WT mice, Cyp2d inhibitor propranolol decreased the AUCs of M16 (by 48%) and M17 (by 63%); while propranolol increased the AUCs of M15 (by 58%), M18 (by 360%), M28 (by 103%) and M29 (by 195%) (Figs. 4H & 4I). In KO mice, the effects of Cyp2d inhibitor on the AUCs of DLX metabolites were similar to those in the WT mice (Figs. 4H & 4I): The AUCs of M16 and M17 were decreased by 50% and 61% by propranolol respectively; and the AUCs of M15, M18, M28 and M29 were increased by 13%, 74%, 73% and 31%, correspondingly (Figs. 4H & 4I).
3.4. Cyp2d inhibition but not Cyp1a2-KO alters DLX tissue distribution
Tissue distributions of DLX and its major metabolites were assessed at 2 h after DLX treatment, which corresponds approximately to its Tmax. The abundances of DLX and its metabolites were quantified in each tissue using the concentration (DLX, Fig. 5A) or peak area (Figs. 5B–5I, as standard compounds of metabolites not available). In WT + control and KO + control groups, DLX has the lowest level in epididymis (1.30 μmol/kg epididymis in WT + control) and the highest level in kidney (60.6 μmol/kg kidney in KO + control). Compared with WT + control, the DLX levels in KO + control group decreased by 31% in the lung (24.1 μmol/kg in WT + control vs. 16.6 μmol/kg in KO + control) and decreased by 48% in the liver (10.0 μmol/kg in WT + control vs. 5.2 μmol/kg in KO + control). However, DLX levels increased by around 25% in brain and testis, while the level in kidney elevated by 62% in KO + control group (37.5 μmol/kg in WT + control vs. 60.6 μmol/kg in KO + control). The Cyp1a2-KO has few effects on the DLX levels in spleen and epididymis (Fig. 5A). All the changes between WT + control and KO + control are not statistically significant. We found that Cyp2d inhibitor dramatically increased the DLX levels in all the tissues in WT + inhibitor and KO + inhibitor groups compared to those in WT + control and KO + control, respectively (Fig. 5A). In WT + inhibitor and KO + inhibitor groups, DLX still has the lowest level in epididymis (2.87 μmol/kg epididymis in WT+ inhibitor) and the highest level in kidney (148.3 μmol/kg kidney in KO + inhibitor). Compared to those in WT + control, the DLX levels in WT + inhibitor group increased by around 90% in liver and spleen, by 1–2 folds in epididymis, testis and brain. Three-fold increase in kidney was observed (Fig. 5A). Compared to those in KO + control, the DLX levels in KO + inhibitor group increased by 3 folds in liver, by around 1.5 folds in other tissues (Fig. 5A). There are no significant differences of DLX tissue concentrations between WT + inhibitor and KO + inhibitor groups.
Fig. 5. Tissue distribution of DLX and its major metabolites in WT and Cyp1a2-KO mice with/without Cyp2d inhibitor.
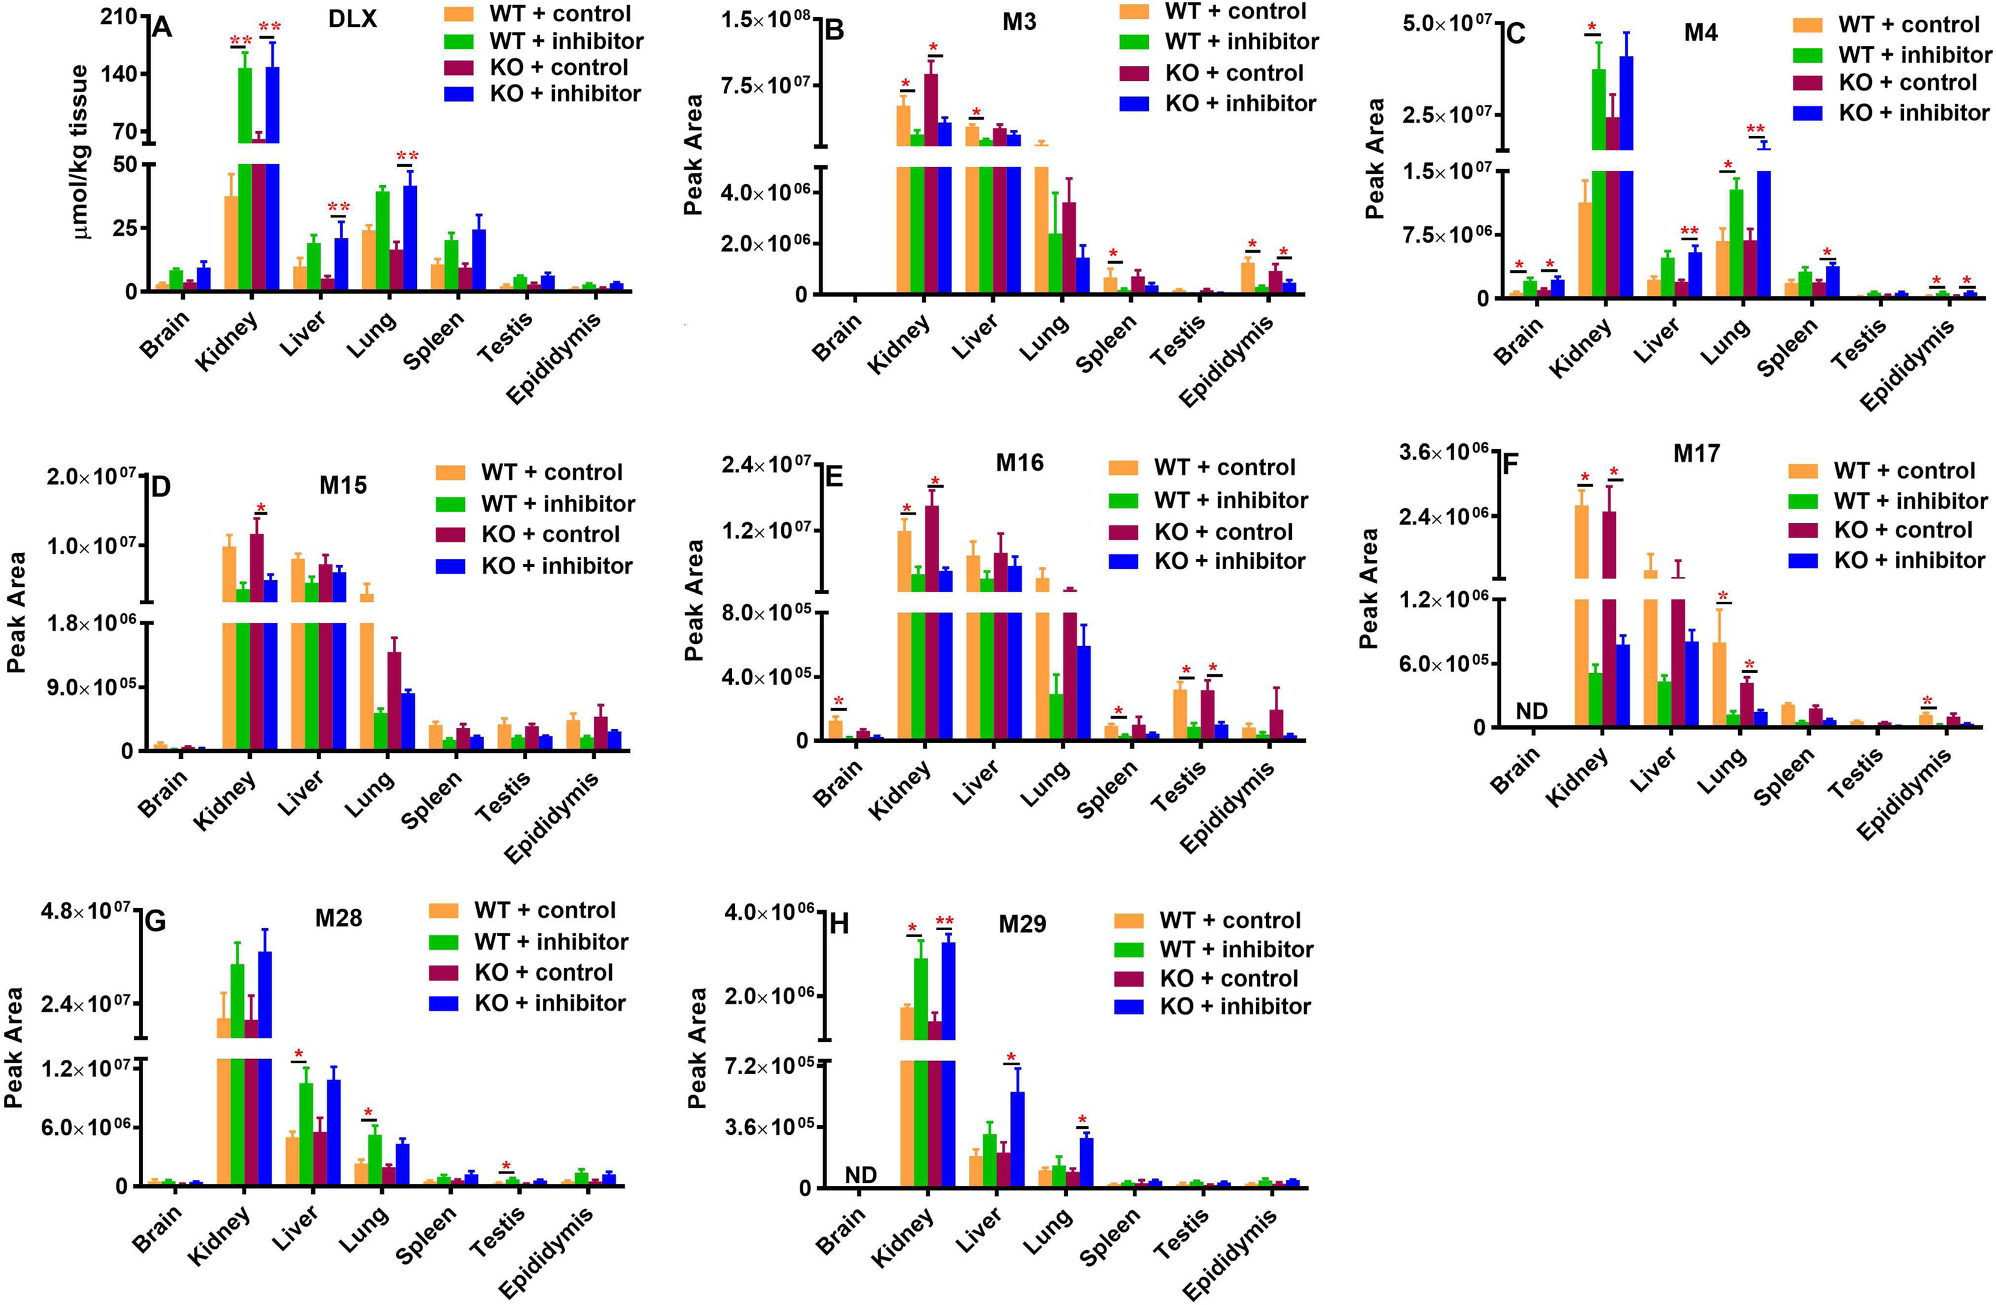
Sixteen male mice (8 WT and 8 Cyp1a2-KO, 8–12 weeks) were divided equally and randomly into 4 groups in Fig. 3 (n =4). Sixteen hours before DLX treatment, the mice were pretreated with vehicle or 30 mg/kg propranolol (p.o.). The mouse tissues including brain, liver, kidney, lung, spleen, testis and epididymis were harvested 2 h after DLX treatment (12 mg/kg, p.o.). The abundances were presented for DLX in absolute concentration and for metabolites in peak area from each tissue sample as mean ± S.E.M. (A) DLX, (B) M3, (C) M4, (D) M15, (E) M16, (F) M17, (G) M28, and (H) M29. Two-tail Student’s t-test was used for WT + control and WT + inhibitor or KO + control and KO + inhibitor, *p<0.05, **p<0.01. The data were expressed as mean ± S.E.M. ND, not detected.
M3 (monohydroxylated DLX), M4 (demethylated DLX), glucuronides (M15-M17, M29) and sulfate (M28) were the major metabolites detected in the tissues. These metabolites were the most abundant in the kidney, followed by the liver and lung (Figs. 5B–5H). The Cyp1a2-KO had no significant impact on the distribution of DLX metabolites. For M3 (Fig. 5B) and M15-M17 (Figs. 5D–5F), Cyp2d inhibitor decreased their relative abundance (peak area) in tissues to different extents in both WT and KO mice. For example, the abundance of M3 (Fig. 5B) and M15-M17 (Figs. 5D–5F) in the kidney were over 60 % lower in the WT + inhibitor group compared with the WT + control group, or in the KO + inhibitor group compared with the KO + control group. Similar phenomena were also observed in the liver or the lung. Oppositely, we found that Cyp2d inhibitor increased the tissue abundances of M4 (Fig. 5C), M28 (Fig. 5G) and M29 (Fig. 5H) in both WT and KO mice. By comparison of data from WT+ inhibitor group and WT+ control, or from the KO + inhibitor group and KO + control group, Cyp2d inhibitor increase their abundances over 65% in kidney. The similar trends were also observed in other tissues like the liver, lung, brain, spleen and epididymis in WT and/or KO mice.
4. Discussion
CYP1A2 and CYP2D6 are the major enzymes responsible for DLX oxidative metabolism in humans (Lantz et al., 2003), and previous studies suggested that their inhibitors increase the total exposure and Cmax of DLX in clinical settings (Bellingham and Peng, 2010; Knadler et al., 2011). Furthermore, we previously showed that Cyp1a2 and Cyp2d inhibitors could decrease the production of major DLX oxidative metabolites in MLM (Qin et al., 2022). To determine the roles of Cyp1a2 and Cyp2d in the in vivo metabolism and disposition of DLX, we employed a Cyp1a2-KO mouse model and an irreversible Cyp2d inhibitor propranolol to evaluate the effects of Cyp1a2 loss-of-function and/or Cyp2d activity suppression on the pharmacokinetic profiles and tissue distribution of DLX and its major metabolites. The protein expression and functional levels of Cyp1a2 in Cyp1a2-KO mouse liver were well-characterized in this study using western blotting and Cyp1a2 probe (Fig. 2). As the potent and effective in vivo mouse Cyp1a2 inhibitors are not established and also to avoid simultaneously treating each mouse with three compounds, the available Cyp1a2-KO mice in our laboratory were employed in this study. The effectiveness of Cyp2d inhibitor in vivo was validated by measuring the dextrorphan formation in the LS9 from WT and Cyp1a2-KO mice that were pre-treated with propranolol. Our data indicated that propranolol could effectively inhibit Cyp2d activity in the liver from WT and Cyp1a2-KO mice (Fig. 3A). The dextrorphan formation in LS9 from WT + control and KO + control has no difference, suggesting Cyp1a2-KO does not alter the Cyp2d activity (Fig. 3A). Incubating DLX with LS9, the major in vitro metabolites M2 and M3 formation showed no significant changes between the WT + control and KO + control groups (Figs. 2B and 2C). M2 and M3 formation was significantly suppressed in LS9 from WT + inhibitor group compared with WT + control group, or in LS9 from KO + inhibitor group compared with KO + control group. In our previous human recombinant CYP enzymes study, CYP2D6 is the primary enzyme for the formation of M2 and M3 (Qin et al., 2022). Selective chemical inhibitors incubated with in HLM suggested that CYP2D6 is a dominant enzyme for the M3 formation, and CYP2D6 and CYP1A2 are responsible for the M2 formation. These results implied that Cyp2d may play a more critical role in M2 and M3 formation than Cyp1a2 in mice. Cyp1a2-KO and/or Cyp2d inhibition had no effects on the M4 formation in LS9 (Fig. 2D), which is consistent with our previous findings: CYP1A2 and CYP2D6 inhibitors have few suppressions on M4 production in HLM or MLM (Qin et al., 2022).
In mice, DLX is well absorbed and extensively metabolized after oral administration of a clinically relevant dose. DLX absorption was slightly delayed in KO mice; the time to reach the peak plasma concentration was Tmax = 2.50 h in the KO + control group compared with Tmax = 1.38 h in the WT + control group (Table 1). These pharmacokinetic parameters of DLX in WT + control are not significantly different from those in the KO + control group (Table 1) although the DLX exposure is slightly smaller in the KO + control group compared with the WT + control group (Fig. 4A and Table 1). In the mouse LS9, Cyp1a2-KO decreased the M2 formation, but did not alter M3 and M4 formation (Figs. 3B–3D), suggesting that Cyp1a2 only has some contribution to M2 formation. These in vitro and in vivo data suggested that mouse Cyp1a2 may play a minor role in the overall DLX metabolism. In our previous study (Qin et al., 2022) and the current study (Fig. 3B), we found that Cyp1a2 inhibitor decreases DLX phase I metabolism in vitro, while DLX undergoes both extensive phase I and phase II metabolism in vivo. Cyp1a2 KO itself tended to decrease AUC of DLX and increase CL/F compared with WT mice (Table 1). The findings may be attributed to the alteration of transporters (e.g., efflux transporters) or other drug metabolizing enzymes caused by Cyp1a2-KO that facilitates DLX elimination. However, the exact mechanism is still not clear. More studies are needed to clarify the findings. A future proteomic study to determine the differences of drug metabolizing enzymes and transporters between WT and Cyp1a2-KO mice may provide some clues about the results.
Cyp2d inhibitor propranolol significantly increased the Cmax and AUC0-t of DLX in the WT + inhibitor and KO + inhibitor groups compared with their corresponding control groups (Fig. 4A and Table 1), indicating that Cyp2d is primarily responsible for DLX oxidative metabolism in mice. But a lesser impact of Cyp2d inhibition on DLX exposures in KO animals compared to WT animals was observed, which could be explained by the decreased AUC of DLX in Cyp1a2-KO mice as discussed above. We also compared the effects of Cyp2d inhibitor on the ranking of DX metabolites in each tissue. Cyp2d inhibitor reversed the ranking of DLX phase II metabolites M15 and M16 in WT mouse plasma and brain, but not in other WT mouse tissues and Cyp1a2-KO mice (Supplementary Fig. 1). Cyp2d inhibitor also reversed the ranking of phase I metabolites M3 and M4 in WT mouse plasma and lung, as well as in both WT and Cyp1a2-KO mouse kidney and epididymis, but not in other tissues. Cyp2d inhibitor has no effects on the ranking of metabolites M28 and M29 in both WT and Cyp1a2-KO mice (Supplementary Fig. 2).
Nevertheless, the previous clinical studies implied that CYP1A2 inhibitor has more effects on DLX systemic exposure than CYP2D6 (Lobo et al., 2008), and a possible explanation could be the species-differences on DLX metabolism. It is well-known that CYP2D6 are highly polymorphic in human (Ingelman-Sundberg, 2005). Thus, further extensive clinical studies in patients with known CYP2D6 alleles are warranted to elucidate the role of CYP2D6 in deciding the pharmacokinetic profile of DLX in human.
The oxidative metabolites of DLX were not detected in the plasma, while their glucuronic acid conjugates (M15-M18) were observed (Figs. 4B–4E). The sulfate of 1-naphthol (M28) and the glucuronide of 1-naphthol (M29) were also detected as circulating metabolites (Fig. 1 and Figs. 4F–4G), which were not reported in human subjects yet. M16 is one of major circulating metabolite, which is consistent with previous data from human subjects (Knadler et al., 2011; Qin et al., 2022) and M3 is its precursor mainly generated by Cyp2d in MLM (Qin et al., 2022), which was supported by the suppressed formation of M3 in the LS9 from mice treated with Cyp2d inhibitor propranolol (Fig. 3C). Therefore, the abundance of M16 was used as an indicator of Cyp2d activity in vivo. Figs. 4C and 4H show that the AUCs of M16 decreased in the WT + inhibitor and KO + inhibitor compared with their corresponding control groups. Similar phenomenon was observed for M17 (Figs. 4D and 4H) as its precursor might be another monohydroxylated DLX (probably M1) and M1 formation was also mediated CYP2D6 (Qin et al., 2022). These findings implied that Cyp2d inhibitor propranolol successfully suppressed the mouse Cyp2d activity. However, the AUCs of M15 in WT inhibitor and Cyp1a2-KO inhibitor were moderately increased compared to the corresponding control groups (Fig. 4B). Our previous studies suggest that CYP1A2 and CYP2D6 inhibitors only could partially inhibit the formation of its precursor M2 in HLM (Qin et al., 2022). Meanwhile, the mouse LS9 from Cyp1a2-KO has also moderate effect on M2 formation compared to WT LS9 (Fig. 3B). Thus, other unknown enzymes should significantly contribute to M2 formation. Cyp2d inhibitor blocked one of the major pathways (e.g., M16 formation) in DLX metabolism, which may accelerate the other pathways to form more M15 as a compensation. This explanation could be also applied to M18 since it is known that 7 CYPs are involved in its precursor M4 formation (Qin et al., 2022). How Cyp2d inhibitor increased the exposures of M28 and M29 is not clear yet (Figs. 4F, 4G and 4I). In addition, these two metabolites, M28 and M29, are not reported in human metabolism, thus there are no human data available yet. In the future, the metabolism of DLX in human subjects should be revisited.
DLX was widely distributed in diverse organs. Comparing WT + Control with Cyp1a2-KO + Control, Cyp1a2-KO moderately impacted the tissue distribution of DLX (Fig. 5A). In Cyp1a2-KO mice, DLX levels slightly decreased in the liver and elevated in the kidney (Fig. 5A), but the differences are not statistically significant. Meanwhile, Cyp1a2-KO has limited effects on the abundance of DLX metabolites in various tissues: M3 (Fig. 5B), M4 (Fig. 5C), M15 (Fig. 5D), M16 (Fig. 5E), M17 (Fig. 5F), M28 (Fig. 5G) and M29 (Fig. 5H), further suggesting that Cyp1a2 is not the major enzyme contributing to DLX metabolism and tissue distribution in mice. Nevertheless, Cyp2d inhibitor increased the DLX levels in the tissues including brain, kidney, liver, lung, spleen, testis and epididymis from both WT and Cyp1a2-KO mice (Fig. 5A). As expected, Cyp2d inhibitor decreased the levels of metabolites M3, M15, M16 and M17 (Figs. 5B and 5D–F) as the formation of M3 and precursors of M15-M17 are mediated by Cyp2d in mouse liver; Cyp2d inhibitor significantly increased M4 levels in the tissues because multiple enzymes other than Cyp2d mediated its formation (Fig. 5C). No significant differences of the tissue distribution of DLX and its metabolites between WT + Inhibitor and Cyp1a2-KO + Inhibitor (Fig. 5) further indicated that mouse Cyp1a2 plays a minor role in DLX metabolism and mouse Cyp2d contributes more. The levels of M28 and M29 in tissues were elevated by Cyp2d inhibitor, which are consistent with their circulating system exposure (Figs. 5G and 5H). The mechanism of increasing the levels of M28 and M29 remains unclear and needs further investigation. Our tissue distribution study revealed that DLX and its metabolites were the most abundant in kidney followed by liver and lung in WT and Cyp1a2-KO mice with or without Cyp2d inhibitor. DLX levels in kidney were increased by 2.5 folds and 3.9 folds in WT and KO mice by Cyp2d inhibitor, respectively (Fig. 5A). Thus, impaired DLX metabolism in patients could lead to high level of DLX in kidney, which may potentiate the toxicity risk to kidney. These findings may explain why DLX is not recommended for patients with end-stage renal disease and severe kidney diseases (Nguyen et al., 2019). Cyp2d inhibitor also significantly elevated the DLX level in the liver by 1.9 folds and 4.0 folds in WT and KO mice, correspondingly. Clinical studies have suggested that CYP2D6 inhibitors (e.g., fluoxetine) could increase DLX hepatotoxicity (Voican et al., 2014; Wille et al., 2008; Yuan and Williams, 2012). Therefore, blocking DLX metabolism may also increase the potential of the liver injury associated with DLX.
We found that DLX and its metabolites have the relatively lower levels in brain, testis and epididymis compared to those in the other organs, but the effects of Cyp1a2-KO and Cyp2d inhibitor on the distribution of DLX and its metabolites in brain, testis and epididymis are similar to those in the other organs (e.g., liver, kidney) (Fig. 5). The brain, testis and epididymis bear their own biological barriers (blood-brain barrier, blood-testis barrier and blood-epididymis barrier) (Ghafouri-Fard et al., 2021; Zhao et al., 2022). These barriers could restrict the drug uptake, which may result in the low distributions of DLX and its metabolites in these organs. How these barriers work are not discussed here, as it is beyond the scope of this study.
In summary, the present study investigated the pharmacokinetic profiles and tissue distribution of DLX and its major metabolites when the Cyp1a2 and/or Cyp2d activities were lost or inhibited, correspondingly. In Cyp1a2-KO mice, the circulating concentration of DLX and its tissue concentration were slightly decreased, but Cyp1a2-KO has few effects on the exposures and tissue distribution of DLX metabolites. However, Cyp2d inhibitor significantly increased the DLX level in the circulating system and tissues and decreased the levels of those of DLX conjugated metabolites that derived from Cyp2d metabolism. Our findings from the present study indicated that Cyp2d plays a more fundamental role in deciding DLX pharmacokinetic profile and tissue disposition in mice. The previous clinical studies implied that human CYP1A2 has more effects on DLX systemic exposure in humans. The differences in metabolism of DLX could be attributed to the species differences of P450s. Thus, further studies in liver-humanized mice or clinical studies concerning CYP1A2 and CYP2D6 inhibitors-DLX interaction could clarify their roles in DLX pharmacokinetics. These studies will be very valuable to predict the drug-DLX interaction, to minizine the adverse effects in clinical and to determine the involvement of DLX metabolism in its toxicity.
Supplementary Material
Acknowledgments
This work was supported by the National Institute of Diabetes and Digestive and Kidney (R01-DK121970) the Eunice Kennedy Shriver National Institute of Child Health and Human Development (R61/R33HD099995) to Dr. Feng Li; the Eunice Kennedy Shriver National Institute of Child Health and Human Development (P01 HD087157, R01 HD110038) and Bill and Melinda Gates Foundation (INV-001902) to Dr. Martin M. Matzuk. We also would like to thank the Genetically Engineered Rodent Models Core, Advanced Technology Cores, Baylor College of Medicine for the generation of Cyp1a2-KO mice.
Abbreviations:
- P450
cytochrome P450
- Cyp1a2-KO
Cyp1a2 knockout
- DLX
duloxetine
- AUC
area under the plasma concentration–time curve
- WT
wild-type
- NADPH
reduced nicotinamide adenine dinucleotide phosphate
- PBS
phosphate buffered saline
- NFDM
nonfat dry milk
- LS9
liver S9 fraction
- IS
internal standard
- LC-MS
liquid chromatography coupled with mass spectrometer
- gRNAs
guide RNAs
- Q Exactive MS
Q Exactive™ Hybrid Quadrupole-Orbitrap™ mass spectrometer
- RT
retention time
- T1/2
half-life
- CL/F
clearance normalized by bioavailability
- Vd/F
apparent volume of distribution normalized by bioavailability
- MRT
the mean residence time during the period of observation
- Tmax
time to reach maximum plasma concentration
- Cmax
maximum plasma concentration
- HLM/MLM
human and mouse liver microsomes
- UHPLC
ultra-high-performance liquid chromatography
Footnotes
Declaration of Competing Interest
No author has an actual or perceived conflict of interest with the contents of this article.
CRediT authorship contribution statement
Xuan Qin: Investigation, Methodology, Formal analysis, Writing – review & editing. Cen Xie: Investigation, Methodology. John M. Hakenjos: Investigation. Kevin R. MacKenzie: Formal analysis, Writing – review & editing. Shelton R. Boyd: Investigation, Formal analysis. Mercedes Barzi: Investigation. Karl-Dimiter Bissig: Formal analysis. Damian W. Young: Formal analysis. Feng Li: Conceptualization, Investigation, Formal analysis, Resources, Writing – review & editing, Supervision, Project administration, Funding acquisition.
Supplementary materials
Supplementary material associated with this article can be found, in the online version, at doi:10.1016/j.ejps.2022.106358.
Data Availability
Data will be made available on request.
References
- Bech P, Kajdasz DK, Porsdal V, 2006. Dose-response relationship of duloxetine in placebo-controlled clinical trials in patients with major depressive disorder. Psychopharmacology (Berl.) 188, 273–280. [DOI] [PubMed] [Google Scholar]
- Bellingham GA, Peng PW, 2010. Duloxetine: a review of its pharmacology and use in chronic pain management. Reg. Anesth. Pain Med. 35, 294–303. [DOI] [PubMed] [Google Scholar]
- Bunchorntavakul C, Reddy KR, 2017. Drug hepatotoxicity: newer agents. Clin. Liver Dis. 21, 115–134. [DOI] [PubMed] [Google Scholar]
- Choudhary D, Jansson I, Schenkman JB, Sarfarazi M, Stoilov I, 2003. Comparative expression profiling of 40 mouse cytochrome P450 genes in embryonic and adult tissues. Arch. Biochem. Biophys. 414, 91–100. [DOI] [PubMed] [Google Scholar]
- DeSanty KP, Amabile CM, 2007. Antidepressant-induced liver injury. Ann. Pharmacother. 41, 1201–1211. [DOI] [PubMed] [Google Scholar]
- Ghafouri-Fard S, Shoorei H, Mohaqiq M, Haidar Abbas Raza S, Taheri M, 2021. The role of different compounds on the integrity of blood-testis barrier: a concise review based on in vitro and in vivo studies. Gene 780, 145531. [DOI] [PubMed] [Google Scholar]
- Goldstein DJ, Lu Y, Detke MJ, Lee TC, Iyengar S, 2005. Duloxetine vs. placebo in patients with painful diabetic neuropathy. Pain 116, 109–118. [DOI] [PubMed] [Google Scholar]
- Gramec D, Peterlin Masic L, Sollner Dolenc M, 2014. Bioactivation potential of thiophene-containing drugs. Chem. Res. Toxicol. 27, 1344–1358. [DOI] [PubMed] [Google Scholar]
- Guay DR, 2005. Duloxetine for management of stress urinary incontinence. Am. J. Geriatr. Pharmacother. 3, 25–38. [DOI] [PubMed] [Google Scholar]
- Ingelman-Sundberg M, 2005. Genetic polymorphisms of cytochrome P450 2D6 (CYP2D6): clinical consequences, evolutionary aspects and functional diversity. Pharmacogenomics J. 5, 6–13. [DOI] [PubMed] [Google Scholar]
- Knadler MP, Lobo E, Chappell J, Bergstrom R, 2011. Duloxetine: clinical pharmacokinetics and drug interactions. Clin. Pharmacokinet. 50, 281–294. [DOI] [PubMed] [Google Scholar]
- Lantz RJ, Gillespie TA, Rash TJ, Kuo F, Skinner M, Kuan HY, Knadler MP, 2003. Metabolism, excretion, and pharmacokinetics of duloxetine in healthy human subjects. Drug Metab. Dispos. 31, 1142–1150. [DOI] [PubMed] [Google Scholar]
- Lanza DG, Gaspero A, Lorenzo I, Liao L, Zheng P, Wang Y, Deng Y, Cheng C, Zhang C, Seavitt JR, DeMayo FJ, Xu J, Dickinson ME, Beaudet AL, Heaney JD, 2018. Comparative analysis of single-stranded DNA donors to generate conditional null mouse alleles. BMC Biol. 16, 69. [DOI] [PMC free article] [PubMed] [Google Scholar]
- Li F, Zhang N, Gorantla S, Gilbertson SR, Pati D, 2018. The metabolism of separase inhibitor sepin-1 in human, mouse, and rat liver microsomes. Front. Pharmacol. 9, 313. [DOI] [PMC free article] [PubMed] [Google Scholar]
- Lobo ED, Bergstrom RF, Reddy S, Quinlan T, Chappell J, Hong Q, Ring B, Knadler MP, 2008. In vitro and in vivo evaluations of cytochrome P450 1A2 interactions with duloxetine. Clin. Pharmacokinet 47, 191–202. [DOI] [PubMed] [Google Scholar]
- Millard RJ, Moore K, Rencken R, Yalcin I, Bump RC, Duloxetine UISG, 2004. Duloxetine vs placebo in the treatment of stress urinary incontinence: a four-continent randomized clinical trial. BJU Int. 93, 311–318. [DOI] [PubMed] [Google Scholar]
- Nair AB, Jacob S, 2016. A simple practice guide for dose conversion between animals and human. J. Basic Clin. Pharm. 7, 27–31. [DOI] [PMC free article] [PubMed] [Google Scholar]
- Nelson JC, Wohlreich MM, Mallinckrodt CH, Detke MJ, Watkin JG, Kennedy JS, 2005. Duloxetine for the treatment of major depressive disorder in older patients. Am. J. Geriatr. Psychiatry 13, 227–235. [DOI] [PubMed] [Google Scholar]
- Nguyen T, Shoukhardin I, Gouse A, 2019. Duloxetine uses in patients with kidney disease: different recommendations from the United States versus Europe and Canada. Am. J. Ther. 26, e516–e519. [DOI] [PubMed] [Google Scholar]
- Park K, Kim S, Ko YJ, Park BJ, 2020. Duloxetine and cardiovascular adverse events: a systematic review and meta-analysis. J. Psychiatr. Res. 124, 109–114. [DOI] [PubMed] [Google Scholar]
- Qin X, Hakenjos JM, MacKenzie KR, Barzi M, Chavan H, Nyshadham P, Wang J, Jung SY, Guner JZ, Chen S, Guo L, Krishnamurthy P, Bissig KD, Palmer S, Matzuk MM, Li F, 2022. Metabolism of a selective serotonin and norepinephrine reuptake inhibitor duloxetine in liver microsomes and mice. Drug Metab. Dispos. 50, 128–139. [DOI] [PMC free article] [PubMed] [Google Scholar]
- Raskin J, Pritchett YL, Wang F, D’Souza DN, Waninger AL, Iyengar S, Wernicke JF, 2005. A double-blind, randomized multicenter trial comparing duloxetine with placebo in the management of diabetic peripheral neuropathic pain. Pain Med. 6, 346–356. [DOI] [PubMed] [Google Scholar]
- Stroup BM, Marom R, Li X, Hsu CW, Chang CY, Truong LD, Dawson B, Grafe I, Chen Y, Jiang MM, Lanza D, Green JR, Sun Q, Barrish JP, Ani S, Christiansen AE, Seavitt JR, Dickinson ME, Kheradmand F, Heaney JD, Lee B, Burrage LC, 2020. A global Slc7a7 knockout mouse model demonstrates characteristic phenotypes of human lysinuric protein intolerance. Hum. Mol. Genet. 29, 2171–2184. [DOI] [PMC free article] [PubMed] [Google Scholar]
- Tolledo EC, Miksys S, Gonzalez FJ, Tyndale RF, 2020. Propranolol is a mechanism-based inhibitor of CYP2D and CYP2D6 in humanized CYP2D6-transgenic mice: effects on activity and drug responses. Br. J. Pharmacol. 177, 701–712. [DOI] [PMC free article] [PubMed] [Google Scholar]
- Voican CS, Corruble E, Naveau S, Perlemuter G, 2014. Antidepressant-induced liver injury: a review for clinicians. Am. J. Psychiatry 171, 404–415. [DOI] [PubMed] [Google Scholar]
- Wille SM, Cooreman SG, Neels HM, Lambert WE, 2008. Relevant issues in the monitoring and the toxicology of antidepressants. Crit. Rev. Clin. Lab. Sci. 45, 25–89. [DOI] [PubMed] [Google Scholar]
- Yuan W, Williams B, 2012. Acute hepatic failure involving duloxetine hydrochloride. J. Neuropsychiatry Clin. Neurosci. 24, E48–E49. [DOI] [PubMed] [Google Scholar]
- Zhao Y, Gan L, Ren L, Lin Y, Ma C, Lin X, 2022. Factors influencing the blood-brain barrier permeability. Brain Res. 1788, 147937. [DOI] [PubMed] [Google Scholar]
Associated Data
This section collects any data citations, data availability statements, or supplementary materials included in this article.
Supplementary Materials
Data Availability Statement
Data will be made available on request.