

Abstract
BACKGROUND: Although invasive Escherichia coli disease (IED) can lead to severe clinical outcomes, little is known about the associated medical resource use and cost burden of IED in US hospitals.
OBJECTIVE: To comprehensively describe medical resource use and costs associated with IED during the initial IED event and over the subsequent 12 months.
METHODS: Patients aged 60 years or older with 1 or more IED encounters were identified from the PINC AI Healthcare US hospital database (October 1, 2015, to March 31, 2020). The index encounter was defined as the first encounter with a positive E coli culture in a normally sterile site (group 1 IED) or positive E coli culture in urine with signs of sepsis (group 2 IED). Encounters with a positive culture from other bacteria or fungal pathogens were excluded. Outcomes were descriptively reported between admission and discharge for the index encounter and more than 1 - year post-index discharge. Medical resource use and costs included inpatient admissions and outpatient hospital services; costs were reported from a hospital’s perspective (ie, charged amount) in 2021 USD.
RESULTS: A total of 19,773 patients were identified (group 1 IED = 51.8%; group 2 IED = 48.2%). Mean age was 76.8 years, 67.4% were female, and 82.1% were White. Most index encounters were community-onset (94.3%) and led to hospitalization (96.5%) (mean inpatient days = 6.9 days). During the 1 - year post-index, 36.8% of patients had 1 or more all-cause hospitalizations. Mean [median] total all-cause hospital costs (as captured through the PINC AI Healthcare database) amounted to $16,760 [$11,340] during the index encounter and $10,942 [$804] during the 1 - year post-index; these costs were higher in the presence of sepsis and multidrug resistance and among hospital-onset IED.
CONCLUSIONS: IED is associated with a substantial medical resource use and economic burden both during the initial encounter and over the following year in older adults. This highlights the critical need and potential benefits of preventive measures that may reduce the incidence of IED and associated economic burden.
DISCLOSURES: This study was funded by Janssen Global Services, LLC. Dr Hernandez-Pastor is an employee of Janssen Pharmaceutica NV. Dr Geurtsen is an employee of Janssen Vaccines & Prevention BV. Dr Baugh is an employee of Janssen Research & Development, LLC. Dr El Khoury is an employee of Janssen Global Services, LLC. Dr Kalu and Dr Krishnarajah are employees of Janssen Scientific Affairs, LLC. Dr Gauthier-Loiselle, Ms Bungay, and Mr Cloutier are employees of Analysis Group, Inc., a consulting company that provided paid consulting services to Janssen Global Services, LLC. Dr Saade received consultation and speaker fees from Janssen.
Plain language summary
This retrospective study shows that invasive Escherichia coli disease (IED) can be associated with substantial medical resource use and hospital costs among older adults in the United States, both during the initial hospital encounter and the following year, particularly in those with sepsis and multidrug resistance. The significant economic burden experienced beyond the initial hospital encounter points to a long-term impact of IED, which may be compounded by increasing age and prevalence of comorbidities.
Implications for managed care pharmacy
Despite the significant clinical burden of IED, awareness remains low and little is known about medical resource use and costs among older patients. Using data from US hospitals, this study showed that IED was associated with a substantial economic burden during the initial encounter and following year, highlighting the need for increased IED awareness and potential benefits of preventive measures.
Escherichia coli (E coli) is a common gram-negative bacterium found in the human gastrointestinal tract, which typically remains innocuous as part of the commensal strains of bacterium, but may also cause intestinal disease, such as watery and/or bloody diarrhea among others.1,2 In addition, a phylogenetically distinct variant of E coli, known as extraintestinal pathogenic E coli, can colonize and infect extraintestinal sites and presents an important clinical challenge as it can cause invasive E coli disease (IED).3-5 IED may be defined clinically as an infection with acute systemic consequences, confirmed microbiologically by the isolation and identification of E coli from blood or any other sterile body site (eg, cerebrospinal fluid, pleural cavity, peritoneal space, bone, and joints), or by the isolation and identification of E coli from urine in patients with urosepsis and no other identifiable source of infection.1,4,6 IED encompasses various types of severe infections, such as urosepsis, meningitis, bacteremia, and peritonitis.3,5,7,8 Importantly, IED can lead to potentially serious consequences, including mortality, and is among the leading causes of hospital-onset sepsis and the primary cause of communityonset sepsis.5,9,10
Although there is limited information on the clinical and economic burden posed by IED in the United States, a recent international retrospective study of patients admitted to tertiary care hospitals documented substantial medical resource use associated with IED, along with a case fatality rate of approximately 1 in 5 patients.4 Further, costs associated with IED are expected to be especially large when sepsis is present, as it was previously found that costs among patients with sepsis can reach as much as $40,000 per hospital encounter,11 with substantial incremental health care costs due to multidrug resistant (MDR) bacteria.11,12 Accordingly, the medical resource use and related costs associated with IED, particularly in the face of a growing aging demographic, are expected to represent a significant burden on the US health care system and payers, although this has not been fully documented yet. Therefore, this study was conducted to address the evidence gap and provides a comprehensive description of the medical resource use and cost burden of IED during the initial IED event from the hospital perspective, as well as over a 12 - month follow-up period, including a comparison of health care costs by type of IED, location of onset, and MDR vs non-MDR status.
Methods
DATA SOURCE
The PINC AI Healthcare database (PHD) was used to conduct this study by accessing data from October 1, 2015, to March 31, 2020. This database includes data for detailed inpatient services from patients admitted to a representative set of more than 1,000 US hospitals nationwide and includes admission-level information (eg, patient characteristics, primary and secondary admitting diagnoses), detailed day-of-service billing information during hospitalizations (eg, inpatient procedures and medications used by day of stay), and discharge-level data (eg, length of stay, discharge status). Data in this database are deidentified and comply with the requirements of the Health Insurance Portability and Accountability Act; therefore, no institutional review board approval was required.
STUDY DESIGN AND SAMPLE SELECTION
A retrospective study design was used to conduct this study (all relevant diagnostic and procedural codes are described in Supplementary Table 1, available in online article). In order to capture the course of disease, the index date for a given patient was defined as the date of the first positive E coli culture during the first documented hospital IED encounter, which was defined as the index encounter. The observation period was defined as the 12 - month period following the index date (Supplementary Figure 1). Patients with 1 or more IED encounters who were aged 60 years or older as of the index date were included in the study if their IED encounter occurred in a hospital that continuously contributed microbiology data for 6 months or more before and 12 months or more following the index date to better capture patients’ first IED encounter as of the index date and ensure that a meaningful duration of observation is available.
IED encounters were defined by infection type as either group 1 or group 2 IED (Figure 1). Group 1 IED was characterized by a positive culture of E coli in blood or other normally sterile body sites (ie, cerebrospinal fluid, pleural fluid [chest fluid, thoracentesis fluid], peritoneal fluid [abdominal fluid, ascites], pericardial fluid, bone [including bone marrow], joint fluid [synovial fluid, fluid, needle aspirate, or culture of any specific joint such as the knee, ankle, elbow, hip, wrist], and internal body sites [lymph node, brain, heart, liver, spleen, vitreous fluid, kidney, pancreas, ovary, vascular tissue, deep wound]) and 1 or more signs of systemic inflammatory response syndrome or signs of sepsis (as per the Centers for Disease Control [CDC] clinical surveillance definition13) and without positive culture for other bacterial or fungal pathogens. Group 2 IED was characterized by a positive culture of E coli in urine in the presence of signs of sepsis (as per the CDC clinical surveillance definition13) and a diagnosis for a urinary tract infection (UTI) (see Supplementary Table 1) and without a positive culture of E coli in blood or normally sterile body sites nor a positive culture for other bacteria or fungal pathogens.
FIGURE 1.

IED Type
MEASURES, OUTCOMES, AND STATISTICAL ANALYSES
Descriptive statistics were reported using means, SDs, and medians for continuous variables, and frequency counts and percentages were reported for categorical variables.
Patient characteristics, including age, sex, and Charlson Comorbidity Index score,14,15 hospital characteristics, as well as index IED characteristics, such as onset location (hospital or community, including health care associated and nonhealth care associated) (see Supplementary Table 1), IED type (group 1 or 2), and subtype of infection (eg, urosepsis with/without bacteremia, meningitis, identified based on diagnosis codes and/or culture site),16 were described. Medical resource use, including medical services received in inpatient and outpatient hospital settings, were descriptively reported for the index encounter and over the 12 - month observation period thereafter. Medical costs were adjusted to 2021 US dollars using the medical component of the Consumer Price Index and were reported per patient from a hospital’s perspective (ie, charged amount) for the index encounter and over the 12 - month observation period, separately. Medical resource use and costs were reported for all-cause and infection-related encounters (ie, medical services and costs for encounters during which any diagnosis for infection was recorded) (see Supplementary Table 1). Costs were stratified and compared by IED type (group 1 vs group 2 and group 1 with sepsis vs group 2), onset (hospital vs community, defined based on the date of the positive E coli culture from a normally sterile site or urine ≥ 3 days vs ≤ 2 days after hospital admission17-20), and the presence of MDR E coli (defined as resistance to ≥ 3 categories of relevant antibiotics) (see Supplementary Table 2). Statistical comparisons between subgroups were conducted with Wilcoxon rank-sum tests for the continuous variables and chi-square tests for the categorical variables. Analyses were conducted using SAS Enterprise software programs (version 7.1).
Results
STUDY SAMPLE AND PATIENT CHARACTERISTICS
A total of 19,773 eligible patients aged 60 years or older with 1 or more IED encounters between October 1, 2015, and March 31, 2019, in a US hospital was identified (Supplementary Figure 2). The mean (median) age was 76.8 (77.0) years, 67.4% were female, and 82.1% were White (Table 1). Approximately 40.0% of index encounters occurred at teaching hospitals, with 30.5% occurring in hospitals with 500 or more beds. All US regions were represented, though most index encounters occurred in hospitals that were located in the South (55.9%) and served an urban population (84.1%).
TABLE 1.
Patient, Hospital, and Index Encounter Characteristics
| All patients (N = 19,773) | |
|---|---|
| Demographic characteristics | |
| Age, years, mean ± SD (median) | 76.8 ± 8.9 (77.0) |
| < 65, n (%) | 2,231 (11.3) |
| 65-74, n (%) | 5,876 (29.7) |
| 75-84, n (%) | 6,510 (32.9) |
| ≥ 85, n (%) | 5,156 (26.1) |
| Sex, n (%) | |
| Female | 13,321 (67.4) |
| Male | 6,451 (32.6) |
| Unknown | 1 (0.0) |
| Race, n (%) | |
| White | 16,234 (82.1) |
| Black | 1,799 (9.1) |
| Asian | 646 (3.3) |
| Other | 909 (4.6) |
| Unknown | 185 (0.9) |
| CCI score, mean ± SD (median) | 2.5 ± 2.1 (2.0) |
| ≥ 3, n (%) | 8,398 (42.5) |
| Comorbidities, n (%)a | |
| AIDS/HIV | 21 (0.1) |
| Cancer | 2,102 (10.6) |
| Metastatic solid tumor | 807 (4.1) |
| Cerebrovascular disease | 1,811 (9.2) |
| Chronic pulmonary disease | 5,036 (25.5) |
| Congestive heart failure | 5,803 (29.3) |
| Dementia | 4,465 (22.6) |
| Diabetes without chronic complications | 4,266 (21.6) |
| Diabetes with complications | 3,992 (20.2) |
| Hemiplegia or paraplegia | 427 (2.2) |
| High blood pressure | 15,849 (80.2) |
| Mild liver disease | 890 (4.5) |
| Moderate or severe liver disease | 430 (2.2) |
| Myocardial infarction | 2,942 (14.9) |
| Peptic ulcer disease | 360 (1.8) |
| Peripheral vascular disease | 2,066 (10.4) |
| Renal disease | 6,529 (33.0) |
| Rheumatic disease | 933 (4.7) |
| Hospital characteristics | |
| No. of beds, n (%) | |
| 0-99 | 1,633 (8.3) |
| 100-199 | 3,345 (16.9) |
| 200-299 | 3,131 (15.8) |
| 300-399 | 3,189 (16.1) |
| 400-499 | 2,443 (12.4) |
| ≥ 500 | 6,032 (30.5) |
| Region, n (%) | |
| Midwest | 4,721 (23.9) |
| Northeast | 3,271 (16.5) |
| South | 11,046 (55.9) |
| West | 735 (3.7) |
| Teaching hospital, n (%) | 7,909 (40.0) |
| Population served, n (%) | |
| Urban | 16,638 (84.1) |
| Rural | 3,135 (15.9) |
| Index encounter characteristics | |
| Onset of IED, n (%)b | |
| Hospital-onset | 1,125 (5.7) |
| Community-onset | 18,648 (94.3) |
| Health care–associated community-acquired | 4,787 (25.7) |
| Non–health care–associated community-acquired | 13,861 (74.3) |
| Point of origin, n (%) | |
| Transfer from other health care facility | 856 (4.3) |
| Non–health care facility | 16,820 (85.1) |
| Clinic | 1,212 (6.1) |
| SNF/ICF | 821 (4.2) |
| Other | 64 (0.3) |
| Discharge status, n (%) | |
| Home | 8,695 (44.0) |
| Other health care facility | 810 (4.1) |
| Hospice | 1,101 (5.6) |
| SNF/ICF | 6,864 (34.8) |
| Rehab/long-term care/nursing facility | 860 (4.3) |
| Died | 1,348 (6.8) |
| Other | 95 (0.5) |
| IED type, n (%) | |
| Group 1 | 10,235 (51.8) |
| Group 1 with sepsis | 5,978 (30.2) |
| Group 2 | 9,538 (48.2) |
| Subtype of infection, n (%) | |
| Urosepsis without bacteremia | 9,538 (48.2) |
| Urosepsis with bacteremia | 5,791 (29.3) |
| Cholangitis | 299 (1.5) |
| Peritonitis | 179 (0.9) |
| Other intra-abdominal infection | 1 (0.0) |
| Neutropenic fever | 166 (0.8) |
| Wound/surgical site infection | 157 (0.8) |
| Osteomyelitis | 39 (0.2) |
| Prostate biopsy-related infection | 9 (0.0) |
| Meningitis | 7 (0.0) |
| Complicated pneumonia | 0 (0.0) |
| Other blood stream infections | 3,774 (19.1) |
| Other | 37 (0.2) |
| Type of encounter, n (%) | |
| Inpatient stay with ICU | 6,405 (32.4) |
| Duration of inpatient stay, days, mean ± SD (median) | 5.94 ± 4.34 (5.00) |
| 1-5, n (%) | 7,554 (59.6) |
| 6-10, n (%) | 4,012 (31.6) |
| 11-15, n (%) | 711 (5.6) |
| > 15, n (%) | 402 (3.2) |
| Transferred to ICU on the same day as admission, n (%) | 4,774 (74.5) |
| Time between admission and ICU transfer, mean ± SD (median) | 0.8 ± 2.4 (0.0) |
| Duration of ICU stay, days, mean ± SD (median) | 3.7 ± 4.1 (2.0) |
| Inpatient stay without ICU | 12,679 (64.1) |
| Duration of inpatient stay, days, mean ± SD (median) | 5.94 ± 4.34 (5.00) |
| 1-5, n (%) | 7,554 (59.6) |
| 6-10, n (%) | 4,012 (31.6) |
| 11-15, n (%) | 711 (5.6) |
| > 15, n (%) | 402 (3.2) |
| Emergency department visit | 554 (2.8) |
| Outpatient hospital visit | 135 (0.7) |
| Mechanical ventilation, n (%) | 1,710 (8.6) |
| IED-related antibiotic treatment | |
| No. of courses (class level) received, mean ± SD (median) | 2.5 ± 1.2 (2.0) |
| ≥ 4, n (%) | 3,957 (20.0) |
| No. of courses (agent level) received, mean ± SD (median) | 2.9 ± 1.4 (3.0) |
| ≥ 4, n (%) | 5,944 (30.1) |
| Patients with ≥ 1 susceptibility test result, n (%) | 19,381 (98.0) |
| Resistance to ≥ 1 antibiotic category | 11,964 (61.7) |
| Resistance to ≥ 3 antibiotic categories | 6,672 (34.4) |
aMore than 1 option could apply (ie, categories are not mutually exclusive).
bHospital-onset IED was defined as the presence of positive or presumptively positive E coli culture from a normally sterile site or urine collected 3 days or more after the initial admission to hospital, when the infection was not present at admission; community-onset IED was defined as a positive or presumptively positive E coli culture from a normally sterile site or urine collected on day 1 or 2 after hospital admission. Community-onset IED was classified as health care–associated if any of the following conditions were met: (1) a documented procedure code for anesthesia, surgery, hemodialysis, chemotherapy, or other injections within 30 days of the index encounter; (2) a hospitalization for 2 days or more within 90 days of the index encounter; and/or (3) transferred from a nursing home or long-term care facility.
CCI = Charlson Comorbidity Index; ICF = intermediate care facility; ICU = intensive care unit; IED = invasive Escherichia coli disease; SNF = skilled nursing facility.
The mean (median) Charlson Comorbidity Index score was 2.5 (2.0), with 42.5% of patients having a score of 3 or more. The most common comorbidities at the index date were high blood pressure (80.2%), renal disease (33.0%), congestive heart failure (29.3%), chronic pulmonary disease (25.5%), and dementia (22.6%).
By infection type, 10,235 patients (51.8%) had IED with microbiological confirmation of E coli from blood or a normally sterile body site (ie, group 1 IED, including 5,978 in group 1 IED who had signs of sepsis), and 9,538 patients (48.2%) had IED with microbiological confirmation of E coli from urine with signs of sepsis (group 2 IED) (Table 1). Urosepsis was the most frequent subtype of IED observed (without bacteremia = 48.2%; with bacteremia = 29.3%). Most patients (94.3%) acquired IED in a community setting rather than hospital onset, with 25.7% of community-onset encounters being health care associated. Nearly all patients (98.0%) had 1 or more susceptibility test results available; among them, the proportion of patients with resistance to 1 or more antibiotic categories was 61.7%, and 34.4% had MDR E coli. Although the point of origin of 85.1% of index encounters was a nonhealth care facility, only 44.0% of patients were discharged to their home, and 34.8% were discharged to a skilled nursing facility (SNF) or an intermediate care facility (ICF) following the encounter; another 6.8% died during the index encounters.
MEDICAL RESOURCE USE
The most frequent type of index encounter was inpatient stays without intensive care unit (ICU) services (64.1%; mean [median] stay duration = 5.9 [5.0] days), and inpatient stays with ICU services (32.4%; mean [median] stay duration = 8.8 [7.0] days). Among patients who received medical services in an ICU, 74.5% were admitted to an ICU on the same day as the index encounter (mean time to ICU admission = 0.8 days), and the mean (median) stay duration in an ICU was 3.7 (2.0) days. Only 2.8% of patients presented at the emergency department without a subsequent inpatient stay, and 0.7% had their index encounter at an outpatient hospital visit. During the index encounter, 8.6% of patients required mechanical ventilation. On average, patients were treated with a mean (median) of 2.5 (2.0) antibiotic classes and 2.9 (3.0) agents (Table 1).
During the 12 - month observation period (excluding the index encounter), 36.8% of patients had 1 or more all-cause inpatient stays with a mean (median) of 10.6 (7.0) inpatient days; 37.7% of these patients were rehospitalized within 30 days of discharge from the index encounter (Figure 2). During the same period, 21.9% of patients had 1 or more all-cause emergency department visits, and 34.4% had 1 or more all-cause outpatient hospital visits.
FIGURE 2.
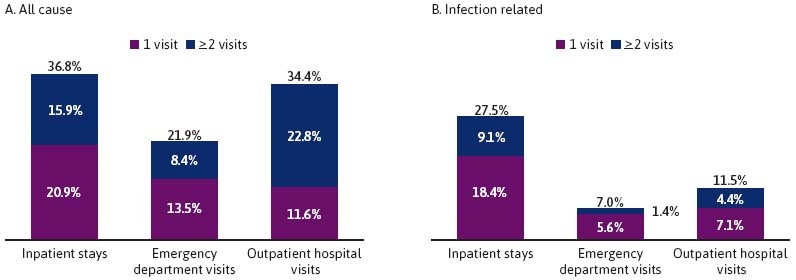
All-Cause Medical Resource Use in the 12-Month Observation Period (Excluding the Index Encounter)
With regard to infection-related medical resource use during the 12 - month observation period (excluding the index encounter), 27.5% of patients had 1 or more infection-related inpatient stays with a mean (median) of 10.0 (6.0) inpatient days. During the same period, 7.0% of patients had 1 or more infection-related emergency department visits, and 11.5% had 1 or more infection-related outpatient hospital visits (Figure 2).
MEDICAL COSTS FROM THE HOSPITAL’S PERSPECTIVE (IE, CHARGED AMOUNT)
During the index encounter, the mean (median) total medical costs amounted to $16,760 ($11,340) driven by $16,689 ($11,320) in inpatient costs, of which $5,363 ($0) were ICU costs (Figure 3).
FIGURE 3.
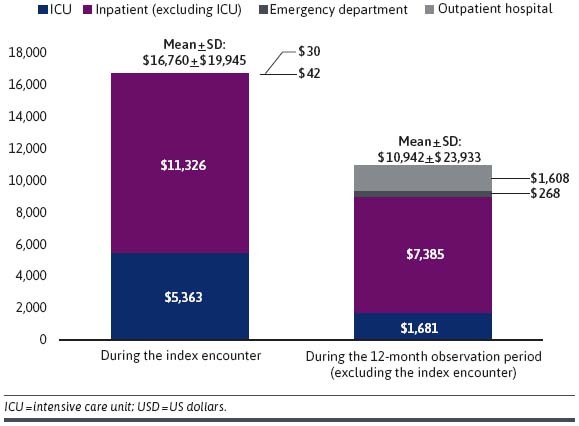
All-Cause Medical Costs per Patient (2021 USD)
During the 12 - month observation period, which excluded the index encounter, mean (median) total medical costs amounted to $10,942 ($804), which were also driven by inpatient costs of $9,066 ($0) (Figure 3). During the same period, the mean (median) total infection-related medical costs were $6,626 ($0), of which $6,265 ($0) corresponded to inpatient costs.
SUBGROUP ANALYSES
Compared with patients with group 2 IED, patients with group 1 IED incurred lower mean [median] medical costs during the index encounter (group 1 IED = $15,105 [$10,214]; group 2 IED = $18,536 [$12,641], P < 0.001) (Table 2). Although costs among patients with group 2 IED were more comparable to the subset of patients with group 1 IED with sepsis, ($18,910 [$13,113]), there was nonetheless a statistically significant difference (P < 0.001). Of note, the subgroups experiencing the highest costs were also the ones for which the proportion of ICU admissions were the highest (group 1 IED with sepsis = 43.2% ICU admission, group 2 IED = 35.4% ICU admission, group 1 IED [ie, with or without sepsis] = 29.6% ICU admission; all P < 0.01). Differences in costs by IED type were not significantly different during the 12 - month observation period, excluding the index encounter (group 1 IED = $10,186 [$806]; group 1 IED with sepsis = $10,790 [$780]; group 2 IED = $11,754 [$793]; group 1 vs group 2 IED: P = 0.204, group 1 with sepsis vs group 2 IED: P = 0.386).
TABLE 2.
All-Cause Medical Costs per Patient (2021 USD) by Subgroups
| Group 1 (n = 10,235) | Group 2 (n = 9,538) | P value | |
|---|---|---|---|
| Total medical costs during index encounter, mean ± SD (median) | 15,105 ± 20,407 (10,214) | 18,536 ± 19,282 (12,641) | < 0.0001 |
| Inpatient costs | 14,618 ± 20,183 (9,895) | 18,210 ± 19,044 (12,387) | < 0.0001 |
| ICU costs | 4,583 ± 15,305 (0) | 6,201 ± 14,713 (0) | < 0.0001 |
| Emergency department costs | 79 ± 406 (0) | — | — |
| Outpatient costs | 57 ± 757 (0) | — | — |
| Total medical costs during the 12-month observation period, mean ± SD (median)a | 10,186 ± 23,530 (806) | 11,754 ± 24,334 (793) | 0.2039 |
| Inpatient costs | 7,834 ± 20,325 (0) | 9,954 ± 22,052 (0) | < 0.0001 |
| ICU costs | 1,377 ± 7,753 (0) | 2,008 ± 9,379 (0) | < 0.0001 |
| Emergency department costs | 272 ± 800 (0) | 261 ± 896 (0) | 0.0041 |
| Outpatient costs | 1,865 ± 7,604 (0) | 1,298 ± 6,215 (0) | < 0.0001 |
| Group 1 with sepsis (n = 5,978) | Group 2 (n = 9,538) | P value | |
| Total medical costs during index encounter, mean ± SD (median) | 18,910 ± 23,003 (13,113) | 18,536 ± 19,282 (12,641) | < 0.0001 |
| Inpatient costs | 18,475 ± 22,674 (12,758) | 18,210 ± 19,044 (12,387) | 0.0003 |
| ICU costs | 6,932 ± 18,589 (0) | 6,201 ± 14,713 (0) | < 0.0001 |
| Emergency department costs | — | — | — |
| Outpatient costs | — | — | — |
| Total medical costs during the 12-month observation period, mean ± SD (median)a | 10,790 ± 24,683 (780) | 11,754 ± 24,334 (793) | 0.3861 |
| Inpatient costs | 8,373 ± 21,287 (0) | 9,954 ± 22,052 (0) | < 0.0001 |
| ICU costs | 1,610 ± 8,459 (0) | 2,008 ± 9,379 (0) | < 0.0001 |
| Emergency department costs | 240 ± 709 (0) | 261 ± 896 (0) | 0.7660 |
| Outpatient costs | 1,932 ± 8,261 (0) | 1,298 ± 6,215 (0) | < 0.0001 |
| Hospital-onset (n = 1,125) | Community-onset (n = 18,648) | P value | |
| Total medical costs during index encounter, mean ± SD (median) | 42,794 ± 46,963 (30,138) | 15,190 ± 15,669 (10,867) | < 0.0001 |
| Inpatient costs | 42,141 ± 46,547 (29,795) | 14,795 ± 15,469 (10,566) | < 0.0001 |
| ICU costs | 18,063 ± 40,406 (3,919) | 4,597 ± 11,456 (0) | < 0.0001 |
| Emergency department costs | 1 ± 28 (0) | 43 ± 303 (0) | < 0.0001 |
| Outpatient costs | 73 ± 1,045 (0) | 27 ± 499 (0) | 0.1009 |
| Total medical costs during the 12-month observation period, mean ± SD (median)a | 14,086 ± 33,203 (172) | 10,753 ± 23,244 (831) | 0.1086 |
| Inpatient costs | 11,780 ± 29,670 (0) | 8,680 ± 20,567 (0) | 0.1214 |
| ICU costs | 2,871 ± 14,050 (0) | 1,610 ± 8,130 (0) | 0.0142 |
| Emergency department costs | 199 ± 771 (0) | 271 ± 852 (0) | < 0.0001 |
| Outpatient costs | 1,795 ± 7,976 (0) | 1,579 ± 6,909 (0) | 0.0130 |
| Multidrug resistant (n = 6,672) | Nonmultidrug resistant (n = 13,101) | P value | |
| Total medical costs during index encounter, mean ± SD (median) | 17,863 ± 21,097 (11,970) | 16,199 ± 19,309 (10,988) | < 0.0001 |
| Inpatient costs | 17,358 ± 20,739 (11,581) | 15,838 ± 19,165 (10,706) | < 0.0001 |
| ICU costs | 5,641 ± 15,507 (0) | 5,222 ± 14,801 (0) | 0.0543 |
| Emergency department costs | 39 ± 306 (0) | 42 ± 289 (0) | 0.0914 |
| Outpatient costs | 19 ± 495 (0) | 35 ± 569 (0) | 0.0016 |
| Total medical costs during the 12-month observation period, mean ± SD (median)a | 13,158 ± 26,739 (1,536) | 9,814 ± 22,286 (617) | < 0.0001 |
| Inpatient costs | 10,818 ± 23,564 (0) | 7,858 ± 19,818 (0) | < 0.0001 |
| ICU costs | 2,102 ± 9,190 (0) | 1,467 ± 8,247 (0) | < 0.0001 |
| Emergency department costs | 289 ± 965 (0) | 255 ± 781 (0) | 0.5541 |
| Outpatient costs | 1,736 ± 8,166 (0) | 1,518 ± 6,281 (0) | 0.7028 |
aExcluding costs incurred during the index encounter.
ICU = intensive care unit; IED = invasive Escherichia coli disease; USD = US dollars.
Patients with hospital-onset IED incurred higher mean (median) medical costs during the index encounter compared with community-onset IED ($42,794 [$30,138] vs $15,190 [$10,867]; P < 0.001) (Table 2). It should be noted that this trend remained statistically significant when restricting inpatient costs during the index encounter to those incurred after the index date ($22,834 [$14,483] vs $14,905 [$10,725]) (P < 0.001). This difference in costs can be explained by the higher proportion of patients admitted to the ICU for hospital-onset IED compared with community-onset IED (53.0% vs 31.2%; P < 0.001). During the 12 - month observation period (excluding the index encounter), all-cause medical costs were not significantly different by IED onset (hospital-onset: $14,086 [$172]; community-onset: $10,753 [$831]; P = 0.109).
Medical costs during the index encounter were slightly higher among encounters with MDR E coli compared with those with non-MDR E coli ($17,863 [$11,970] vs $16,199 [$10,988]; P< 0.001) (Table 2), with the cost difference more pronounced over the 12 - month observation period (excluding the index encounter; $13,158 [$1,536] vs $9,814 [$617]; P < 0.001).
Discussion
This retrospective study of US hospitals showed that older patients experiencing IED pose a substantial economic burden on the health care system. Specifically, patients with IED incurred large hospital costs (ie, > $15,000) during their first encounter, as well as during the following year (ie, > $10,000). Among patients with IED, the occurrence of sepsis was found to be an important driver of medical costs, which were also higher among patients with hospital-onset IED compared with community-onset IED and among those with MDR E coli, which was present in more than a third of the sample.
The significant economic burden incurred by patients with IED aligns with previous studies describing costs of care in US hospitals. For example, Paoli et al assessed the costs of sepsis, which was observed to occur in 78.5% of IED cases included in our study. They found that the average total costs could reach as high as $40,000 per patient in discharged adults from the hospital’s perspective between 2010 and 2016, depending on severity, though the sepsis cases were not necessarily specific to E coli.21 One assessment conducted particularly to determine the burden of severe sepsis estimated the national cost to reach 20 billion nationally,22 and another estimated that severe sepsis due to E coli specifically was associated with nearly 3 billion dollars in direct health care costs in the United States.23 Our findings also align with findings of other US studies reporting average duration of sepsis-related hospitalization of 7.7 days21 and 6.9 days,24 as well as ex-US studies reporting average duration of hospitalization of 7.0 days for bacteremia in patients aged greater than 65 years with UTI (nearly two-third of which were associated with E coli).25
The results of the current study also suggest that IED is not only associated with significant burden during the initial episode, but that patients continue to incur substantial costs beyond the initial hospital encounter. Importantly, our study may be expected to underestimate the burden following the initial IED encounter, as medical services received outside of the hospital where the IED occurred were not captured in the database. In particular, costs associated with SNF/ICF would not be considered. These costs are expected to be substantial, given that more than 1 in 3 patients were discharged to SNF/ICF, and it has been shown that SNF/ICF costs represent about one-fifth of the total costs associated with sepsis in Medicare patients.26 Furthermore, we found that more than 1 in 4 patients were rehospitalized in the year following the index IED with an infection-related diagnosis. Given that the incidence of IED has been shown to increase with age,27 and that the focus of this study was on patients aged 60 years or older, these findings are not surprising. For example, older patients experience a deficit in immune function, which along with a high comorbidity burden heightens their predisposition to infections,28 which may lead to poorer long-term outcomes even after the initial encounter is resolved. Alternatively, the IED episode itself may put former patients with IED at higher risk for subsequent infections and hospital admissions. Follow-up studies with matched control cohorts of patients without IED will be needed to further understand the long-term impact of IED on the overall health status.
In the current study, patients who acquired their index IED in a hospital setting (ie, those who already required hospitalization for other health care conditions) tended to incur higher health care costs both during the index IED and in the following year compared with patients with community onset. Nonetheless, findings from this study highlight that a vast majority of patients acquired IED in a community setting and suggest that community-acquired IED accounts for a large portion of the burden of IED on the US health care system consistent with findings from ex-US studies looking at E coli bacteremia.29,30
Importantly, patients with MDR infections incurred higher costs both during the index IED and over the observation period. Consistent with our findings that index encounters with MDR E coli were associated with a $1,664 increase in costs compared with non-MDR E coli, national CDC reports estimate that antibiotic resistance adds approximately $1,400 in incremental hospital costs for treating patients with bacterial infections, amounting to $2 billion in excess direct health care costs per year.31 Notably, older patients (aged ≥ 75 years) and those with multiple comorbidities who have antibiotic resistance were found to incur even higher health care costs.31
One key strength of this study is that the PHD database encompasses detailed admission-level data of inpatient services from patients admitted to more than 1,000 hospitals nationwide representing all US regions. Importantly, it includes microbiology laboratory data with information on specimen source, tests performed, and results for these tests that enables the identification of IED encounters based on microbiological data, which are not available in most other administrative claims databases. Previous studies have used other definitions to identify IED encounters, some of which focus mostly on E coli bacteremia.16 In many instances, clinical sepsis cases lack confirmation from a positive blood culture. A recent publication (Rhee et al) reporting on community-onset sepsis found that urine was the most common source of positive culture, allowing for pathogen identification in 52% of patients.10 Therefore, microbiological confirmation from sources other than blood culture (ie, urine) are deemed to be important to appropriately capture the full burden of IED, especially for community-onset events. In the current study, the definition of IED included both E coli bacteremia and nonbacteremic urosepsis, which we believe may be able to capture a more complete picture of the burden of IED, as nearly half of the IED cases identified were nonbacteremic urosepsis and were found to be associated with a more significant burden than E coli bacteremia.
LIMITATIONS
The results of this study should be viewed in light of certain limitations. First, the PHD database is limited to IED encounters that occurred in a hospital setting or resulted in a hospital admission, and medical resource use for a given patient is only available for encounters at a given hospital, such that medical services received outside of this hospital were not captured. Accordingly, this study may underestimate the total burden associated with IED, especially in the year following the IED encounter as mentioned above. Alternatively, there may also be some overestimation of burden in which this is evaluated from the hospital perspective (ie, charged amounts) and does not represent actual payments made, which may be lower for some services. Second, IED encounters were identified based on information available from microbiology laboratory tests, diagnosis codes, and procedure codes. As a result, some patients may have been misclassified as having, or not having, IED. Nonetheless, for the identification of sepsis, this study relied on the CDC’s clinical surveillance definition, which has been previously validated. Similarly, MDR status was assessed based on sensitivity results available in the database and, given that specimens are not systematically tested for resistance to all possible antibiotics in real-world clinical practice, MDR E coli may have been underestimated in this study. Third, the study outcomes were assessed during the 12 - month period following the index encounter for all patients, regardless of mortality. Because some patients died before the end of the observation period, estimates of medical resource use and costs may have been impacted for these patients. As this study is observational and retrospective in nature, no causal inference can be made based on these descriptive results. Similarly, the descriptive nature of this study was meant to help understand the burden of IED in a real-world setting, including among various subgroups of interest. As patient characteristics were not balanced between subgroups, it is possible that variations present at baseline contributed partly to the differences in outcomes observed during the index encounter and during the observation period among subgroups. Future studies comparing outcomes among patients with IED against a control group, including patients without IED, are warranted to estimate the incremental HCRU and costs associated with IED as well as the impact of various risk factors (eg, MDR) on these costs.
Conclusions
Using a representative dataset of US hospitals, this study showed that IED was associated with substantial hospital costs, both during the initial encounter and in the following year. The significant medical costs observed beyond the initial IED event indicate that the burden of IED continues even after hospital discharge, highlighting the long-term impact of IED. This impact may be further compounded by increasing age and prevalence of comorbidities. MDR E coli was common in IED cases and associated with an incremental cost burden that persisted during the observation period. Preventive measures for IED may alleviate the risk of sepsis and MDR, thereby reducing the economic burden associated with this disease for patients, hospitals, and payers.
ACKNOWLEDGMENTS
Medical writing support was provided by Loraine Georgy, PhD, an employee of Analysis Group, Inc., a consulting company that provided paid consulting services to Janssen Global Services, LLC.
REFERENCES
- 1.Geurtsen J, de Been M, Weerdenburg E, Zomer A, McNally A, Poolman J. Genomics and pathotypes of the many faces of Escherichia coli. FEMS Microbiol Rev. 2022;46(6):fuac031. doi:10.1093/femsre/fuac031 [DOI] [PMC free article] [PubMed] [Google Scholar]
- 2.Mueller M, Tainter CR. Escherichia coli. StatPearls Publishing; 2023. Accessed April 21, 2023. https://www.ncbi.nlm.nih.gov/books/NBK564298/ [Google Scholar]
- 3.Biran D, Ron EZ. Extraintestinal pathogenic Escherichia coli. Curr Top Microbiol Immunol. 2018;416:149-61. doi:10.1007/82_2018_108 [DOI] [PubMed] [Google Scholar]
- 4.Doua J, Geurtsen J, Rodriguez-Bano J, et al. Epidemiology, clinical features, and antimicrobial resistance of invasive escherichia coli disease in patients admitted in tertiary care hospitals. Open Forum Infect Dis. 2023;10(2):ofad026. doi:10.1093/ofid/ofad026 [DOI] [PMC free article] [PubMed] [Google Scholar]
- 5.Poolman JT, Wacker M. Extraintestinal pathogenic Escherichia coli, a common human pathogen: Challenges for vaccine development and progress in the field. J Infect Dis. 2016;213(1):6-13. doi:10.1093/infdis/jiv429 [DOI] [PMC free article] [PubMed] [Google Scholar]
- 6.Fortin SP, Hernandez Pastor L, Doua J, et al. Development and performance characteristics of novel code-based algorithms to identify invasive Escherichia coli disease. Pharmacoepidemiol Drug Saf. 2022;31(9):983-91. doi:10.1002/pds.5505 [DOI] [PubMed] [Google Scholar]
- 7.Kaper JB, Nataro JP, Mobley HL. Pathogenic Escherichia coli. Nat Rev Microbiol. 2004;2(2):123-40. doi:10.1038/nrmicro818 [DOI] [PubMed] [Google Scholar]
- 8.Antimicrobial Resistance Collaborators. Global mortality associated with 33 bacterial pathogens in 2019: A systematic analysis for the Global Burden of Disease Study 2019. Lancet. 2022;400(10369):P2221-48. doi:10.1016/S0140-6736(22)02185-7 [DOI] [PMC free article] [PubMed] [Google Scholar]
- 9.Rhee C, Klompas M. Sepsis trends: Increasing incidence and decreasing mortality, or changing denominator? J Thorac Dis. 2020;12(Suppl 1):S89-100. doi:10.21037/jtd.2019.12.51 [DOI] [PMC free article] [PubMed] [Google Scholar]
- 10.Rhee C, Kadri SS, Dekker JP, et al. Prevalence of antibiotic-resistant pathogens in culture-proven sepsis and outcomes associated with inadequate and broad-spectrum empiric antibiotic use. JAMA Netw Open. 2020;3(4):e202899. doi:10.1001/jamanetworkopen.2020.2899 [DOI] [PMC free article] [PubMed] [Google Scholar]
- 11.Nelson RE, Hatfield KM, Wolford H, et al. National estimates of healthcare costs associated with multidrug-resistant bacterial infections among hospitalized patients in the United States. Clin Infect Dis. 2021;72(Suppl 1):S17-26. doi:10.1093/cid/ciaa1581 [DOI] [PMC free article] [PubMed] [Google Scholar]
- 12.Nelson RE, Hyun D, Jezek A, Samore MH. Mortality, length of stay, and healthcare costs associated with multidrug-resistant bacterial infections among elderly hospitalized patients in the United States. Clin Infect Dis. 2021;74(6):1070-80. doi:10.1093/cid/ciab696 [DOI] [PMC free article] [PubMed] [Google Scholar]
- 13.Rhee C, Dantes R, Epstein L, et al. Incidence and trends of sepsis in US hospitals using clinical vs claims data, 2009-2014. JAMA. 2017;318(13):1241-9. doi:10.1001/jama.2017.13836 [DOI] [PMC free article] [PubMed] [Google Scholar]
- 14.Quan H, Li B, Couris CM, et al. Updating and validating the Charlson comorbidity index and score for risk adjustment in hospital discharge abstracts using data from 6 countries. Am J Epidemiol. 2011;173(6): 676-82. doi:10.1093/aje/kwq433 [DOI] [PubMed] [Google Scholar]
- 15.Quan H, Sundararajan V, Halfon P, et al. Coding algorithms for defining comorbidities in ICD-9-CM and ICD-10 administrative data. Med Care. 2005;43(11):1130-9. doi:10.1097/01.mlr.0000182534.19832.83 [DOI] [PubMed] [Google Scholar]
- 16.Begier E, Rosenthal NA, Gurtman A, Kartashov A, Donald RG, Lockhart SP. Epidemiology of invasive Escherichia coli infection and antibiotic resistance status among patients treated in U.S. hospitals: 2009-2016. Clin Infect Dis. 2021;73(4):565-74. doi:10.1093/cid/ciab005 [DOI] [PubMed] [Google Scholar]
- 17.Ha YE, Kang CI, Joo EJ, et al. Clinical implications of healthcare-associated infection in patients with community-onset acute pyelonephritis. Scand J Infect Dis. 2011;43(8):587-95. doi:10.3109/00365548.2011.572907 [DOI] [PubMed] [Google Scholar]
- 18.Horcajada JP, Shaw E, Padilla B, et al. Healthcare-associated, community-acquired and hospital-acquired bacteraemic urinary tract infections in hospitalized patients: A prospective multicentre cohort study in the era of antimicrobial resistance. Clin Microbiol Infect. 2013;19(10):962-8. doi:10.1111/1469-0691.12089 [DOI] [PubMed] [Google Scholar]
- 19.Kang CI, Song JH, Chung DR, et al. Risk factors and treatment outcomes of community-onset bacteraemia caused by extended-spectrum beta-lactamase-producing Escherichia coli. Int J Antimicrob Agents. 2010;36(3):284-7. doi:10.1016/j.ijantimicag.2010.05.009 [DOI] [PubMed] [Google Scholar]
- 20.Friedman ND, Kaye KS, Stout JE, et al. Health care--associated bloodstream infections in adults: a reason to change the accepted definition of community-acquired infections. Ann Intern Med. 2002;137(10):791-7. doi:10.7326/0003-4819-137-10-200211190-00007 [DOI] [PubMed] [Google Scholar]
- 21.Paoli CJ, Reynolds MA, Sinha M, Gitlin M, Crouser E. Epidemiology and costs of sepsis in the United States-An analysis based on timing of diagnosis and severity level. Crit Care Med. 2018;46(12):1889-97. doi:10.1097/CCM.0000000000003342 [DOI] [PMC free article] [PubMed] [Google Scholar]
- 22.Angus DC, Linde-Zwirble WT, Lidicker J, Clermont G, Carcillo J, Pinsky MR. Epidemiology of severe sepsis in the United States: Analysis of incidence, outcome, and associated costs of care. Crit Care Med. 2001;29(7):1303-10. doi:10.1097/00003246-200107000-00002 [DOI] [PubMed] [Google Scholar]
- 23.Russo TA, Johnson JR. Medical and economic impact of extraintestinal infections due to Escherichia coli: Focus on an increasingly important endemic problem. Microbes Infect. 2003;5(5):449-56. doi:10.1016/s1286-4579(03)00049-2 [DOI] [PubMed] [Google Scholar]
- 24.Bhojani N, Paranjpe R, Cutone B, Rojanasarot S, Chew BH. Predictors and health care utilization of sepsis post-ureteroscopy in a U.S.-based population: Results from the endourological society TOWER collaborative. J Endourol. 2022;36(11):1411-7. doi:10.1089/end.2022.0010 [DOI] [PubMed] [Google Scholar]
- 25.Artero A, Esparcia A, Eiros JM, Madrazo M, Alberola J, Nogueira JM. Effect of bacteremia in elderly patients with urinary tract infection. Am J Med Sci. 2016;352(3):267-71. doi:10.1016/j.amjms.2016.05.031 [DOI] [PubMed] [Google Scholar]
- 26.Buchman TG, Simpson SQ, Sciarretta KL, et al. Sepsis among medicare beneficiaries: 3. The methods, models, and forecasts of sepsis, 2012-2018. Crit Care Med. 2020;48(3):302-18. doi:10.1097/CCM.0000000000004225 [DOI] [PMC free article] [PubMed] [Google Scholar]
- 27.Bonten M, Johnson JR, van den Biggelaar AH, et al. Epidemiology of Escherichia coli bacteremia: A systematic literature review. Clin Infect Dis. 2021;72(7):1211-9. doi:10.1093/cid/ciaa210 [DOI] [PubMed] [Google Scholar]
- 28.Yoshikawa TT. Epidemiology and unique aspects of aging and infectious diseases. Clin Infect Dis. 2000;30(6):931-3. doi:10.1086/.31.3792 [DOI] [PubMed] [Google Scholar]
- 29.Feldman SF, Temkin E, Wullfhart L, et al. A nationwide population-based study of Escherichia coli bloodstream infections: Incidence, antimicrobial resistance and mortality. Clin Microbiol Infect. 2022;28(6):879.e1-879.e7. doi:10.1016/j.cmi.2021.12.009 [DOI] [PubMed] [Google Scholar]
- 30.Ling W, Paterson DL, Harris PN, Furuya-Kanamori L, Edwards F, Laupland KB. Population-based incidence and characteristics of adult Escherichia coli bloodstream infection in Queensland, Australia, from 2000 to 2019. Open Forum Infect Dis. 2023;10(3):ofad071. doi:10.1093/ofid/ofad071 [DOI] [PMC free article] [PubMed] [Google Scholar]
- 31.Thorpe KE, Joski P, Johnston KJ. Antibiotic-resistant infection treatment costs have doubled since 2002, now exceeding $2 billion annually. Health Aff (Millwood). 2018;37(4):662-9. doi:10.1377/hlthaff.2017.1153 [DOI] [PubMed] [Google Scholar]