

Abstract
BACKGROUND:
Although there are a variety of insulin products and new delivery modalities available, the absence of direct clinical and economic comparisons can make treatment planning and formulary decision making difficult. Direct comparisons between insulin aspart and insulin lispro from a large heterogeneous population are not available.
OBJECTIVE:
To assess differences in clinical outcomes, medication adherence, utilization, and total health care costs between aspart and lispro and vial versus pen modalities for administering these short-acting insulin analogs.
METHODS:
This retrospective cohort study used administrative claims data from the Humana Research Database to identify people with type 1 or type 2 diabetes and Medicare or commercial insurance (with medical and pharmacy benefits) who newly initiated rapid-acting insulin between January 1, 2008, and December 31, 2013, and were continuously enrolled during the 12-month baseline and 12-month follow-up periods. Generalized linear models were used to assess differences in costs and utilization. Logistic regression models measured the likelihood of having a hypoglycemic event, worsening diabetes complications, or a change in glycated hemoglobin (A1c).
RESULTS:
8,189 patients included in the study were grouped by rapid-acting insulin product (aspart, n = 5,364, and lispro, n = 2,566) and modality (vial, n = 6,135, and pen, n = 2,054). There were no significant differences in the percentage of patients with a hypoglycemic event, new or worsening diabetes complications, or change in A1c, and there were no significant differences in adjusted total health care, medical and pharmacy costs, or emergency department visits between any of the product or modality comparisons. There was a significant difference in mean annual inpatient stays between lispro and aspart (adjusted mean = 2.24, 95% CI = 0.73-6.69, and adjusted mean = 2.65, 95% CI = 0.86-7.86, respectively; P < 0.001) and pen and vial cohorts (adjusted mean = 1.74, 95% CI = 0.56-4.99, and adjusted mean = 3.05, 95% CI = 1.01-9.08, respectively; P < 0.001). Adherence was similar for the lispro and aspart cohorts. Adherence was higher in the pen cohort (as measured by medication possession ratio ≥80%) compared with the vial cohort (adjusted odds ratio = 1.29, 95% CI = 1.12-1.50).
CONCLUSIONS:
This study provides a comprehensive assessment of outcomes and costs between 2 commonly used rapid-acting insulin products. Overall, there was little differentiation between products, although adherence improved significantly with pen devices. These findings may simplify decisions related to formulary options and choice of therapy.
What is already known about this subject
The lack of direct comparisons and clinical and economic outcomes between and within the vast array of insulin products and newer delivery modalities make treatment planning and formulary decision making more challenging.
Direct comparisons between aspart and lispro insulin in a diverse population are not available.
What this study adds
This comparative effectiveness analysis used administrative data from a national payer to examine the differences in clinical outcomes, utilization, total health care costs, and medication adherence between aspart and lispro and vial versus pen modalities.
Overall, there was little differentiation between rapid-acting insulin products.
Use of pen devices was associated with significantly higher adherence.
The insulin market has drastically changed over the past decade, with a variety of insulin products and new delivery systems now available. Intermediate, or long-acting, insulins provide basal coverage, while short- and rapid-acting insulins provide prandial coverage. Patient and prescriber barriers (e.g., fear of needles, hypoglycemia, inconvenience of injectable medications, and frequent dose adjustments) often limit insulin use for those patients with type 2 diabetes (T2DM) who cannot achieve adequate glycemic control with oral medications.1-4 Prefilled pen devices, which offer easier administration and improved convenience, portability, and adherence, may help overcome such barriers.5 Two recent studies in older adults with T2DM found better adherence and persistence and a greater change in mean glycated hemoglobin (A1c) with basal insulin pens versus vials.6,7 A variety of studies comparing pens with vials have reported similar improvements in clinical outcomes with no change or decreases in overall health care costs.8-12 Retrospective analyses of 2 large claims databases by Asche et al. (2013) found that rapid-acting insulin (RAI) pen initiation was associated with fewer hypoglycemic events and lower diabetes-related health care costs.13 However, most research in this area has primarily involved patients with T2DM or compared a single product with itself or regular human insulin.
To date, direct comparisons of different RAI analogues have concentrated on the use of continuous subcutaneous infusions in small populations, primarily with type 1 diabetes (T1DM). Two randomized controlled trials compared small groups of patients receiving continuous subcutaneous infusions for T1DM.14,15 Despite differences in the study populations (children aged 4-18 years vs. adults aged 18-71 years), both studies found similar rates of A1c reduction and hypoglycemia. Similarly, 2 review articles found that the 3 marketed RAI analogues (aspart, lispro, and glulisine) were equally safe and effective.16,17 Direct comparisons of clinical and economic outcomes in a large heterogeneous population between aspart (Novolog) and lispro (Humalog) insulin are not available.
The goal of this comparative effectiveness analysis was to assess differences in clinical outcomes, medication adherence, utilization, and total health care costs between aspart and lispro and vial versus pen modalities.
Methods
Study Design and Data Source
This retrospective cohort study used administrative claims data collected between January 1, 2007, and December 31, 2014, from the Humana Research Database, which includes data for approximately 16 million patients across the United States with commercial and Medicare health coverage. The limited dataset contains integrated medical, pharmacy, and laboratory claims and eligibility files and is in compliance with Health Insurance Portability and Accountability Act regulations. The study protocol was reviewed and approved by Shulman Associates Institutional Review Board before study initiation. A waiver of informed consent and a waiver of authorization to use protected health information were granted.
Patients with Humana Medicare Advantage Prescription Drug plan or commercial insurance with medical and pharmacy benefits who newly initiated RAI between January 1, 2008, and December 31, 2013, were identified. The first RAI prescription claim date during the identification period was designated as the index date. Patients were identified by their initial RAI prescriptions and subsequently grouped by brand (lispro or aspart) and modality (pen or vial). Continuous enrollment was required during the 12-month pre-index (baseline) and 12-month post-index (follow-up) periods.
Inclusion and Exclusion Criteria
The included population consisted of patients aged 21-89 years with at least 1 RAI prescription and a pre-index diagnosis of T1DM or T2DM. T1DM was defined using International Classification of Diseases, Ninth Revision, Clinical Modification (ICD-9-CM) codes 250.x1 or 250.x3 for the primary (≥ 1 claim) or secondary diagnosis (≥ 2 claims on different dates). T2DM was defined as ≥ 2 prescriptions for oral antidiabetes medications or glucagon-like peptide 1 agonists or ICD-9-CM codes 250.x0 or 250.x2 as the primary (≥ 1 claim) or secondary diagnosis (≥ 2 claims on different dates). Patients with gestational diabetes (ICD-9-CM code 648.8), pregnancy (ICD-9-CM codes 630.xx-679.xx or v22.x-v24.x), or a prescription for basal insulin at any time during the study period, or those with any insulin prescription claims during the pre-index period, were excluded. Insulin glulisine was excluded from analysis because of insufficient use within the population.
Outcome Measures
The total number of hypoglycemic events, identified by ICD-9-CM codes 251.0, 251.1, 251.2, or 250.8, was counted during the 12-month post-index period for each patient. Additionally, the presence or absence (binary measure) of a hypoglycemic event during the 12-month post-index period was measured.
An increase in diabetes complications during the 12-month post-index period was evaluated using the Diabetes Complications Severity Index (DCSI) score. The DCSI was developed to predict adverse outcomes, including hospitalization and mortality, based on the number and severity of complications associated with diabetes and is based on a summary score derived from diagnostic and laboratory data.18 Because of the lack of complete laboratory data (i.e., serum creatinine and urine protein) for all study subjects, we used a truncated version of the DCSI, which did not include the nephropathy category score, as validated through previous work by Chang et al. (2012).19
The occurrence of new or worsening diabetic complications in the post-index period was determined for each study patient using the DCSI, as used in previously published methodology.20 The DCSI for the 12-month pre-index period and the full 24-month observation period were determined. Inclusion of complications occurring during the pre-index period allowed for detection of new or worsening diabetes complications that occurred during the post-index period. Individuals with a 24-month DCSI score greater than their pre-index only score were designated as having “new or worsening complications.” Those individuals with no difference in their 12-month and 24-month scores were designated as “no new or worsening complications.”
A subgroup of patients from each cohort with ≥ 1 pre- and post-index A1c were analyzed. The pre-index value closest to the index date and the post-index value closest to, but at least 90 days after, the index date were used to describe the average pre- to post-index change in A1c for each study cohort.
Adherence to RAI was measured by an unadjusted medication possession ratio (uMPR) and adjusted MPR (aMPR). The uMPR was calculated for each patient using the standard MPR calculation: the total days supply of all RAI prescriptions divided by the total number of days in the follow-up period (365 days), capped at 1.0 (or 100%). Measuring days supply for RAI is challenging because doses are often customized and subject to dose titration and self-monitoring. Additionally, package sizes and total number of insulin units in pen devices may differ from vials. Despite these variations, RAIs are often dispensed with a 30-day supply documented by the pharmacy regardless of physician instructions, which could lead to overreporting or underreporting of adherence. To account for these differences, an aMPR was calculated using a 5-step process similar to the one described by Buysman et al. (2011) for basal insulin (Table 1).21,22
TABLE 1.
Stepwise Medication Possession Ratio Adjustment21
| Step | Description |
|---|---|
| 1. | Patients from the study sample with ≥2 prescription claims for rapid-acting insulin were identified. Patients in this sample were required to be insulin-naive and meet all other study inclusion criteria. |
| 2. | An adjustment factor was calculated for each rapid-acting insulin delivery method, resulting in 2 total adjustment factors (rapid-pen and rapid-vial). The adjustment factor for each was calculated as the ratio of the median time between insulin claims divided by the median pharmacy reported days supply. |
| 3. | An adjusted days supply was calculated for the final study sample by multiplying the actual days supply reported on each pharmacy claim by the adjustment factor for the index rapid-acting insulin delivery method. |
| 4. | “Adjusted” adherence (aMPR) was then calculated for the full study population using the adjusted days supply. |
| 5. | Days supply reported on each pharmacy claim and the time between pharmacy claims was determined for all patients in the study sample from step 1 above. |
aMPR = adjusted medication possession ratio.
While this adjustment method has not been validated in RAIs, it was similarly applied because diabetes treatment regimens based on RAIs would be subject to the same previously mentioned challenges. uMPR and aMPR were reported as continuous and categorical measures. The categorical measurement of adherence used an aMPR threshold of ≥80% (i.e., adherent behavior) as the adherence cutoff.
Health care resource utilization during the post-index period was captured for outpatient (OP; i.e., physician office or outpatient facility), inpatient (IP) and emergency department (ED) visits. Post-index total costs were defined as the sum of all allowed (patient- and plan-paid) medical and pharmacy costs incurred during the 12-month post-index period. Costs were adjusted to January 2015 U.S. dollars using the annual medical care component of the Consumer Price Index.23
Covariates
Covariates analyzed in this study included age, gender, race, geographic location, health insurance plan type, population density (e.g., rural, urban), dual eligibility status for Medicare and Medicaid, index year, prescribing physician specialty (e.g., primary care, endocrinologist) and diabetes type. Level of illness was accounted for using the Deyo-Charlson Cormorbidity Index and DCSI. Number of medical and antidiabetes medication claims, number of physician office visits, and number of A1c tests were also reported and controlled for in the analysis.
Statistical Analysis
Baseline characteristics were described for 4 cohorts based on index exposure using standard summary statistics. The primary comparisons of interest were between the lispro and aspart cohorts and pen and vial cohorts. The lispro and aspart cohorts contained a mixture of delivery modalities; the pen and vial cohorts contained a mixture of RAIs.
Continuous measures were described by median (interquartile range [IQR]). Wilcoxon rank sum tests (for non-normal distribution) were conducted to compare unadjusted continuous measures between cohorts. Categorical measures were described by counts and frequencies (%), and chi-square tests were used for unadjusted categorical comparisons.
Logistic regression was used to compare cohorts by the likelihood of having a hypoglycemic event, new or worsening diabetes complications, a decrease in A1c, or adherent behavior in the post-index period. Generalized linear models (GLM) with gamma distribution and log link functions were used to assess differences in total medical and pharmacy costs. GLMs with negative binomial distribution and log link functions were used to assess differences in OP, IP, and ED use. Costs were capped at the 99th percentile to reduce the effect of extreme outliers.
All analyses controlled for the previously mentioned covariates. Cost and utilization models also adjusted for the aMPR of the index agent. An a-priori alpha level of .05 was used for all statistical analyses.
Results
A total of 58,253 commercial and Medicare patients using RAI therapies were initially identified. The final study population included 8,189 (15.9%) patients after applying study exclusion criteria (Figure 1). Nearly twice as many patients were prescribed aspart (n = 5,364) as lispro (n = 2,825). Vial and pen cohorts numbered 6,135 and 2,054 patients, respectively. Baseline characteristics for the aspart/lispro and pen/vial cohorts are shown in Table 2.
FIGURE 1.
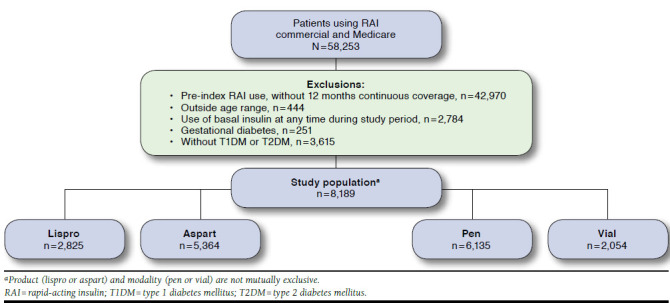
Sample Attrition
TABLE 2.
Baseline Characteristics, 1 Year Pre-index Date, by Product and Modality
| Characteristic | Lispro | Aspart | P Value | Pen | Vial | P Value |
|---|---|---|---|---|---|---|
| Demographic characteristics | ||||||
| Sample size | n = 2,825 | n = 5,364 | – | n = 2,054 | n = 6,135 | – |
| Age, years, median (IQR)a | 69 (61-76) | 70 (63-77) | < 0.001 | 70 (63-76) | 70 (62-77) | 0.253 |
| Age group, n (%)b | ||||||
| < 64 years | 906 (32.1) | 1,490 (27.8) | < 0.001 | 583 (28.4) | 1,813 (29.6) | 0.314 |
| ≥ 65 years | 1,919 (67.9) | 3,874 (72.2) | – | 1,471 (71.6) | 4,322 (70.4) | |
| Male gender, n (%)b | 1,363 (48.3) | 2,527 (47.1) | 0.320 | 1,044 (50.9) | 2,846 (46.4) | |
| Geographic region, n (%)b | ||||||
| Northeast | 68 (2.4) | 105 (2.0) | 0.042 | 40 (1.9) | 133 (2.2) | 0.094 |
| Midwest | 686 (24.3) | 1,338 (24.9) | 469 (22.8) | 1,555 (25.3) | ||
| South | 1,875 (66.4) | 3,622 (67.5) | 1,424 (69.3) | 4,073 (66.4) | ||
| West | 196 (6.9) | 299 (5.6) | 121 (5.9) | 374 (6.1) | ||
| Population density, n (%)b | ||||||
| Urban | 1,720 (61.3) | 3,449 (64.8) | 0.006 | 1,253 (61.4) | 3,916 (64.4) | 0.042 |
| Suburban | 752 (26.8) | 1,275 (24.0) | 531 (26.0) | 1,496 (24.6) | ||
| Rural | 332 (11.8) | 597 (11.2) | 256 (12.5) | 673 (11.1) | ||
| Race, n (%)b | ||||||
| White | 1,896 (67.1) | 3,618 (67.4) | < 0.001 | 1,527 (74.3) | 3,987 (65.0) | < 0.001 |
| Black | 361 (12.8) | 765 (14.3) | 284 (13.8) | 842 (13.7) | ||
| Hispanic | 27 (1.0) | 101 (1.9) | 31 (1.5) | 97 (1.6) | ||
| Other | 44 (1.6) | 100 (1.9) | 40 (1.9) | 104 (1.7) | ||
| LIS status, n (%)b | ||||||
| LIS status only | 129 (5.0) | 262 (5.3) | 0.768 | 169 (8.9) | 222 (3.9) | < 0.001 |
| Dual eligibility only | 28 (1.1) | 46 (0.9) | 17 (0.9) | 57 (1.0) | ||
| LIS status and dual eligibility | 300 (11.7) | 607 (12.2) | 336 (17.6) | 571 (10.1) | ||
| No LIS or dual eligibility | 2,109 (82.2) | 4,053 (81.6) | 1,384 (72.6) | 4,778 (84.9) | ||
| Clinical characteristics | ||||||
| Diabetes type, n (%)b | ||||||
| Type 1 | 312 (5.8) | 183 (6.5) | 0.232 | 75 (3.7) | 420 (6.8) | < 0.001 |
| Type 2 | 5,052 (94.2) | 2,642 (93.5) | 1,979 (96.3) | 5,715 (93.2) | ||
| Risk, median (IQR) | ||||||
| DCCIa | 3 (1-5) | 3 (2-5) | < 0.001 | 3 (2-5) | 3 (2-5) | 0.028 |
| DCSIa | 4 (2-6) | 3 (2-5) | < 0.001 | 3 (2-5) | 4 (2-6) | < 0.001 |
| Number of A1c tests, median (IQR)a | 11 (7-17) | 11 (7-17) | 0.918 | 11 (7-16) | 12 (7-17) | 0.032 |
| Physician office visits, median (IQR)a | 14 (8-23) | 14 (8-22) | 0.659 | 15 (8-24) | 13 (7-22) | < 0.001 |
| Physician type, n (%)b | ||||||
| Primary care | 3,034 (56.6) | 1,660 (58.8) | < 0.001 | 1,206 (58.7) | 3,488 (56.9) | 0.001 |
| Endocrinologist | 412 (7.7) | 273 (9.7) | 205 (10.0) | 480 (7.8) | ||
| Emergency medicine | 381 (7.1) | 177 (6.3) | 133 (6.5) | 425 (6.9) | ||
| Other | 778 (14.5) | 344 (12.2) | 253 (12.3) | 869 (14.2) | ||
| Unknown | 759 (14.1) | 371 (13.1) | 257 (12.5) | 873 (14.2) | ||
aWilcoxon rank sum tests were used to determine if the comparison groups were significantly different. Statistical significance was estimated at an a priori alpha level of 0.05.
bChi-squared analysis was used to determine if the comparison groups were significantly different. Statistical significance was estimated at an a priori alpha level of 0.05.
A1c = glycated hemoglobin; DCCI = Deyo-Charlson Comorbidity Index; DCSI = Diabetes Complications Severity Index; IQR = interquartile range; LIS = low-income subsidy.
Clinical Outcomes and Medication Adherence
Overall, the percentage of patients with at least 1 hypoglycemic event in the 12-month post-index period was 18.8%, and 51.8% of the study population had new or worsening diabetes complications. After adjustment for baseline characteristics, there were no statistically significant differences in the odds of having a hypoglycemic event, new or worsening diabetes complications, or decrease in A1c between any of the product or modality comparisons (Table 3). Adherent behavior was similar for the total lispro and aspart cohorts but significantly higher for the pen cohort when compared with the vial cohort (adjusted odds ratio = 1.29, 95% confidence interval = 1.12-1.50; Table 3).
TABLE 3.
Clinical and Adherence Measures by Product and Modality
| Measure | Lispro | Aspart | P Value | Pen | Vial | P Value |
|---|---|---|---|---|---|---|
| Clinical measures | ||||||
| Hypoglycemic event, na | 2,727 | 5,179 | 1,954 | 5,938 | ||
| Proportion, n (%)b | 531 (19.5) | 954 (18.4) | 0.261 | 336 (17.1) | 1,149 (19.3) | 0.033 |
| Adjusted odds of having hypoglycemic event (95% CI)c | 1.10 (0.97-1.23) | Reference | 0.130 | 0.89 (0.77-1.02) | Reference | 0.104 |
| New or worsening diabetes complications, n | 2,727 | 5,179 | 1,968 | 5,938 | ||
| Proportion, n (%)b | 1,432 (52.6) | 2,661 (51.5) | 0.354 | 1,004 (51.4) | 3,089 (52.1) | 0.591 |
| Adjusted odds of having new or worsening diabetes complications, (95% CI)c | 1.03 (0.93-1.14) | Reference | 0.531 | 0.95 (0.83-1.08) | Reference | 0.476 |
| Change in A1c, nd | 792 | 1,594 | 680 | 1,706 | ||
| Unadjusted change in A1c, median (IQR)e | -0.10 (-0.80-0.50) | -0.20 (-0.90-0.50) | 0.154 | -0.20 (-1.00-0.50) | -0.10 (-0.80-0.50) | 0.284 |
| Proportion with decrease, n (%)b | 419 (52.9) | 886 (55.6) | 0.216 | 382 (56.2) | 923 (54.1) | 0.359 |
| Adjusted odds of having a decrease in A1c, (95% CI)c | 0.87 (0.73-1.04) | Reference | 0.142 | 1.05 (0.87-1.26) | Reference | 0.603 |
| Adherence measures | ||||||
| Adherence, na | 2,727 | 5,179 | 1,968 | 5,938 | ||
| uMPR, median (IQR) | 0.16 (0.08-0.41) | 0.16 (0.08-0.38) | 0.228 | 0.23 (0.08-0.49) | 0.16 (0.08-0.36) | < 0.001 |
| aMPR, median (IQR) | 0.22 (0.11-0.54) | 0.22 (0.11-0.51) | 0.258 | 0.31 (0.11-0.66) | 0.22 (0.11-0.47) | < 0.001 |
| Adjusted odds of adherent behavior at ≥80% MPR (95% CI)c | 0.92 (0.80-1.05) | Reference | 0.231 | 1.29 (1.12-1.50) | Reference | < 0.001 |
aTo reduce the effect of extreme outliers, costs were capped at the 99th percentile, resulting in smaller sample sizes compared with Table 1.
bChi-squared analysis was used to determine if the comparison groups were significantly different. Statistical significance was estimated at an a priori alpha level of 0.05.
cAdjusted odds were evaluated by logistic regression controlling for age, gender, region, plan type, population density, index year, risk, pre-index physician office visits, pre-index count of A1c tests, pre-index antidiabetes therapies, and pre-index comorbidities.
dChanges in A1c levels were evaluated among members with at least 1 pre-index A1c level and at least 1 post-index A1c level at least 90 days post-index.
eWilcoxon rank sum tests were used to determine if the comparison groups were significantly different. Statistical significance was estimated at an a priori alpha level of 0.05.
A1c = glycated hemoglobin; aMPR = adjusted medication possession ratio; CI = confidence interval; IQR = interquartile range; uMPR = unadjusted medication possession ratio.
Health Care Utilization and Costs
There was a significant difference in IP stays between lispro and aspart cohorts (adjusted mean = 2.24 vs. 2.65, respectively; P < 0.001) and pen and vial cohorts (adjusted mean = 1.74 vs. 3.05, respectively; P < 0.001). A difference in OP visits was found between lispro and aspart cohorts (adjusted mean = 38.50 vs. 37.23, respectively; P = 0.048). There were no significant differences in adjusted total health care, medical and pharmacy costs, or ED visits between any of the cohort comparisons (Table 4).
TABLE 4.
Health Care Utilization and Cost by Product and Modality
| Measure | Lispro | Aspart | P Value | Pen | Vial | P Value |
|---|---|---|---|---|---|---|
| Utilization measures | ||||||
| Health care utilization, na | 2,727 | 5,159 | 1,968 | 5,938 | ||
| Outpatient visits, median (IQR) | 28 (16-46) | 27 (15-45) | 0.139 | 27 (16-45) | 27 (15-45) | 0.112 |
| Outpatient visits, adjusted mean (95% CI)b | 38.50 (24.24-61.17) | 37.23 (23.43-59.17) | 0.048 | 38.29 (24.09-60.86) | 37.71 (23.73-59.93) | 0.486 |
| Inpatient stays, median (IQR) | 1 (0-2) | 1 (0-4) | < 0.001 | 1 (0-3) | 1 (0-4) | < 0.001 |
| Inpatient stays, adjusted mean (95% CI)b | 2.21 (0.73-6.69) | 2.60 (0.86-7.86) | < 0.001 | 1.66 (0.56-4.99) | 3.03 (1.01-9.08) | < 0.001 |
| Emergency department visits, median (IQR) | 1 (0-2) | 1 (0-2) | 0.439 | 1 (0-2) | 1 (0-2) | 0.018 |
| Emergency department visits, adjusted mean (95% CI)b | 1.39 (0.55-3.46) | 1.33 (0.53-3.34) | 0.284 | 1.36 (0.54-3.39) | 1.38 (0.55-3.44) | 0.758 |
| Cost measures | ||||||
| Health care cost, na | 2,727 | 5,159 | 1,968 | 5,938 | ||
| Total, median (IQR) | 15,340 (7,923-33,585) | 15,971 (7,963-34,747) | 0.342 | 14,754 (7,607-31,336) | 16,120 (8,035-35,215) | 0.005 |
| Total, adjusted mean (95% CI)c | 26,089 (14,865-45,787) | 25,939 (14,776-45,536) | 0.778 | 25,300 (14,410-44,419) | 26,626 (15,169-46,736) | 0.051 |
| Medical, median (IQR) | 8,965 (3,094-26,501) | 9,490 (3,047-28,303) | 0.350 | 8,052 (2,724-24,047) | 9,744 (3,250-28,983) | < 0.001 |
| Medical, adjusted mean (95% CI)c | 19,809 (9,413-41,689) | 19,762 (9,387-41,604) | 0.930 | 19,093 (9,068-40,203) | 20,365 (9,675-42,867) | 0.065 |
| Pharmacy, median (IQR) | 4,627 (2,854-7,515) | 4,600 (2,799-7,456) | 0.430 | 4,613 (2,803-7,839) | 4,608 (2,826-7,368) | 0.244 |
| Pharmacy, adjusted mean (95% CI)c | 4,676 (3,019-7,244) | 4,633 (2,990-7,179) | 0.561 | 4,733 (3,054-7,335) | 4,601 (2,970-7,129) | 0.165 |
aTo reduce the effect of extreme outliers, costs were capped at the 99th percentile, resulting in smaller sample sizes compared with Table 1.
bUtilization was analyzed using a GLM with a negative binomial distribution controlling for adherence (aMPR), age, gender, region, plan type, population density, index year, risk, pre-index physician office visits, pre-index count of A1c tests, pre-index antidiabetes therapies, and pre-index comorbidities.
cCosts were evaluated using GLM with a log-linked, gamma distribution controlling for adherence (aMPR), age, gender, region, plan type, population density, index year, risk, pre-index physician office visits, pre-index count of A1c tests, pre-index antidiabetes therapies, and pre-index comorbidities.
A1c = glycated hemoglobin; aMPR = adjusted medication possession ratio; CI = confidence interval; GLM = generalized linear model; IQR = interquartile range.
Discussion
This study sought to directly compare clinical outcomes, medication adherence, health care utilization and cost for aspart and lispro insulin products and vial versus pen modalities. While several studies have compared RAI analogues with other insulins and various pen devices to vials, this is the first published direct comparison of aspart with lispro products in a broad adult population with either T1DM or T2DM. We found no differences in clinical or economic outcomes for either product or modality comparisons. Our results are particularly notable given the large sample sizes, which are typically prone to Type I error.
Of all the utilization comparisons, only IP visits were statistically significantly different for insulin type and modality comparisons. However, given the large sample sizes and the numerically similar results, differences in utilization may not be clinically relevant. Our results support previous studies that reported equal safety and effectiveness for all 3 RAI analogues (aspart, lispro, and glulisine).16,17,24 Similarly, comparisons of the RAI analogues to human insulin, alone or in combination with basal insulin, found no differences in clinical measures.14,15,24,25
While comparisons between aspart and lispro products showed no differences in adherence, adherence was better for pens compared with vials. Two studies that compared pen devices with vials in older patients with T2DM reported similar findings.6,7 A review by Pisano (2014) highlighted increased patient confidence and satisfaction with pen devices, which may contribute to the improved adherence.5
The similarity between aspart and lispro products noted in this study can assist patients, providers, and health care systems in choosing appropriate insulin therapy. With no difference in clinical or economic measures, patients and providers can discuss therapy options based on patient preference, comfort, and ease of use. The improved adherence with pen devices may lead to improved patient outcomes.
Patients and providers should fully understand the effect of their choice for insulin therapy—direct product comparisons are invaluable for payers who must choose products and tier placement for their formularies. The data provided here will help inform those therapy and formulary decisions.
Limitations
Interpretation of our results must account for certain study limitations. First, limitations common to studies using administrative claims data pertain to this study. These limitations include lack of certain information in the database relevant to a study of diabetes (e.g., lifestyle modifications and blood glucose levels) and error in claims coding. Second, diabetes diagnoses obtained from the claims data were not confirmed via the medical record resulting in the possibility of misclassification. Third, the retrospective, observational design of the study precludes the ability to make causal inferences. Fourth, while methods used to measure adherence have been validated in basal insulins, they have not been validated for RAIs. Fifth, the study population was drawn entirely from 1 insurance plan, largely composed of Medicare patients aged 65 years and older, so study results may not be generalized to the overall U.S. population. However, Humana is a large national health plan that represents members from a broad array of geographic regions. Finally, we only included patients who newly initiated an RAI, so these results may not translate to patients established on these therapies.
Conclusions
This study provides a comprehensive assessment of outcomes and costs between 2 commonly used RAI products. Overall, there was little to no differentiation between RAI products, although adherence improved significantly with pen devices. The similarity between products may simplify decisions related to formulary offerings and therapy choices.
ACKNOWLEDGMENTS
The authors acknowledge Jessica Dobbins, DrPH, MA, and Charron Long, PharmD, for their significant contributions to the writing and development of this manuscript.
REFERENCES
- 1.Garber AJ, Abrahamson MJ, Barzilay JI, et al.. Consensus statement by the American Association of Clinical Endocrinologists and American College of Endocrinology on the comprehensive type 2 diabetes management algorithm–2016 executive summary. Endocr Pract. 2016;22(1):84-113. [DOI] [PubMed] [Google Scholar]
- 2.Inzucchi SE, Bergenstal RM, Buse JB, et al.. Management of hypergly-cemia in type 2 diabetes, 2015: a patient-centered approach: update to a position statement of the American Diabetes Association and the European Association for the Study of Diabetes. Diabetes Care. 2015;38(1):140-49. [DOI] [PubMed] [Google Scholar]
- 3.Meece J. Dispelling myths and removing barriers about insulin in type 2 diabetes. Diabetes Educ. 2006;32(1 Suppl):S9-S18. [DOI] [PubMed] [Google Scholar]
- 4.Petrak F, Stridde E, Leverkus F, Crispin AA, Forst T, Pfützner A.. Development and validation of a new measure to evaluate psychological resistance to insulin treatment. Diabetes Care. 2007;30(9):2199-204. [DOI] [PubMed] [Google Scholar]
- 5.Pisano M. Overview of insulin and non-insulin delivery devices in the treatment of diabetes. PT. 2014;39(12):866-76. [PMC free article] [PubMed] [Google Scholar]
- 6.Slabaugh SL, Bouchard JR, Li Y, Baltz JC, Meah YA, Moretz DC.. Characteristics relating to adherence and persistence to basal insulin regimens among elderly insulin-naïve patients with type 2 diabetes: pre-filled pens versus vials/syringes. Adv Ther. 2015;32(12):1206-21. [DOI] [PMC free article] [PubMed] [Google Scholar]
- 7.Reynolds SL, Zhou S, Uribe C, Li Y.. Impact of insulin delivery systems in elderly patients with type 2 diabetes. Am J Pharm Benefits. 2015;7(5):222-31. [Google Scholar]
- 8.Lasalvia P, Barahona-Correa JE, Romero-Alvernia DM, et al.. Pen devices for insulin self-administration compared with needle and vial: systematic review of the literature and meta-analysis. J Diabetes Sci Technol. 2016;10(4):959-66. [DOI] [PMC free article] [PubMed] [Google Scholar]
- 9.Ignaut DA, Schwartz SL, Sarwat S, Murphy HL.. Comparative device assessments: Humalog KwikPen compared with vial and syringe and FlexPen. Diabetes Educ. 2009;35(5):789-98. [DOI] [PubMed] [Google Scholar]
- 10.Davis EM, Christensen CM, Nystrom KK, Foral PA, Destache C.. Patient satisfaction and costs associated with insulin administered by pen device or syringe during hospitalization. Am J Health Syst Pharm. 2008;65(14):1347-57. [DOI] [PubMed] [Google Scholar]
- 11.Cobden D, Lee WC, Balu S, Joshi AV, Pashos CL.. Health outcomes and economic impact of therapy conversion to a biphasic insulin analog pen among privately insured patients with type 2 diabetes mellitus. Pharmacotherapy. 2007;27(7):948-62. [DOI] [PubMed] [Google Scholar]
- 12.Pawaskar MD, Camacho FT, Anderson RT, Cobden D, Joshi AV, Balkrishnan R.. Health care costs and medication adherence associated with initiation of insulin pen therapy in Medicaid-enrolled patients with type 2 diabetes: a retrospective database analysis. Clin Ther. 2007;29(Spec No):1294-305. [PubMed] [Google Scholar]
- 13.Asche CV, Luo W, Aagren M.. Differences in rates of hypoglycemia and health care costs in patients treated with insulin aspart in pens versus vials. Curr Med Res Opin. 2013;29(10):1287-96. [DOI] [PubMed] [Google Scholar]
- 14.Bode B, Weinstein R, Bell D, et al.. Comparison of insulin aspart with buffered regular insulin and insulin lispro in continuous subcutaneous insulin infusion: a randomized study in type 1 diabetes. Diabetes Care. 2002;25(3):439-44. [DOI] [PubMed] [Google Scholar]
- 15.Weinzimer SA, Ternand C, Howard C, Chang CT, Becker DJ, Laffel LM.. Insulin aspart pediatric pump study group: a randomized trial comparing continuous subcutaneous insulin infusion of insulin aspart versus insulin lispro in children and adolescents with type 1 diabetes. Diabetes Care. 2008;31(2):210-15. [DOI] [PubMed] [Google Scholar]
- 16.Home PD. The pharmacokinetics and pharmacodynamics of rapid-acting insulin analogues and their clinical consequences. Diabetes Obes Metab. 2012;14(9):780-88. [DOI] [PubMed] [Google Scholar]
- 17.Tibaldi J. Evolution of insulin: from human to analog. Am J Med. 2014;127(10 Suppl):S25-S38. [DOI] [PubMed] [Google Scholar]
- 18.Young BA, Lin E, Korff M, et al.. Diabetes complications severity index and risk of mortality, hospitalization, and healthcare utilization. Am J Manag Care. 2008;14(1):15-23. [PMC free article] [PubMed] [Google Scholar]
- 19.Chang HY, Weiner JP, Richards TM, Bleich SN, Segal JB.. Predicting costs with diabetes complications severity index in claims data. Am J Manag Care. 2012;18(4):213-19. [PubMed] [Google Scholar]
- 20.Saundankar V, Ellis J, Allen E, et al.. Type 2 diabetes mellitus patients’ healthcare costs related to inpatient hospitalizations: a retrospective administrative claims database study. A dv The r. 2015;32(7):662-79. [DOI] [PubMed] [Google Scholar]
- 21.Buysman E, Conner C, Aagren M, Bouchard J, Liu F.. Adherence and persistence to a regimen of basal insulin in a pre-filled pen compared to vial/syringe in insulin-naïve patients with type 2 diabetes. Curr Med Res Opin. 2011;27(9):1709-17. [DOI] [PubMed] [Google Scholar]
- 22.Miao R, Wei W, Baser O, Xie L.. Real world outcomes of adding rapid-acting insulin versus switching to analog premix insulin among U.S. patients with type 2 diabetes treated with insulin glargine. Patient Prefer Adherence. 2013;7:951-60. [DOI] [PMC free article] [PubMed] [Google Scholar]
- 23.U.S. Bureau of Labor Statistics.. Consumer Price Index-all urban consumers. U.S. medical care. Available at: https://data.bls.gov/cgi-bin/surveymost?cu. Accessed February 10, 2017.
- 24.Plank J, Wutte A, Brunner G, et al.. A direct comparison of insulin aspart and insulin lispro in patients with type 1 diabetes. Diabetes Care. 2002;25(11):2053-57. [DOI] [PubMed] [Google Scholar]
- 25.Tran L, Zielinski A, Roach AH, et al.. Pharmacologic treatment of type 2 diabetes: injectable medications. Ann Pharmacother. 2015;49(6):700-14. [DOI] [PubMed] [Google Scholar]