

Abstract
BACKGROUND:
Diabetes mellitus is a major health problem that is growing rapidly worldwide. A collaborative and integrated team approach in which pharmacists can play a pivotal role should be sought when managing patients with diabetes.
OBJECTIVE:
To identify and summarize the main outcomes of pharmacist interventions in the management of type 2 diabetes.
METHODS:
PubMed, Cochrane Central Register of Controlled Trials, and Web of Science were searched for randomized controlled trials evaluating the effectiveness of any pharmacist intervention directed at patients with type 2 diabetes in comparison with usual care. Outcome measures of interest included glycosylated hemoglobin (Alc), blood glucose, blood pressure, lipid profile, body mass index (BMI), 10-year coronary heart disease (CHD) risk, medication adherence, health-related quality of life (HRQoL), and economic outcomes. The risk of bias in included studies was assessed using the Cochrane risk of bias tool.
RESULTS:
Thirty-six studies were included in this systematic review, involving 5,761 participants. The studies evaluated the effects of several pharmacist interventions carried out in various countries and in different health care facilities, such as community pharmacies, primary care clinics, and hospitals. The number of studies reporting each outcome of interest varied. Alc was evaluated in 26 studies, of which 24 reported a greater reduction in this outcome in the intervention group compared with the control group, with the difference in change between groups ranging from -0.18% to -2.1%. Eighteen studies assessed change in systolic blood pressure, of which 17 studies reported a greater improvement in this outcome in the intervention group, with the difference in change between groups varying between -3.3 mmHg and -23.05 mmHg. For diastolic blood pressure, a greater effect was also observed in the intervention group in 14 out of 15 studies, with the difference in change between groups varying between -0.21 mmHg and -9.1 mmHg. Thirteen studies described total cholesterol as an outcome measure, of which 10 reported a greater improvement in this outcome in the intervention group, with the difference in change between groups ranging from +18.95 mg dL-1 to -32.48 mg dL-1. With regard to low-density lipoprotein cholesterol, a greater reduction in this parameter in the intervention group was documented in 12 out of 15 studies, with the difference in change between groups varying between +7.35 mg dL-1 and -30 mg dL-1. Similarly, favorable data were reported on high-density lipoprotein cholesterol in the intervention group in 9 out of 12 studies that assessed this outcome, with the difference in change between groups ranging from -5.8 mg dL-1 to +11 mg dL-1. Data on triglycerides were also reported in 12 studies, of which 9 reported a greater reduction in triglycerides levels in the intervention group, with the difference in change between groups varying between +12 mg dL-1 and -62 mg dL-1. Overall, a beneficial effect on BMI was also described in the intervention group in 12 out of 14 studies. Of note, in all 6 studies that estimated the 10-year CHD risk among study patients, a greater improvement in the intervention group versus the control group was found. In addition, pharmacist interventions also had a positive impact on medication adherence and HRQoL in most studies that ascertained these outcomes. Finally, although only 3 studies conducted a cost-effectiveness analysis, pharmacist interventions proved to be cost-effective.
CONCLUSIONS:
The findings from this review clearly support the involvement of pharmacists as members of health care teams in the management of patients with type 2 diabetes.
What is already known about this subject
Type 2 diabetes is a serious and highly prevalent metabolic disorder that imposes unacceptable high costs on many countries around the world.
Regardless of the arsenal of therapeutic options currently available to tackle this disease, metabolic control still remains suboptimal among patients with type 2 diabetes.
The management of diabetes requires close collaboration between the patient and a multidisciplinary health care team, in which pharmacists may also take part by providing pharmaceutical care programs.
What this study adds
Overall, the randomized controlled trials included in this review emonstrated that pharmacist interventions resulted in greater improvements in many outcomes when compared with usual care, such as in glycosylated hemoglobin, blood glucose, blood pressure, lipid profile, medication adherence, and health-related quality of life.
This review highlights the need for more economic analysis studies in order to evaluate the cost-effectiveness of pharmacist interventions and for further research into the intervention elements that contribute the most to the observed effects.
This review encourages the construction of standard, well-validated tools to ascertain certain outcomes, so that data from different studies concerning these outcomes can be analyzed together.
Type 2 diabetes mellitus is a chronic disease that, if left uncontrolled, may cause microvascular and macrovascular complications in the long term, which are the main causes of increased morbidity and mortality and decreased health-related quality of life among patients.1-5 Unfortunately, diabetes—particularly type 2 diabetes—is reaching epidemic proportions as its prevalence increases at an alarming rate in developed and developing countries.6 Indeed, it was estimated that 415 million people globally suffered from diabetes in 2015, and this number is predicted to increase to 642 million people by 2040.6
Also of concern is that diabetes and associated complications impose an increasing and huge economic burden on national health care systems worldwide. The global health expenditure on diabetes was estimated to be at least $673 billion U.S. dollars (USD) in 2015, representing 11.6% of the world’s total health expenditure, and this amount is expected to exceed $802 billion USD in 2040.6 For these reasons, diabetes is one of the most worrying health problems of the twenty-first century and requires immediate attention.
Despite the existence of effective therapies and the demonstrated benefits derived from tight control of blood glucose and other cardiovascular risk factors, such as blood pressure and serum lipids,7-9 evidence indicates that the achievement of recommended targets for these factors remains suboptimal among patients with type 2 diabetes.10-12 Lack of adherence to treatment and other recommendations might explain these findings, given that more than 50% of chronically treated patients do not follow the recommended lifestyle changes or do not take the prescribed pharmacotherapy.13 The factors that contribute to low levels of adherence include complex treatment regimens, medication side effects, poor patient-provider communication, patient financial resources and beliefs, psychiatric disorders, and memory impairment.14,15
In order to address the current challenges of achieving therapeutic goals among the diabetes population, new models of health care delivery should be developed and implemented. Because of their expertise in pharmacotherapy and their accessibility in the community, pharmacists are able to build strong relationships with patients and become a reliable source of information. Thus, pharmacists are in an ideal position to provide patient education and monitor and promote adherence to self-care and therapeutic regimens, which have a positive impact on achieving therapeutic outcomes in diabetes.16,17 In addition, because of their extended scientific and technical knowledge, pharmacists are especially alerted to certain aspects, such as the occurrence of adverse drug reactions and interactions, and specific features associated with aging and comorbidities.
Because of the complex nature of diabetes, and as recommended by the American Diabetes Association, a collaborative and integrated team approach should be sought for its management, in which the patient must play an active role along with a multidisciplinary health care team.18 In this context, pharmacists can also contribute positively to diabetes management by providing pharmaceutical care programs, which involve working closely with the patient and other health care professionals in designing, implementing, and monitoring therapeutic plans to achieve specific outcomes that will improve patient quality of life.19 Because of the ongoing relationships with other health care professionals, pharmacists can also serve as a “bridge” between the patients and these health care professionals, thereby ensuring continuity of care, which is essential in the management of chronic diseases such as diabetes.
In the past decade or so, there has been a growing body of literature assessing the effectiveness of pharmacist involvement in the management of diabetic patients in various settings. Nevertheless, only a few systematic reviews have been published on this topic, and some of them evaluated pharmacist interventions in patients with type 1 diabetes as well as with type 2 diabetes.20,21 Moreover, some of these reviews focused on a limited number of outcomes,20-22 included other types of studies (e.g., cohort studies) in addition to randomized controlled trials,21,23 excluded some types of pharmacist interventions,21 and considered a small number of studies.22,23
In order to address these shortcomings, the purpose of this systematic review is to give a global and comprehensive review of the effectiveness of pharmacist interventions in the management of type 2 diabetes specifically, focusing on clinical, humanistic, and economic outcomes and including only the most robust studies, that is, randomized controlled trials, without putting restrictions on the type of pharmacist interventions.
Methods
Search Strategy and Inclusion Criteria
Three electronic databases (PubMed, Cochrane Central Register of Controlled Trials, and Web of Science) were searched from inception to January 2015. The PubMed search strategy served as a reference for the development of search strategies for the remaining databases. The search terms used included medical subject headings and text terms combined with Boolean operators. The detailed search strategy used for each database is provided in the Appendix (available in online article).
Studies were included in this review if they were randomized controlled trials or cluster-randomized controlled trials evaluating the effectiveness of interventions delivered only or mainly by pharmacists and directed at patients with type 2 diabetes in comparison with usual care. Studies that took place in a community pharmacy and in outpatient primary care and hospital settings were also included. Studies were included if they reported 1 or more of the following outcomes: glycosylated hemoglobin (Alc); blood glucose (fasting, postprandial, or random); blood pressure; lipid profile (total cholesterol, low-density lipoprotein cholesterol [LDL], high-density lipoprotein cholesterol [HDL], and triglycerides); body mass index (BMI); 10-year coronary heart disease (CHD) risk, medication adherence, health-related quality of life (HRQol), or economic outcomes.
No limitation regarding language or publication year was imposed. Conference abstracts were not included.
Study Selection
Two reviewers independently screened all titles and abstracts retrieved from the electronic databases using the prespecified inclusion criteria. Then, the full text of each potentially eligible article was obtained and screened independently by 2 reviewers to further assess its suitability for inclusion in this review. Any disagreement was resolved through discussion.
Data Extraction and Synthesis
A single reviewer extracted data from included studies using a standardized form (Microsoft Excel format, Microsoft Corporation, Redmond, WA).24 Subsequently, another reviewer independently checked the data extracted. No blinding regarding the journal or author was done. The data extracted from each study included authors, publication year, study design, setting and country where the study took place, sample size, patient age and gender, follow-up duration, details of pharmacist interventions and usual care, inclusion and exclusion criteria, and study outcomes.
The results for the outcome measures included in this review were summarized as change from baseline to final follow-up in intervention and control groups. When not reported, the difference in change between groups was calculated (change from baseline in the intervention group minus change from baseline in the control group).
In order to facilitate data visualization, bar charts were built for the following outcomes: Alc, blood glucose, blood pressure, and lipid profile. Since it was not feasible to include all studies in these charts, 7 to 9 studies with different follow-up durations and in which various types of interventions were carried out in different countries and health care facilities were selected for each outcome in order to reflect the variability of the studies included in this systematic review. In the process of selecting studies to be included in the charts, priority was also given to studies with larger sample sizes.
Risk of Bias Assessment
Two reviewers independently assessed the risk of bias in included studies using the Cochrane risk of bias tool.25 Given the nature of the interventions studied, participants and the personnel delivering the intervention could not be blinded. Therefore, the criteria relative to blinding of participants and personnel were not considered. So, the risk of bias in each study was assessed according to the following criteria: suitability of random sequence generation, concealment of allocation, blinding of outcome assessors, completeness of outcome data, selective outcome reporting, and other sources of bias. Each risk of bias item was rated as “low risk” if it was unlikely that a bias would seriously alter the results; “unclear” if it was likely that a bias would raise some doubt about the results; or “high risk” if it was likely that a bias would seriously alter the results. Any disagreement was resolved through discussion.
Results
Study Selection
Searching the electronic databases yielded 707 citations (Figure 1). After screening titles and abstracts, 59 citations potentially met the inclusion criteria. Of these, it was not possible to retrieve 4 full-text articles, so they were not included. Five studies were excluded because they were not randomized controlled trials. Two studies were also excluded because the pharmacist interventions were not directed specifically at patients with type 2 diabetes. Another study was also excluded because the outcome data were not reported in sufficient detail. Additionally, 2 duplicate publications, 1 review and 1 study protocol, and 7 conference abstracts were excluded because these types of publication were not suitable for inclusion in this review. In total, 36 studies met the inclusion criteria and were included in this systematic review. Additionally, another 3 study reports, found among the databases search results, were also obtained and used to extract data, since they contained relevant information for this review.
FIGURE 1.
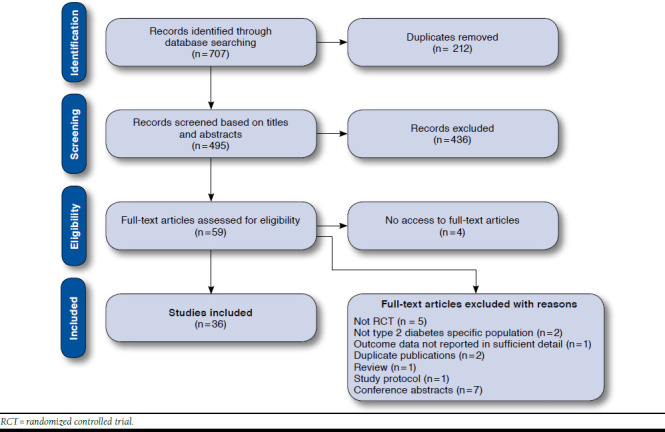
Flowchart of Study Selection Process
Study Characteristics
Among the included studies, 2 were cluster-randomized controlled trials in which the participating pharmacies were randomly assigned to either the intervention group or the control group.26,27 Eleven studies were conducted in North America,28-38 2 in South America,39,40 5 in Europe,27,41-44 1 in Africa,45 15 in Asia,46-60 and 2 in Australia.26,61 The settings in which the studies took place included community pharmacies, primary care clinics or health centers, and hospitals. Pharmacist interventions varied across the included studies and encompassed 1 or more of the following: counseling and education on diabetes, medication, lifestyle modification, and self-monitoring; reinforcement of medication adherence or complications screening; provision of materials such as educational leaflets and pill boxes; medication review; identification and resolution of drug-related problems; discussions with the primary care provider regarding pharmacotherapy; adjustment of pharmacotherapy; and referrals to other health care professionals. Two studies mentioned motivational interviews as a technique used to deliver advice to patients.43,53 In most studies, the control group received usual care from medical and nursing staff and/or community pharmacists, depending on the study setting. In 8 studies, pharmacist interventions were provided to the control group at the end of the study.44,46,47,52,55-57,59 Globally, the included studies involved 5,761 participants. The duration of follow-up ranged from 45 days to 24 months. A detailed description of the characteristics of included studies is presented in Table 1.
TABLE 1.
Characteristics of Included Studies
| Author, Year | Setting/Country | No. of Patients (n)a Lost to Follow-up (n) Age in Years (Mean [SD]) Gender (%) | Follow-up Duration | Pharmacist Intervention | Control | Outcome Measures |
|---|---|---|---|---|---|---|
| Adepu et al. 200747 | Community pharmacies/India | No. of patients (IG/CG): 35/35 Lost to follow-up (IG/CG): 3/7 Age (IG/CG): 51.45 [12.27]/53.77 [10.35] Gender (IG/CG): 74.3%/62.9% male | 6 monthsb | Counseling on disease, drugs, and lifestyle modification; provision of information leaflet highlighting the disease and lifestyle modifications | Counseling and information leaflets at end of study | Random CBG, KAP regarding diabetes, DQoL |
| Adepu and Ari 201046 | Medicine outpatient department at tertiary care teaching hospital/India | No. of patients: 240 Lost to follow-up: 13 Age: 57 Gender: 50.7% male | 3 months | Education regarding disease, medication, and lifestyle modification | Education at final follow-up visit | CBG, medication adherence, KAP regarding diabetes |
| Adibe et al. 201345 | Tertiary hospitals/ Nigeria | No. of patients (IG/CG): 110/110 Lost to follow-up (IG/CG): 11/17 Age (IG/CG): 52.4 [7.6]/52.8 [8.2] Gender (IG/CG): 44.6%/40.0% male | 12 months | Pharmaceutical care including education on diabetes, self-monitoring, medication, lifestyle modification, counseling, and effective interaction with health providers | Usual care offered by hospitals | HRQoL, cost-utility analysis66 |
| Al Mazroui et al. 200948 | Military hospital outpatient clinic/United Arab Emirates | No. of patients (IG/CG): 120/120 Lost to follow-up (IG/CG): 3/3 Age (IG/CG): 48.7 [8.2]/49.9 [8.3] Gender (IG/CG): 70.0%/68.3% male | 12 months | Pharmaceutical care including discussions with PCP regarding drug therapy; education on disease and medication; and advice on self-monitoring, physical exercise, diet, medication adherence, and smoking cessation | Usual care from medical and nursing staff | Alc, FBG, SBP, DBP, TC, LDL, HDL, TG, BMI, 10-year CHD risk, medication knowledge, medication adherence, adherence to lifestyle advice, HRQoL |
| Ali et al. 201241 | Community pharmacies/United Kingdom | No. of patients (IG/CG): 25/23 Lost to follow-up (IG/CG): 2/0 Age (IG/CG): 66.4 [12.7]/66.8 [10.2] Gender (IG/CG): 43.5%/56.5% male | 12 months | Pharmaceutical care including medicine use review; education regarding diabetes and its complications; and counselling on lifestyle modification with referral to other health care professional when appropriate | Usual service from general practitioner, practice nurse, and community pharmacy | Alc, BG, SBP, DBP, TC, LDL, HDL, TG, BMI, DQoL, HRQoL, diabetes knowledge, SIMS, beliefs about medicines, others |
| Chan et al. 201249 | Diabetes clinic at public hospital/ Hong Kong | No. of patients (IG/CG): 51/54 Lost to follow-up (IG/CG): 0/0 Age (IG/CG): 63.2 [9.5]/61.7 [11.2] Gender (IG/CG): 58.8%/51.9% male | 9 months | Pharmaceutical care program addressing medication adherence, knowledge and beliefs, skills, perceived health and cognitive functions, and identification of DRPs | Routine medical care | Alc,d SBP, DBP, TC, LDL,d HDL, TG, BMI, ACR, CHD risk,d stroke risk,d medication knowledge,d medication adherence,d cost-effec-tiveness analysis |
| Choe et al. 200528 | Primary care internal medicine clinic/USA | No. of patients (IG/CG): 41/39 Lost to follow-up (IG/CG): 5/10 Age (IG/CG): 52.2 [11.2]/51.0 [9.0] Gender (IG/CG): 48.8%/46.1% male | 24 months | Evaluation and modification of pharmacotherapy; education on diabetes self-management; and reinforcement of diabetes complications screening processes | Regular care, including regular follow-up visits with PCP | Alc,d rates of LDL measurement,d retinal examination,d urine microalbumin screening, monofilament testing for neuropathy,d and Alc measurement |
| Chung et al. 201450 | Teaching hospital/Malaysia | No. of patients (IG/CG): 120/121 Lost to follow-up: NR Age (IG/CG): 59.7 [9.5]/58.5 [8.3] Gender (IG/CG): 58.3%/53.7% female | 12 months | Pharmaceutical care including medication review; resolution of DRPs; and education on diabetes, hypertension, hyperlipidemia, and medications, emphasizing the importance of medication adherence | Standard pharmacy services | Alc, FBG, medication adherence |
| Clifford et al. 200561 | NR/Australia | No. of patients (IG/CG): 99/99 Lost to follow-up (IG/CG): 7/11 Age (IG/CG): 70.5 [7.1]/70.3 [8.3] Gender (IG/CG): 47.8%/56.8% male | 12 months | Pharmaceutical care including counseling on medication and lifestyle; provision of educational material; and clinical, biochemical, and medication-related data sent regularly to PCP | Usual care, including reinforcement of lifestyle issues | Alc,d FBG,d SBP,d DBP,d TC, HDL, TG, BMI,d ACR, 10-year CHD risk, stroke risk, physical activity, medication use |
| Cohen et al. 201129 | Veterans Affairs Medical Center/USA | No. of patients (IG/CG): 53/50 Lost to follow-up (IG/CG): 5/2 Age (IG/CG): 69.8 [10.7]/67.2 [9.4] Gender (IG/CG): 100.0%/96.0% male | 6 months | Part of a multidisciplinary diabetes specific healthy lifestyle education intervention and behavioral and pharmacologic interventions, including medication changes | Standard primary care | Alc, SBP,d LDL, HRQoL, perceived competence, adherence to self-care activities |
| Farsaei et al. 201151 | Outpatient clinic/Iran | No. of patients (IG/CG): 87/87 Lost to follow-up: NR Age (IG/CG): 53.4 [9.8]/52.9 [8.5] Gender (IG/CG): 63.2%/68.2% female | 3 months | Education on medications, adherence, and self-management and provision of a diabetes dairy log and pill box | Visits to PCP every 3 months | Alc, FBG |
| Fornos et al. 200642 | Community pharmacies/Spain | No. of patients (IG/CG): 58/56 Lost to follow-up (IG/CG): 2/0 Age (IG/CG): 62.4 [10.5]/64.9 [10.9] Gender (IG/CG): 57.1%/57.1% female | 13 months | Pharmacotherapy follow-up program consisting of detection and resolution of DRPs and diabetes education | Usual care | Alc,d FBG,d SBP,d DBP, TC,d LDL, HDL, TG, ACR, BMI, diabetes and medication knowledge,d DRPs,d drug knowledge,d,65 medication adherenced,65 |
| Ghosh et al. 201052 | Medicine department at medical hospital/India | No. of patients: 22 Lost to follow-up: 4 Age: NR Gender: 72.0% male | 45 days | Counseling on disease, medication, lifestyle modification, self-monitoring, and self-care and provision of information leaflets | Counseling and information leaflets at the end of the study | FBG, PPBG |
| Grant et al. 200330 | Community health center/USA | No. of patients (IG/CG): 118/114 Lost to follow-up (IG/CG): 8/13 Age (IG/CG): 63.3 [12.7]/64.9 [12.1] Gender (IG/CG): 52.0%/51.0% female | 3 months | Assessment of medication use; education regarding medication; arrangements for social services or nutrition consultation; and information forwarded to PCP | NR | Medication adherence, adherence to diet and exercise program, adherence barriers, medication discrepancies |
| Jaber et al. 199631 | Internal medicine outpatient clinic/USA | No. of patients (IG/CG): 23/22 Lost to follow-up (IG/CG): 6/0 Age (IG/CG): 59 [12]/65 [12] Gender (IG/CG): 70.6%/68.2% female | 4 months | Pharmaceutical care including education on diabetes; counseling on medication, instructions on dietary regulation, exercise and home blood glucose monitoring; and evaluation and adjustment of diabetes medication | Standard medical care from PCP | Alc,d FBG, SBP, DBP, TC, LDL, HDL, TG, SCr, CrCl, ACR, body weight, HRQoL |
| Jacobs et al. 201232 | Ambulatory general internal medicine clinic/USA | No. of patients (IG/CG): 195/201 Lost to follow-up (IG/CG): 22/24 Age (IG/CG): 62.7 [10.8]/63.0 [11.2] Gender (IG/CG): 68.0%/55.0% male | 12 months | Targeted physical assessment; education on diabetes; laboratory tests ordering; pharmacotherapy review, modification and monitorization; facilitation of self-monitoring of blood glucose; and reinforcement of dietary guidelines and exercise | Usual care | Alc,d SBP, DBP, LDL, BMI, medication use, microvascular parameters screeningd |
| Jarab et al. 201253 | Outpatient diabetes clinic at teaching hospital/Jordan | No. of patients (IG/CG): 85/86 Lost to follow-up (IG/CG): 8/7 Age (IG/CG): 63.4 [10.1]/65.3 [9.2] Gender (IG/CG): 42.4%/44.2% female | 6 months | Pharmaceutical care including education on diabetes, medication and lifestyle changes; review of prescribed treatment; referral to a smoking cessation program; and provision of booklet about diabetes medications and lifestyle changes | Usual care from medical and nursing staff | Alc,d FBG,d SBP,d DBP,d TC,d LDL,d HDL, TG,d BMI, medication adherence, adherence to self-care activities |
| Kjeldsen et al. 201543 | Community pharmacies/Denmark | No. of patients (IG/CG): 41/125 Lost to follow-up (IG/CG): 4/23 Age (IG/CG): 63.4 [7.8]/62.1 [10.2] Gender (IG/CG): 59.5%/62.4% male | 6 months | Screening for nonadherence; medication review; patient education regarding metabolic syndrome; coaching; support to structure and remember medication intake; feedback to PCP; and referral to other health services | NR | BG, SBP,d HRQoL, disease knowledge,d medication adherence, patient satisfaction with service, others |
| Krass et al. 200726 | Community pharmacies/Australia | No. of patients (IG/CG): 176/159 Lost to follow-up (IG/CG): 27/19 Age: 62 [11] Gender: 51.0% male | 6 months | Diabetes service including review of blood glucose self-monitoring; education on disease, medication, and lifestyle; adherence support and detection of DRPs; and referrals to PCP | Usual care | Alc,d BG, SBP, DBP, TC, TG, BMI, HRQoLd |
| Mahwi and Obied 201354 | Diabetic center/Iraq | No. of patients (IG/CG): 65/65 Lost to follow-up (IG/CG): 3/4 Age (IG/CG): 52.0 [7.86]/53.4 [10.81] Gender (IG/CG): 71.0%/67.2% female | 3 months | Pharmaceutical care, including education sessions | Usual medical care | Alc, FBG, medication adherence, DRPs |
| Malathy et al. 201155 | Multispecialty hospitals and diabetic clinic/India | No. of patients (IG/CG): 137/70 Lost to follow-up: NR Age (IG/CG): 52.07 [9.47]/51.02 [9.83] Gender (IG/CG): 71.5%/ 34.3% female | 3 months | Counseling on diabetes and complications, blood glucose control, lifestyle changes and foot care, and provision of information leaflets about diabetes and lifestyle changes | Counseling and information leaflets at end of study | PPBG, TC, LDL, HDL, TG, KAP regarding diabetes |
| Mehuys et al. 201127 | Community pharmacies/Belgium | No. of patients (IG/CG): 153/135 Lost to follow-up (IG/CG): 5/3 Age (IG/CG): 63.0/62.3 Gender (IG/CG): 51.0%/53.7% male | 24 monthsc | Education on diabetes and its complications, medication and healthy lifestyles, facilitation of medication adherence, and reminders about annual eye and foot examinations | Usual pharmacist care | Alc,d FBG, medication adherence, diabetes knowledge,d adherence to self-care activitiesd |
| Mourão et al. 201339 | Primary health care units/Brazil | No. of patients (IG/CG): 65/64 Lost to follow-up (IG/CG): 12/9 Age (IG/CG): 60.0 [10.2]/61.3 [9.9] Gender (IG/CG): 68.0%/66.0% female | 6 months | Pharmaceutical care, including identification of DRPs; proposals for pharmacotherapy changes forwarded to PCP; and education on diabetes, nonpharmacological issues, and pharmacological treatments | Usual health care | Alc,d FBG,d SBP,d DBP, TC,d LDL,d HDL,d TG,d BMI, medication use,d DRPs |
| Odegard et al. 200533 | Medicine clinics/USA | No. of patients (IG/CG): 43/43 Lost to follow-up (IG/CG): 4/7 Age (IG/CG): 51.6 [11.6]/51.9 [10.4] Gender (IG/CG): 48.0%/38.0% female | 12 months | Development and implementation of diabetes care plan and regular communication with patient and PCP on patient’s diabetes care progress | Normal care from PCP | Alc, medication appropriateness, medication adherence |
| Plaster et al. 201240 | Community health center/Brazil | No. of patients (IG/CG): 38/36 Lost to follow-up (IG/CG): 4/7 Age: NR Gender (IG/CG): 70.6%/60.0% female | 6 months | Pharmaceutical care program, including promotion of correct use of medication, provision of educative instructional material about lifestyle modifications, and interaction with PCP | Standard care | FBG, SBP, DBP, TC, LDL, HDL, TG, WC, body weight, 10-year CHD risk, negative outcomes associated with medication |
| Ramanath and Santhosh 201156 | General medicine department at tertiary care hospital/India | No. of patients (IG/CG): 57/56 Lost to follow-up (IG/CG): 5/8 Age: NR Gender (IG/CG): 67.3%/50.0% male | 3 months | Educational materials and counseling | Educational materials and counseling at last follow-up | FBG, PPBG, medication adherence, KAP regarding diabetes, HRQoL |
| Rothman et al. 200534 | General internal medicine practice/USA | No. of patients (IG/CG): 112/105 Lost to follow-up (IG/CG): 13/10 Age (IG/CG): 54 [13]/57 [11] Gender (IG/CG): 56.0%/56.0% female | 12 months | Education, counseling, and medication management | Usual care from PCP | Alc,d SBP,d DBP,d TC, body weight, aspirin and statin use, diabetes knowledge, diabetes treatment satisfaction, use of clinical services, adverse events |
| Sarkadi and Rosenqvist 200444 | Community pharmacies/Sweden | No. of patients (IG/CG): 39/38 Lost to follow-up (IG/CG): 6/7 Age (IG/CG): 66.4 [7.9]/66.5 [10.7] Gender: NR | 24 months | Educational program regarding disease, lifestyle changes, and self-monitoring and provision of educational materials | Educational program at end of study | Alc |
| Scott et al. 200635 | Community health center/USA | No. of patients (IG/CG): 76/73 Lost to follow-up (IG/CG): 5/4 Age: NR Gender (IG/CG): 57.9%/64.4% female | 9 months | Education on diabetes, medication, lifestyle adjustments, self-monitoring, and self-care; medication review; and pharmacotherapy recommendations made to PCP | Standard diabetes care | Alc,d SBP,d DBP, LDL,d HDL, BMI, body weight, DQoL, aspirin use, influenza vaccination |
| Simpson et al. 201136 | Primary care clinics/Canada | No. of patients (IG/CG): 131/129 Lost to follow-up (IG/CG): 21/16 Age (IG/CG): 58.8 [11.1]/59.4 [12.1] Gender (IG/CG): 56.5%/58.1% female | 12 months | Medication assessments, limited history and physical examinations, and guideline-concordant recommendations discussed with PCP to optimize medication management | Usual care from primary care team | Alc, SBP,d DBP,d TC, LDL, HDL, 10-year CHD risk,d antihypertensive medication changes, number of health care-related contacts, cost-effectiveness analysis67 |
| Sriram et al. 201157 | General medicine department at tertiary care teaching hospital/India | No. of patients (IG/CG): 60/60 Lost to follow-up: NR Age (IG/CG): 53.65 [2.38]/57.98 [2.62] Gender (IG/CG): 50.0%/50.0% female | 8 monthsb | Pharmaceutical care, including education on diabetes, counseling on medication and lifestyle modification, and provision of an information leaflet, a diabetic diet chart, and a diabetic diary | Pharmaceutical care at end of study | Alc, FBG, BMI, DQoL, satisfaction with diabetes treatment |
| Suppapitiporn et al. 200558 | Endocrine clinic at hospital/Thailand | No. of patients (IG/CG): 180/180 Lost to follow-up: NR Age (IG/CG): 61.4 [10.6]/59.9 [11.5] Gender (IG/CG): 67.2%/64.4% female | 6 months | IG divided into 4 groups: all groups received diabetes drug counseling; additionally, 1 group received a diabetes booklet, 1 group received special medication containers, and 1 group received both | Conventional treatment | Alc, FBG |
| Taveira et al. 201038 | Veteran Affairs Medical Center/USA | No. of patients (IG/CG): 64/54 Lost to follow-up (IG/CG): 6/3 Age (IG/CG): 62.2 [10.3]/66.8 [10.2] Gender (IG/CG): 91.4%/100.0% male | 4 months | Part of multidisciplinary education intervention regarding self-care behaviors and behavioral and pharmacological interventions, including medication changes | Usual care from PCP | Alc,d SBP, DBP,d LDL, non-HDL, BMI, tobacco use, adherence to self-care behaviors |
| Taveira et al. 201137 | Veteran Affairs Medical Center/USA | No. of patients (IG/CG): 44/44 Lost to follow-up (IG/CG): 0/2 Age (IG/CG): 60.2 [9.3]/61.4 [9.9] Gender (IG/CG): 100.0%/95.5% male | 6 months | Part of a multidisciplinary education intervention regarding self-care behaviors and behavioral and pharmacological interventions, including medication changes | Standard care from PCP | Alc,d SBP, LDL, non-HDL, 10-year CHD risk, tobacco use, adherence to self-care behaviors, perceived competence, depression symptoms |
| Venkatesan et al. 201259 | Community pharmacies/India | No. of patients (IG/CG): 19/20 Lost to follow-up (IG/CG): 0/NR Age (IG/CG): 51.47 [9.99]/57.05 [12.06] Gender (IG/CG): 57.9%/50.0% female | 8 months | Counselling about diabetes, lifestyle modifications, and medication and provision of educational material | Counseling at end of study | FBG, BMI, diabetes care profile, diabetes knowledge |
| Wishah et al. 201460 | Outpatient diabetes clinic at teaching hospital/Jordan | No. of patients (IG/CG): 52/54 Lost to follow-up (IG/CG): 2/3 Age (IG/CG): 52.9 [9.6]/53.2 [11.2] Gender (IG/CG): 61.5%/51.9% female | 6 months | Pharmaceutical care, including optimization of drug therapy; education and counseling on diabetes and medication; enhancement of adherence to medication and self-care activities; and provision of educational leaflet and brochures | Usual care from medical and nursing staff | Alc,d FBG,d TC, LDL, HDL, TG, BMI, diabetes knowledge, medication adherence, adherence to self-care activities |
a Allocated to intervention group and control group.
b Study duration.
c 24-month follow-up for Alc and FBG; 6-month follow-up for the other outcomes.
d The study reported a statistically significant difference in change between groups.
Alc = glycosylated hemoglobin; ACR = albumin-to-creatinine ratio; BG = blood glucose; BMI = body mass index; CBG = capillary blood glucose; CG = control group; CHD = coronary heart disease; CrCl = creatinine clearance; DBP = diastolic blood pressure; DQoL = diabetes quality of life; DRPs = drug-related problems; FBG = fasting blood glucose; HDL = high-density lipoprotein cholesterol; HRQoL = health-related quality of life; IG = intervention group; KAP = knowledge, attitude, and practice; LDL = low-density lipoprotein cholesterol; NR = not reported; PCP = primary care provider; PPBG = postprandial blood glucose; SBP = systolic blood pressure; SCr = serum creatinine; SD = standard deviation; SIMS = satisfaction with information received about medicines; TC = total
Study Risk of Bias
The risk of bias varied among the included 36 studies (Figure 2). In half (50.0%) of the studies, the allocation sequence was sufficiently generated. The allocation sequence was concealed, and outcome assessors were blinded in only a few studies (13.9% and 2.8%, respectively). In most studies (97.3%), there was or might have been a risk of bias because of selective outcome reporting. Only 11 studies (30.6%) reported outcome data completely, and 13 studies (36.1%) were free of other source of bias.
FIGURE 2.
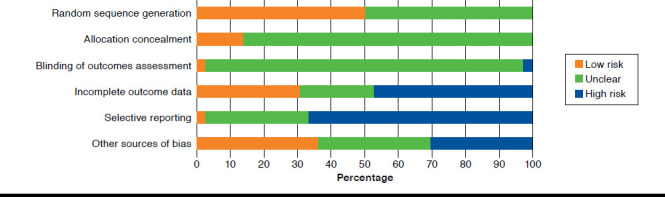
Risk of Bias in Included Studies Presented as Percentage Across All Studies
Study Outcomes
Alc and Blood Glucose.
Alc was considered as an outcome measure in 26 studies (Table 2). Alc mean value decreased in the intervention group during the follow-up period in all studies, and 24 studies reported a greater improvement in this outcome in the intervention group compared with the control group, some of which are shown in Figure 3A. Of note, in 11 studies, the reduction in Alc in the intervention group was greater than that recorded in the control group by approximately 1% or more.28,31,32,35,41,48-50,54,57,60 In another study, Alc mean value decreased in the intervention group by 1.7%, while there was a 0.1% increase in the control group.51 Nevertheless, 2 studies presented an imbalance between the baseline Alc mean values of both groups.54,60 The difference in Alc change from baseline to final follow-up between the intervention group and the control group ranged from -0.18% to -2.1%. Fifteen studies reported a statistically significant difference in change between the 2 groups (Table 2).26-28,31,32,34,35,37-39,42,49,53,60,61 However, in 1 study, there was a significant difference between the baseline Alc mean values of both groups, and the appropriate statistical analysis to adjust for this baseline difference was not conducted.60
TABLE 2.
Studies with Results for A1c, Blood Glucose, and Blood Pressure
| Author, Year | A1c (%) | Blood Glucose (mg dL-1) | Blood Pressure (mmHg) | ||||
|---|---|---|---|---|---|---|---|
| Change from Baseline to Final Follow-up | Difference in Change Between Groups a | Change from Baseline to Final Follow-up | Difference in Change Between Groups a | Change from Baseline to Final Follow-up | Difference in Change Between Groups a | ||
| Adepu et al. 200747 | NR | – | Random capillary blood glucose IG: 198.31 to 142 (P < 0.001) CG: 173.6 to 171 (P > 0.05) | -53.71b | NR | – | |
| Adepu and Ari 201046 | NR | – | Capillary blood glucose IG: significant decrease (P = 0.001) CG: nonsignificant decrease (P = 0.798) | – | NR | – | |
| Al Mazroui et al. 200948 | IG: 8.5 to 6.9 (P < 0.001) CG: 8.4 to 8.3b | -1.5b | Fasting blood glucose IG: 194.94 to 140.04 CG: 184.68 to 170.64 | -40.86b | SBP | IG: 131.4 to 127.2 (P < 0.001) CG: 132.6 to 132.1b | -3.7b |
| DBP | IG: 85.2 to 76.3 (P 0.001) CG: 83.9 to 84.1b | -9.1b | |||||
| Ali et al. 201241 | IG: 8.2 to 6.6 (P < 0.001) CG: 8.1 to 7.5 (P = 0.033) | -1.01b | IG: 158.40 to 123.84 (P < 0.001) CG: 171.54 to 162.72 (P = 0.097) | -25.74b | SBP | IG: 146.26 to 126.17 (P < 0.001) CG: 136.22 to 139.17 (P = 0.450) | -23.05b |
| DBP | IG: 87.13 to 81.04 (P = 0.010) CG: 85.65 to 81.7 (P = 0.090) | -2.13b | |||||
| Chan et al. 201249 | IG: 9.7 to 8.13 CG: 9.5 to 9.1 | -1.17 (P < 0.001) | NR | – | SBP | IG: 141 to 134.5 CG: 138 to 134.8 | -3.3 (P = 0.34) |
| DBP | IG: 75 to 72.2 CG: 74 to 73.3 | -2.1 (P = 0.23) | |||||
| Choe et al. 200528 | IG: 10.1 to 8.0 CG: 10.2 to 9.3 | -1.2 (P = 0.03) | NR | – | NR | – | |
| Chung et al. 201450 | IG: 9.6 to 8.2 (P < 0.001) CG: 9.5 to 9.3 (P = 0.265) | -1.2b | Fasting blood glucose IG: 169.2 to 135.0 (P < 0.001) CG: 165.6 to 174.6 (P = 0.257) | -43.2b | NR | – | |
| Clifford et al. 200561 | IG: 7.5 to 7.0 CG: 7.1 to 7.1 | -0.5 (P = 0.002) | Fasting blood glucose IG: 158.4 to 144.0 CG: 145.8 to 153.0 | -21.6 (P < 0.001) | SBP | IG: 157 to 143 CG: 156 to 149 | -7 (P = 0.024) |
| DBP | IG: 77 to 72 CG: 77 to 75 | -3 (P = 0.043) | |||||
| Cohen et al. 201129 | IG: 7.8 to 7.39 CG: 8.1 to 7.9 | -0.21 (NS)b | NR | – | SBP | IG: 136.1 to 126.91 CG: 136.1 to 135.3 | -8.39 (Sig.)b |
| Farsaei et al. 201151 | IG: 9.3 to 7.5 (P < 0.001) CG: 8.9 to 9.0 (P = 0.317) | -1.8b | Fasting blood glucose IG: 176.6 to 145.8 (P < 0.001) CG: 170.4 to 165.9 (P = 0.528) | -26.3b | NR | – | |
| Fornos et al. 200642 | IG: 8.4 to 7.9 (P < 0.001) CG: 7.8 to 8.5 (P < 0.001) | -1.2 (P < 0.001) | Fasting blood glucose IG: 172 to 153 (P < 0.001) CG: 160 to 168 (P = 0.042) | -27 (P < 0.001) | SBP | IG: 143 to 135 (P < 0.001) CG: 148 to 150 (P = 0.577) | -10 (P < 0.001) |
| DBP | IG: 80.2 to 78.2 (P = 0.050) CG: 82.2 to 82.1 (P = 0.686) | -1.9 (NS)b | |||||
| Ghosh et al. 201052 | NR | – | Fasting blood glucose IG: 227 to 180 (P < 0.05) CG: 227 to 195b Postprandial blood glucose IG: 291 to 194 (P < 0.01) CG: 291 to 229b | -15b -35b | NR | – | |
| Jaber et al. 199631 | IG: 11.5 to 9.2 (P = 0.015) CG: 12.2 to 12.1b | -2.1 (P = 0.021) | Fasting blood glucose IG: 199.8 to 153.0 (P = 0.003) CG: 228.6 to 198.0b | -14.4 (NS)b | SBP | IG: 147 to 140 (P = 0.07) CG: NR | – |
| DBP | IG: 88 to 82 (P = 0.07) CG: NR | ||||||
| Jacobs et al. 201232 | IG: 9.5 to 7.7 CG: 9.2 to 8.4 | -1.0 (P < 0.05) | NR | – | SBP | IG: 142.5 to 132.5 CG: 134.8 to 135.4 | -10.6b |
| DBP | IG: 79.4 to 72.0 CG: 78.3 to 77.6 | -6.7b | |||||
| Jarab et al. 201253 | IG: 8.5 to 7.7 CG: 8.4 to 8.5 | -0.9 (P = 0.019) | Fasting blood glucose IG: 225.0 to 183.6 CG: 210.6 to 226.8 | -57.6 (P = 0.014) | SBP | IG: 132 to 126.2 CG: 134 to 135.1 | -6.9 (P = 0.035) |
| DBP | IG: 85 to 77.9 CG: 85 to 86.8 | -8.9 (P = 0.026) | |||||
| Kjeldsen et al. 201543 | NR | – | IG: nonsignificant decrease CG: NR | – | SBP | IG: 138 to 131.3 CG: 139 to 137.6 | -5.3 (P = 0.02) |
| Krass et al. 200726 | IG: 8.9 to 7.9 CG: 8.3 to 8.0 | -0.7 (P < 0.01) | IG: 169.2 to 153.0 (P < 0.001) CG: NR | – | SBP | IG: 135 to 133 CG: 133 to 135 | -4.8 (P = 0.06) |
| DBP | IG: 79 to 77 CG: 77 to 76 | -1.1 (P = 0.52) | |||||
| Mahwi and Obied 201354 | IG: 11.53 to 9.2 (P < 0.001) CG: 9.97 to 9.5 (P = 0.341) | -1.86b | Fasting blood glucose IG: 249.4 to 196.4 (P = 0.001) CG: 211.1 to 195.4 (P = 0.196) | -37.3b | NR | – | |
| Malathy et al. 201155 | NR | – | Postprandial blood glucose IG: 237.0 to 204.47 (P < 0.001) CG: 229.17 to 211.4b | -14.76b | NR | – | |
| Mehuys et al. 201127 | IG: 7.7 to 7.1 (P < 0.001)c CG: 7.3 to 7.2 (P = 0.162)c | -0.5 (P = 0.009) | Fasting blood glucosec IG: 154.1 to 138.8 (P < 0.001) CG: 153.9 to 145.8 (P = 0.004) | -5.9 (P = 0.193) | NR | – | |
| Mourão et al. 201339 | IG: 9.9 to 9.3 CG: 9.5 to 10.2 | -1.3 (P = 0.001) | Fasting blood glucose IG: 177.7 to 156.3 CG: 174.4 to 187.8 | -34.8 (P = 0.007) | SBP | IG: 152.9 to 140.8 CG: 140.4 to 137.5 | -9.2 (P = 0.013) |
| DBP | IG: 85.1 to 82.1 CG: 82.9 to 80.4 | -0.5 (P = 0.809) | |||||
| Odegard et al. 200533 | IG: 10.2 to 8.2 CG: 10.6 to NR | - (P = 0.61) | NR | – | NR | – | |
| Plaster et al. 201240 | NR | – | Fasting blood glucose IG: 198 to 130 (P < 0.01) CG: 181 to 173b | -60b | SBP | IG: 138 to 131 CG: 138 to 141 | -10b |
| DBP | IG: 80 to 78 CG: 80 to 81 | -3b | |||||
| Ramanath and Santhosh 201156 | NR | – | Fasting blood glucose IG: 151.13 to 132.50 CG: 138.50 to 146.21 Postprandial blood glucose IG: 219.69 to 178.87 CG: 200.42 to 201.19 | -26.34b -41.59b | NR | – | |
| Rothman et al. 200534 | IG: 11.0 to 8.5 CG: 11.0 to 9.4 | -0.8 (P = 0.05) | NR | – | SBP | IG: 140 to 133 CG: 137 to 139 | -9 (P = 0.008) |
| DBP | IG: 82 to 78 CG: 80 to 81 | -5 (P = 0.02) | |||||
| Sarkadi and Rosenqvist 200444 | IG: decreased significantly by 0.4% CG: increased nonsignificantly | – | NR | – | NR | – | |
| Scott et al. 200635 | IG: 8.8 to 7.08 (P = 0.003) CG: 8.7 to 8.0 (P < 0.05) | -1.0 (P < 0.05) | NR | – | SBP | IG: 130.0 to 126.6 CG: 130.7 to 132.8 | -5.5 (P = 0.023) |
| DBP | IG: 79.3 to 75.9 CG: 79.6 to 78.2 | -2.0b | |||||
| Simpson et al. 201136 | IG: 7.5 to 7.35 CG: 7.3 to 7.33 | -0.18 (NS)b | NR | – | SBP | IG: 130.4 to 123.0 (P < 0.001) CG: 128.3 to 125.8 (P = 0.06) | -4.9 (P = 0.01) |
| DBP | IG: 74.4 to 72.1 (P < 0.05) CG: 73.9 to 74.5b | -2.9 (P < 0.05) | |||||
| Sriram et al. 201157 | IG: 8.44 to 6.73 (P < 0.01) CG: 9.03 to 8.31 (P 0.05) | -0.99b | Fasting blood glucose IG: 195.57 to 107.25 (P < 0.01) CG: 186.00 to 149.57 (P 0.05) | -51.89b | NR | – | |
| Suppapitiporn et al. 200558 | IG: 8.16 to 7.91 CG: 8.01 to 8.80 | -1.04b | Fasting blood glucose IG: 152.36 to 145.20 CG: 150.16 to 159.16 | -16.16b | NR | – | |
| Taveira et al. 201038 | IG: 8.1 to 7.2 (P < 0.05) CG: 7.9 to 7.9b | -0.9 (P < 0.05) | NR | – | SBP | IG: 131.1 to 123.8 (P < 0.05) CG: 137.2 to 135.5b | -5.6 (NS)b |
| DBP | IG: 74.4 to 67.9 (P < 0.05) CG: 74.2 to 75.2b | -7.5 (P < 0.05) | |||||
| Taveira et al. 201137 | IG: 8.3 to 7.4 (P < 0.05) CG: 8.5 to 8.4b | -0.9 (P < 0.05) | NR | – | SBP | IG: 130.6 to 123.4 (P < 0.05) CG: 125.2 to 127.0b | -8.9 (NS)b |
| Venkatesan et al. 201259 | NR | – | Fasting blood glucose IG: 155.58 to 108.10 CG: 150.30 to 169.70 | -66.87b | NR | – | |
| Wishah et al. 201460 | IG: 8.9 to 7.2 CG: 8.2 to 7.9 | -1.4 (P& 0.05) | Fasting blood glucose IG: 180.2 to 126.9 CG: 159.6 to 158.0 | -51.4 (P < 0.05) | NR | – | |
aNegative values indicate IG had greater decrease; positive values indicate CG had greater decrease.
bP value not reported.
c Over the 6-month follow-up period.
A1c = glycosylated hemoglobin; CG = control group; DBP = diastolic blood pressure; IG = intervention group; NR = not reported; NS = not significant; SBP = systolic blood pressure; Sig. = significant.
FIGURE 3.
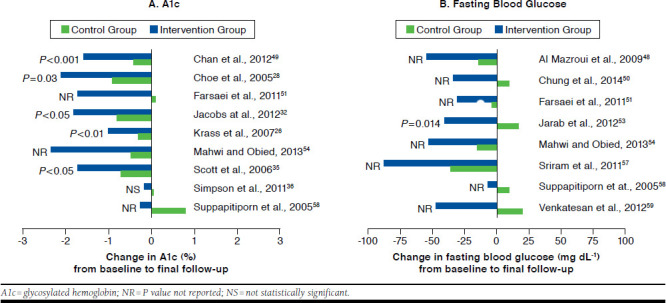
Effect of Pharmacist Interventions on Alc and Fasting Blood Glucose Compared with Control Group
Regarding blood glucose, 23 studies reported this parameter as an outcome measure (Table 2). In all studies, there was a decrease in blood glucose (fasting, postprandial, or random) in the intervention group from baseline to final follow-up, and 20 studies reported a greater improvement in this outcome in the intervention group when compared with the control group. Nevertheless, the difference in change (ranged from -5.9 mg dL-1 to -66.87 mg dL-1) between both groups was reported as statistically significant in only 5 studies (Table 2).39,42,53,60,61 The greater reduction in fasting blood glucose in the intervention group in comparison with the control group is shown in Figure 3B for some studies.
Blood Pressure.
Eighteen studies evaluated the change in systolic blood pressure during the course of the study (Table 2). In all of them, there was a reduction in mean systolic blood pressure in the intervention group from baseline to final follow-up, and 17 studies reported a greater improvement in this outcome in the intervention group compared with the control group, some of which are shown in Figure 4A. For systolic blood pressure, the difference in change between the groups ranged from -3.3 mmHg to -23.05 mmHg and was shown to be statistically significant in only 9 studies (Table 2).29,34-36,39,42,43,53,61 Nevertheless, in 1 of these studies, there was a difference in baseline mean values between the intervention and the control groups, and the appropriate statistical analysis to adjust for this baseline difference was not conducted.39
FIGURE 4.
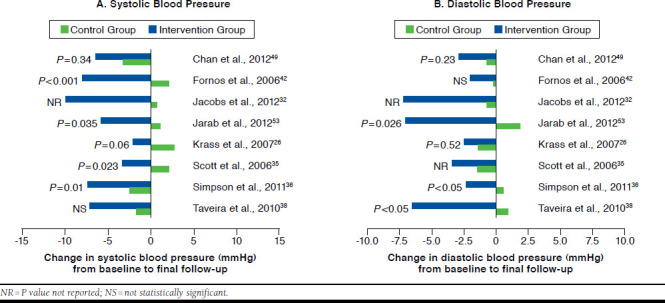
Effect of Pharmacist Interventions on Systolic Blood Pressure and Diastolic Blood Pressure Compared with Control Group
As for diastolic blood pressure, 15 studies reported data on this outcome (Table 2). In all studies, mean diastolic blood pressure decreased in the intervention group during the follow-up period, and 14 studies reported a greater reduction in this outcome in the intervention group in comparison with the control group, some of which are shown in Figure 4B. However, only a third of the studies revealed a statistically significant difference in change from baseline to final follow-up between the intervention group and the control group (Table 2).34,36,38,53,61 The difference in change between the 2 groups ranged from -0.21 mmHg to -9.1 mmHg.
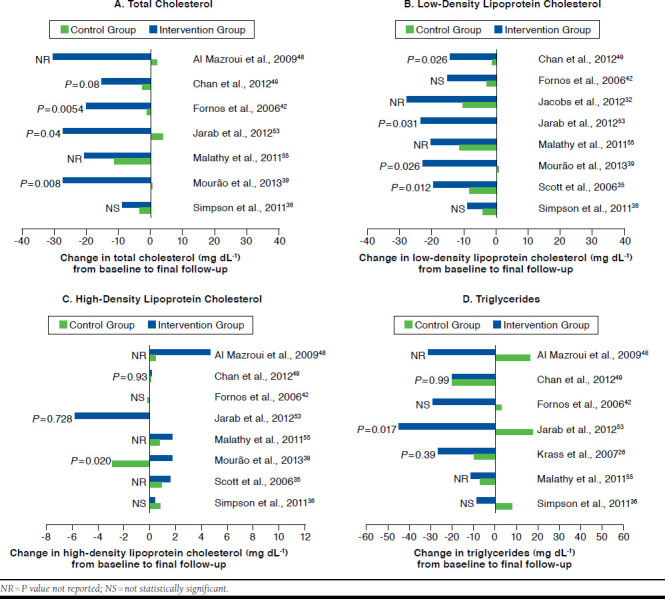
Lipid Profile.
Thirteen studies described total cholesterol as an outcome measure (Table 3). In all of these studies, there was a reduction in the intervention group from baseline to final follow-up, and 10 studies reported a greater improvement in this outcome in the intervention group in comparison with the control group. However, the difference in change (ranged from +18.95 mg dL-1 to -32.48 mg dL-1) between the 2 groups was reported as statistically significant in only 3 studies (Table 3).39,42,53
TABLE 3.
Studies with Results for Lipid Profile, Body Mass Index, and 10-Year CHD Risk
| Author, Year | Lipid Profile (mg dL-1) | Body Mass Index (kg m-2) | 10-Year CHD Risk | ||||
|---|---|---|---|---|---|---|---|
| Change from Baseline to Final Follow-up | Difference in Change Between Groupsa | Change from Baseline to Final Follow-up | Difference in Change Between Groupsa | Change from Baseline to Final Follow-up | Difference in Change Between Groupsa | ||
| Al Mazroui et al. 200948 | TC | IG: 203.40 to 172.85 CG: 203.79 to 205.72 | -32.48b | IG: 28.34 to 27.29 (P < 0.005) CG: 27.98 to 27.99 (P > 0.05) | -1.06b | Framingham risk prediction score IG: 10.6% to 7.7% (P < 0.001) CG: 11.4% to 11.5% (P > 0.05) BNF risk prediction (% of patients at low risk) IG: 63.3% to 85.5% CG: 65.0% to 59.0% |
-3.0%b 28.2%b, c |
| LDL | IG: 137.28 to 117.56 CG: 134.57 to 139.60 | -24.75b | |||||
| HDL | IG: 46.40 to 51.04 (P < 0.05) CG: 46.02 to 46.40b | 4.25b | |||||
| TG | IG: 141.71 to 110.71 CG: 137.28 to 154.11 | -47.83b | |||||
| Ali et al. 201241 | TC | IG: 160.48 to 159.32 (P = 0.811) CG: 141.53 to 121.42 (P < 0.001) | 18.95b | IG: 30.84 to 26.98 (P < 0.001) CG: 29.82 to 28.73 (P = 0.059) | -2.77b | NR | – |
| LDL | IG: 90.87 to 76.18 (P = 0.009) CG: 69.99 to 48.34 (P < 0.001) | 7.35b | |||||
| HDL | IG: 46.02 to 56.46 (P = 0.001) CG: 46.40 to 48.34 (P = 0.575) | 8.12b | |||||
| TG | IG: 119.57 to 134.63 (P = 0.140) CG: 127.54 to 157.65 (P = 0.940) | -15.05b | |||||
| Chan et al. 201249 | TC | IG: 170.15 to 155.07 CG: 182.14 to 179.43 | -12.37 (P = 0.08) | IG: 25.2 to 25.04 CG: 26.2 to 26.27 | -0.23 (P = 0.24) | Score obtained from a validated CHD risk equation for Hong Kong population IG: 2.16 to 2.05 CG: 2.17 to 2.17 | -0.11 (P < 0.001) |
| LDL | IG: 101.32 to 87.39 CG: 107.12 to 105.96 | -12.76 (P = 0.026) | |||||
| HDL | IG: 42.15 to 42.304 CG: 44.47 to 44.548 | 0.078 (P = 0.93) | |||||
| TG | IG: 154.11 to 134.63 CG: 168.28 to 148.80 | 0.00 (P = 0.99) | |||||
| Clifford et al. 200561 | TC | IG: 193.4 to 181.7 CG: 189.5 to 181.7 | -3.9 (P = 0.14) | IG: 30.0 to 29.4 CG: 30.0 to 30.1 | -0.7 (P = 0.005) | UKPDS risk engine score IG: 25.1% to 20.3% (P = 0.002) CG: 26.1% to 26.4% (P = 0.17) | -5.1%b |
| HDL | IG: 46.02 to 47.18 CG: 46.02 to 45.24 | 1.93 (P = 0.07) | |||||
| TG | IG: 150.6 to 97.4 CG: 141.7 to 141.7 | -53.1 (P = 0.09) | |||||
| Cohen et al. 201129 | LDL | IG: 96.1 to 86.7 CG: 110.7 to 99.17 | 2.13 (NS)b | NR | – | NR | – |
| Fornos et al. 200642 | TC | IG: 222 to 202 (P < 0.001) CG: 218 to 217 (P = 0.716) | -19 (P = 0.0054) | IG: 31.0 to 30.1 (P = 0.018) CG: 31.7 to 31.4 (P = 0.650) | -0.6 (NS)b | NR | – |
| LDL | IG: 141 to 126 (P < 0.001) CG: 136 to 133 (P = 0.488) | -12 (NS)b | |||||
| HDL | IG: 48.5 to 48.5 (P = 0.981) CG: 49.9 to 49.7 (P = 0.887) | 0.2 (NS)b | |||||
| TG | IG: 167 to 138 (P = 0.181) CG: 168 to 171 (P = 0.229) | -32 (NS)b | |||||
| Jaber et al. 199631 | No significant changes within or between IG and CG | – | NR | – | NR | – | |
| Jacobs et al. 201232 | LDL | IG: 121.5 to 93.7 CG: 115.1 to 105.1 | -17.8b | IG: 32.8 to 33.2 CG: 31.8 to 31.6 | 0.6b | NR | – |
| Jarab et al. 201253 | TC | IG: 181.7 to 154.7 CG: 181.7 to 185.6 | -30.9 (P = 0.040) | IG: 32.4 to 31.9 CG: 32.8 to 33.2 | -0.9 (P = 0.189) | NR | – |
| LDL | IG: 81.2 to 58.0 CG: 85.1 to 85.1 | -23.2 (P = 0.031) | |||||
| HDL | IG: 50.3 to 44.5 CG: 50.3 to 50.3 | -5.8 (P = 0.728) | |||||
| TG | IG: 168.3 to 124.0 CG: 177.1 to 194.9 | -62.0 (P = 0.017) | |||||
| Krass et al. 200726 | TC | IG: 189.5 to 181.7 CG: 189.5 to 181.7 | 0.0 (P = 0.85) | IG: 31.4 to 31.1 CG: 31.3 to 31.1 | -0.2 (P = 0.37) | NR | – |
| TG | IG: 177.1 to 159.4 CG: 159.4 to 150.6 | -17.7 (P = 0.39) | |||||
| Malathy et al. 201155 | TC | IG: 206.2 to 185.7 (P < 0.001) CG: 202.8 to 191.5 (P < 0.05) | -9.2b | NR | – | NR | – |
| LDL | IG: 141.12 to 120.9 (P < 0.001) CG: 138.26 to 127.2 (P < 0.01) | -9.16b | |||||
| HDL | IG: 34.9 to 36.6 (P < 0.05) CG: 33.4 to 34.1b | 1.0b | |||||
| TG | IG: 150.9 to 140.6 (P < 0.001) CG: 155.7 to 148.5b | -3.1b | |||||
| Mourão et al. 201339 | TC | IG: 216.3 to 189.3 CG: 207.5 to 207.8 | -27.3 (P = 0.008) | IG: 30.3 to 30.4 CG: 30.3 to 30.0 | 0.4 (P = 0.106) | NR | – |
| LDL | IG: 128.9 to 105.9 CG: 123.0 to 123.5 | -23.5 (P = 0.026) | |||||
| HDL | IG: 51.8 to 53.5 CG: 53.4 to 50.6 | 4.5 (P = 0.020) | |||||
| TG | IG: 171.2 to 152.2 CG: 162.4 to 177.4 | -34.0 (P = 0.007) | |||||
| Plaster et al. 201240 | TC | IG: 205 to 182 (P < 0.01) CG: 209 to 210b | -24b | NR | – | Framingham risk prediction score IG: 22% to 14% (P < 0.01) CG: 22% to 26% (P < 0.05) | -12%b |
| LDL | IG: 149 to 111 (P < 0.01) CG: 140 to 132b | -30b | |||||
| Men HDL | IG: 40 to 47 (P < 0.05) CG: 44 to 40b | 11b | |||||
| Women HDL | IG: 42 to 49 (P < 0.05) CG: 45 to 41b | 11b | |||||
| TG | IG: 186 to 165 CG: 207 to 174 | 12b | |||||
| Rothman et al. 200534 | TC | IG: 213 to 186 CG: 201 to 189 | -15 (NS)b | NR | – | NR | – |
| Scott et al. 200635 | LDL | IG: 116.1 to 96.7 CG: 120.5 to 112.3 | -11.2 (P = 0.012) | IG: 36.4 to 36.0 CG: 35.9 to 35.7 | -0.2b | NR | – |
| HDL | IG: 41.3 to 42.9 CG: 41.5 to 42.4 | 0.7b | |||||
| Simpson et al. 201136 | TC | IG: 170.53 to 161.64 (P < 0.05) CG: 168.99 to 165.51b | -5.41 (NS)b | NR | – | UKPDS risk engine score IG: 19.5% to 16.8% (P < 0.001) CG: 21.0% to 19.8% (P = 0.06) | -1.5% (P = 0.005) |
| LDL | IG: 93.58 to 84.69 (P < 0.05) CG: 93.19 to 89.33b | -5.41 (NS)b | |||||
| HDL | IG: 44.47 to 44.86 CG: 44.47 to 45.24 | -0.77 (NS)b | |||||
| TG | IG: 168.28 to 160.31 CG: 154.11 to 162.08 | -15.94 (NS)b | |||||
| Sriram et al. 201157 | NR | – | IG: 25.01 to 23.16 (P < 0.05) CG: 24.66 to 24.75 (P > 0.05) | -1.94b | NR | – | |
| Taveira et al. 201038 | LDL | IG: 92.8 to 81.5 (P < 0.05) CG: 92.8 to 85.0 (P < 0.05) | -3.5 (NS)b | IG: 33.8 to 33.73 CG: 31.7 to 31.71 | -0.08 (P = 0.11) | NR | – |
| Non-HDL | IG: 133.1 to 113.8 (P < 0.05) CG: 125.3 to 119.7b | -13.7 (NS)b | |||||
| Taveira et al. 201137 | LDL | IG: 101.0 to 92.5 (P < 0.05) CG: 101.5 to 93.9b | -1.0 (NS)b | NR | – | UKPDS risk engine score IG: 20.6% to 15.7% (P < 0.05) CG: 22.7% to 20.4%b | -2.6% (NS)b |
| Non-HDL | IG: 137.8 to 126.6 (P < 0.05) CG: 149.6 to 133.9 (P < 0.05) | 4.5 (NS)b | |||||
| Venkatesan et al. 201259 | NR | – | IG: 25.09 to 22.99 CG: 25.81 to 24.38 | -0.67b | NR | – | |
| Wishah et al. 201460 | TC | IG: 184.6 to 165.2 CG: 185.5 to 173.6 | -7.5b | IG: 31.1 to 30.6 CG: 29.3 to 29.8 | -1.0 (P = 0.11) | NR | – |
| LDL | IG: 114.2 to 100.9 CG: 109.3 to 105.3 | -9.3b | |||||
| HDL | IG: 40.3 to 43.6 CG: 44.0 to 45.1 | 2.2b | |||||
| TG | IG: 209.8 to 169.5 CG: 155.9 to 152.6 | -37.0b | |||||
a Negative values indicate IG had greater decrease; positive values indicate CG had greater decrease. For HDL: positive values indicate IG had greater increase; negative values indicate CG had greater increase.
b P value not reported.
c Positive values indicate IG had greater decrease in 10-year CHD risk; negative values indicate CG had greater decrease in 10-year CHD risk.
BNF = British National Formulary; CG = control group; CHD = coronary heart disease; HDL = high-density lipoprotein cholesterol; IG = intervention group; LDL = low-density lipoprotein cholesterol; NR = not reported; NS = not significant; TC = total cholesterol; TG = triglycerides; UKPDS = United Kingdom Prospective Diabetes Study.
Regarding LDL cholesterol, 15 studies reported data on this outcome, and all of them demonstrated a decrease in the intervention group from baseline to final follow-up (Table 3). Twelve studies reported a greater reduction in this outcome in the intervention group compared with the control group. For this parameter, the difference in change between the groups ranged from +7.35 mg dL-1 to -30 mg dL-1 and was reported as statistically significant in only 4 studies (Table 3).35,39,49,53
Among the 12 studies that reported HDL cholesterol as an outcome measure (Table 3), 10 studies described an increase in the intervention group from baseline to final follow-up,35,36,39-41,48,49,55,60,61 1 study observed a decrease,53 and in another study this parameter remained constant.42 Nine studies reported a greater increase in this outcome in the intervention group when compared with the control group. Nevertheless, the difference in change between both groups was shown to be statistically significant in only 1 study (P= 0.020).39 The difference in change between the 2 groups ranged from -5.8 mg dL-1 to +11 mg dL-1.
Finally, 12 studies reported data on triglycerides (Table 3). Eleven of them described a reduction in the intervention group from baseline to final follow-up, while in 1 study, there was an increase in the triglycerides mean value.41 Nine studies reported a greater improvement in this outcome in the intervention group in comparison with the control group. Yet, the difference in change between the 2 groups was reported as statistically significant in only 2 studies (Table 3).39,53 This difference ranged from +12 mg dL-1 to -62 mg dL-1.
For all 4 parameters of the lipid profile, the greater improvement observed in the intervention group compared with the control group is shown in Figure 5A-D for some studies.
FIGURE 5.
Effect of Pharmacist Interventions on Total Cholesterol, Low-Density Lipoprotein Cholesterol, High-Density Lipoprotein Cholesterol, and Triglycerides Compared with Control Group
Body Mass Index.
Fourteen studies described BMI as an outcome measure (Table 3). In all but 2 studies, mean BMI decreased in the intervention group from baseline to final follow-up. These studies also reported a greater reduction in this group in comparison with the control group.26,35,38,41,42,48,49,53,57,59-61 Nevertheless, only 1 study revealed a statistically significant difference in change between the intervention group and the control group (P= 0.005).61 The difference in change between the 2 groups ranged from +0.4 kg m-2 to -2.77 kg m-2.
10-Year CHD Risk.
CHD risk was predicted among study participants in 6 studies (Table 3). The method used to estimate this risk varied between studies. Three studies used the United Kingdom Prospective Diabetes Study (UKPDS) risk engine,36,37,61 1 study used the Framingham prediction method,40 1 study used the British National Formulary prediction charts and the Framingham prediction method,48 and 1 study used an equation specifically validated for the Hong Kong population.49 All 4 models incorporated the variables age, sex, and smoking status.49,62-64 The equation validated for the Hong Kong population also includes the duration of diabetes,49 while the Framingham prediction model considers the presence or absence of diabetes as a variable.63 In addition to the duration of diabetes, the UKPDS risk engine also incorporates the Alc mean values.62 Regarding blood pressure, the UKPDS risk engine and the British National Formulary prediction charts include systolic blood pressure,62,64 while the Framingham prediction model integrates systolic and diastolic blood pressure.63 As for the lipid profile, the UKPDS risk engine and the British National Formulary prediction charts consider the total cholesterol/HDL cholesterol ratio as a variable,62,64 while the Framingham prediction model only includes HDL cholesterol,63 and the equation validated for the Hong Kong population incorporates non-HDL cholesterol.49 In addition to the previously mentioned variables, the UKPDS risk engine also considers ethnicity as a variable,62 and the equation validated for the Hong Kong population integrates glomerular filtration rate and urinary albumin to creatinine ratio.49
All 6 studies recorded a decrease in CHD risk in the intervention group from baseline to final follow-up and reported a greater improvement in this group compared with the control group. In the 3 studies that used the UKPDS risk engine, the 10-year CHD risk decreased 4.8%, 2.7%, and 4.9%, respectively, in the intervention group during the follow-up period. In the 2 studies that used the Framingham prediction method, there was a decrease of 2.9% and 8.0%, respectively, in the intervention group throughout the follow-up period. In comparison with the control group, the difference in change between the 2 groups was reported as statistically significant in only 2 studies (Table 3).36,49 Because the studies used different methods to assess this risk, it is not possible to define a range for the difference in change between the groups across all studies. However, among the studies that used the UKPDS risk engine, the difference in change between the groups ranged from -1.5% to -5.1%, and in the 2 studies that used the Framingham prediction method, this difference was -3.0% and -12.0%, respectively.
Medication Adherence.
Medication adherence was evaluated in 13 studies (Table 4). The methods used to measure this outcome among study participants varied between studies. Self-reported adherence was used as the only method in almost all studies, while 2 studies used pill count or prescription refill rate in combination with self-reported adherence.27,54
TABLE 4.
Studies with Results for Medication Adherence and Health-Related Quality of Life
| Author, Year | Medication Adherence | Health-Related Quality of Life | ||
|---|---|---|---|---|
| Change from Baseline to Final Follow-up | Difference in Change Between Groupsa | Change from Baseline to Final Follow-up | Difference in Change Between Groupsa | |
| Adepu et al. 200747 | NR | – | ADDQoL score IG: significant improvement (P > , 0.001) CG: nonsignificant changeb | – |
| Adepu and Ari 201046 | Brief medication questionnaire score IG: 0.73 to 0.88 (P > 0.001) CG: 1.11 to 0.67 (P = 0.021) | 0.59b | NR | – |
| Adibe et al. 201345 | NR | – | HUI3 total score IG: 0.61 to 0.86 CG: 0.63 to 0.64 | 0.22b |
| Al Mazroui et al. 200948 | Proportion of nonadherent patientsc IG: 48.3% to 21.4% CG: 49.1% to 32.5% | -10.3%b,d | Improvement in all SF-36 domains in IG, for example: general health score IG: 67.8 to 77.6 CG: 66.6 to 69.2 | 7.2b |
| Ali et al. 201241 | NR | – | SF-36 total score IG: 65.61 to 79.09 (P < 0.001) CG: 70.04 to 66.53 (P = 0.145) DQoL total score IG: 29.81 to 23.48 (P = 0.001) CG: 30.52 to 27.87 (P = 0.323) | 17.63b -3.68b,e |
| Chan et al. 201249 | Proportion of doses taken IG: 73.6% to 96.1% CG: 82.1% to 84.1% | 20.5% (P < 0.001) | NR | – |
| Chung et al. 201450 | Malaysian medication adherence scalef IG: 70.0% to 75.0% CG: 64.5% to 58.7% | 10.8%b | NR | – |
| Cohen et al. 201129 | NR | – | SF-36 scoreNo significant changes in either physical health mental health domains in IG | 3.6b -0.3b |
| Fornos et al. 200665 | Modification of the Morisky-Green questionnaireg IG: 0.6 to 0.2 (P < 0.001) CG: 0.8 to 0.9 (P = 0.195) | -0.5d (P < 0.001) | NR | – |
| Grant et al. 200330 | No. of adherent days out of the past 7 days IG: 6.7 to 6.8 CG: 6.9 to 7.0 | 0.0 (P = 0.8) | NR | – |
| Jaber et al. 199631 | NR | – | Health status questionnaire score No significant changes in any domain within or between IG and CG | – |
| Jarab et al. 201253 | Morisky Medication Adherence Scaleh IG: 74.1% to 28.6% CG: 70.9% to 64.6% | -39.2%b,d | NR | – |
| Kjeldsen et al. 201543 | Three self-reported adherence measures: Behavior-related nonadherence (nonintentional)h IG: 68.3% to NR CG: 61.1% to NR Behavior-related nonadherence (intentional, self-regulation)h IG: 22.5% to NR CG: 26.8% to NR Behavior-related nonadherence (intentional, effect-related)h IG: 19.5% to NR CG: 16.5 % to NR No significant changes within or between IG and CG | – | EQ-5D total score IG: 0.782 to 0.842 CG: 0.812 to 0.815 | 0.057b |
| Krass et al. 200726 | NR | – | EQ-5D score: Utility score IG: 0.8 to 0.8 CG: 0.8 to 0.8 Health state scale score IG: 66.3 to 71.6 CG: 72.2 to 73.3 | -0.02 (P = 0.07) 4.2 (P = 0.02) |
| Mahwi and Obied 201354 | Pill count and Morisky Medication Adherence Scaleh,i IG: 77.4% to 19.0% (P < 0.05) CG: NR | – | NR | – |
| Mehuys et al. 201127 | Prescription refill ratej IG: 99.7% CG: 94.7% Self-reported adherencef,k IG: 59.9% to 61.9% CG:64.2% to 61.0% | 5.2%b | NR | – |
| Odegard et al. | Self-reported adherence (2-question recall technique)l | |||
| 200533 | IG: 56% to NR CG: 35% to NR The intervention had no effect on improving adherence during the study period. CG reported better adherence throughout the study. | – | NR | – |
| Ramanath and Santhosh 201156 | Morisky Medication Adherence Scale IG: significant improvement CG: nonsignificant improvement | – | WHOQOL-BREF total score IG: 39.58 to 43.57 (P < 0.05) CG: 40.78 to 37.38b | 7.39b |
| Scott et al. 200635 | NR | – | DQoL total score IG: 262.0 to 286.4 CG: 232.5 to 247.3 | 9.6b |
| Sriram et al. 201157 | NR | – | ADDQoL total score IG: -2.156 to -1.410 (P < 0.01) CG: -1.899 to -1.974 (P < 0.05) | 0.821b |
| Wishah et al. 201460 | Morisky Medication Adherence Scale score IG: 12.7 to 15.8 CG: 13.6 to 12.9 | 3.8b | NR | – |
aPositive values indicate IG had greater increase; negative values indicate CG had greater increase.
bP value not reported.
cPatients who reported forgetting doses and intentionally missing or taking extra doses were classified as nonadherent.
dNegative values indicate IG had greater increase in medication adherence; positive values indicate CG had greater increase in medication adherence.
eNegative values indicate IG had greater increase in HRQol; positive values indicate CG had greater increase in HRQoL.
fProportion of adherent patients.
gNumber of wrong answers per diabetes medication.
hProportion of nonadherent patients.
iData regarding Morisky Medication Adherence Scale only.
jAdherence during the study course.
kAssessed by asking patients "How often do you not take your oral hypoglycaemic medication as prescribed?"
lProportion of patients having difficulty in remembering to take medications as prescribed.
ADDQoL = audit of diabetes-dependent quality of life; CG = control group; DQoL = diabetes quality of life; EQ-5D = EuroQoL-5 dimension; HUI3 = Health Utilities Index Mark 3; IG = intervention group; NR = not reported; SF-36 = Short Form 36; WHOQOL-BREF = World Health Organization Quality of Life-BREF.
Eleven studies revealed an improvement in medication adherence in the intervention group from baseline to final follow-up. In 2 studies that used the same method for the assessment of medication adherence (Morisky Medication Adherence Scale), the proportion of nonadherent patients decreased 45.5% and 58.4%, respectively, in the intervention group during the follow-up period.53,54 In 8 studies, a greater improvement in medication adherence was observed in the intervention group when compared with the control group, but only 2 studies reported a statistically significant difference (Table 4).49,65 Given the wide variability of methods used to measure this outcome and because of the difference in detail of the reported data, it is not possible to define a range for the difference in change between the groups across all studies.
Health-Related Quality of Life.
Eleven studies considered HRQoL as an outcome measure (Table 4). Various tools were used to assess this outcome. Seven studies used generic tools (e.g., the 36-Item Short Form Health Survey and the EuroQoL-5 Dimension questionnaire), which can be applied in different health conditions and diseases.26,29,31,43,45,48,56 Three studies used tools specifically developed for diabetes (e.g., the Audit of Diabetes-Dependent Quality of Life questionnaire and the Diabetes Quality of Life questionnaire),35,47,57 and 1 study used generic and diabetes-specific tools.41
Most studies reported an improvement in HRQoL (overall or subdomain scores) in the intervention group from baseline to final follow-up, which was greater than that observed in the control group. In the studies that used the EuroQoL-5 Dimension questionnaire to assess HRQoL among study patients, the effect was mixed. There was an improvement of 0.06 in the intervention group during the follow-up period in 1 study,43 while there was a decrease of 0.04 in the other study.26 Only 1 study reported a statistically significant difference in change between the intervention group and the control group (P= 0.02).26 Because of the wide variability of tools used to assess this outcome and because of the difference in detail in reporting overall or subdomains scores, it is not possible to define a range for the difference in change between the groups across all studies. However, in the 2 studies that used the EuroQoL-5 Dimension questionnaire, the difference in change between both groups was 0.057 and -0.02, respectively.
Economic Outcomes.
Three studies conducted an economic analysis. Chan et al. (2012) estimated the cost-effectiveness of the pharmacist care program being studied based on CHD risk reduction and the direct cost of time spent by the pharmacist in counseling and associated administrative work.49 The estimated potential saving in costs was $5,086.30 USD per patient.49 Adibe et al. (2013) conducted a cost-utility analysis of the pharmaceutical care intervention implemented.66 The total cost per patient per year was $326.00 USD for the control group and $394.00 USD for the intervention group (P=0.1009).66 In addition, quality-adjusted life-year (QALY) per patient per year was 0.64 for the control group and 0.76 for the intervention group (P < 0.0001).66 Thus, the authors found that the intervention led to an incremental cost of $69.00 USD and an incremental effect of 0.12 QALY gained, with an associated incremental cost-utility ratio of $571.00 USD per QALY gained, which showed that the intervention was very cost-effective.66 Simpson et al. (2015) also conducted a cost-effectiveness analysis for the pharmacist intervention being studied.67 The authors found that the total cost per patient per year was $190.00 Canadian Dollars (CAD; $144.02 USD) lower in the intervention group compared with the control group and that the intervention group had a 0.26% greater reduction in the annualized risk of cardiovascular event in comparison with the control group.67 The cost-effectiveness analysis showed that at a societal willingness-to-pay of $4,000.00 CAD ($3,025.95 USD) per 1% reduction in annual cardiovascular risk, the probability that the intervention was cost-effective compared with usual care reached 95%.67
Discussion
This systematic review examined randomized controlled trials evaluating the effectiveness of pharmacist interventions in the management of patients with type 2 diabetes. It included 36 studies involving 5,761 participants. The studies were conducted in various countries and took place in different health care facilities.
Evidence from the included studies suggests that pharmacist interventions directed at patients with type 2 diabetes can have a positive impact on clinical outcomes, as demonstrated by the reduction in Alc, blood glucose, blood pressure, and BMI and by the improvement in the lipid profile observed in the intervention group during the follow-up period in almost all studies. When compared with the control group, the effect of pharmacist interventions on these outcomes was shown to be greater in the intervention group in most studies, some of which demonstrated that this difference in change between both groups was statistically significant. The failure to reach a statistically significant difference in all studies may be explained by several factors, such as small sample size, short follow-up duration, cross-contamination between patients in the intervention group and those in the control group, difference in the statistical tests used to perform the statistical analysis (paired-samples or independent-samples tests), and presence of a statistical difference between the baseline values of both study groups.
Metabolic Control
Our findings are in accordance with those of other systematic reviews on the effectiveness of pharmacist interventions in the management of diabetes. Wubben et al. (2008) showed that in 15 out of 18 studies there was a greater improvement in Alc in the intervention group compared with the control group and the difference in change between both groups ranged from +0.2 to -2.1%21—this range is almost identical to the range defined for Alc in the present review. Regarding blood pressure, the systematic review conducted by Santschi et al. (2012) revealed that in comparison with the control group, 7 out of 12 (58.3%) studies demonstrated a statistically significant greater reduction in systolic blood pressure in the intervention group, and 3 out of 9 (33.3%) studies reported a statistically significant greater decrease in diastolic blood pressure20—these proportions are also similar to those found in the present review. As for lipid profiles, Wubben et al. reported that most studies found decreases in LDL cholesterol and triglycerides but did not find statistically significant differences in change between the intervention group and the control group,21 which is in accordance with what is reported in the present review.
Cardiovascular Control
The effects verified in some of the clinical outcomes previously mentioned might, in turn, have contributed to a decrease in the 10-year CHD risk, since the models used to assess this risk incorporate some of these outcomes as variables (e.g., systolic blood pressure and LDL cholesterol). In fact, in the studies that estimated the 10-year CHD risk, the decrease observed in the intervention group during the follow-up period was accompanied by an improvement in those outcomes that were analyzed in this systematic review and that are also considered as variables in the different risk assessment models. However, the evidence regarding this long-term outcome is limited by the small number of studies that predicted this risk among study participants. This was also noted in another systematic review evaluating the effects of pharmacist interventions on patients with diabetes, in which only 1 out of 21 studies estimated this outcome.21
The positive effects detected in some cardiovascular risk factors, such as those observed in blood pressure and lipid profile in the intervention group in several studies, are of great importance because cardiovascular disease is about twice more frequent in diabetic patients compared with people without diabetes, and its presence is associated with increased mortality, as revealed in a meta-analysis conducted by the Emerging Risk Factors Collaboration group (2010).68 Also important is the beneficial effect of pharmacist interventions on Alc and blood glucose seen in many studies, given that improving glycemic control is a key strategy to reduce the risk of microvascular complications associated with diabetes.8 Also concerning Alc, the difference in its decrease of 1% or greater between the intervention group and the control group observed in several studies is clinically relevant. Indeed, it was previously demonstrated by Stratton et al. (2000) that a 1% Alc reduction is linked to an estimated 14% reduction of the risk of myocardial infarction, an estimated 12% reduction of the risk of stroke, and an estimated 16% reduction of the risk of heart failure.1 Thus, the improvement observed in Alc in the intervention group in some studies may also contribute to the prevention of macrovascular complications.
Adherence and HRQol
Regarding medication adherence, in most of the included studies, the direction of the effect was in favor of the pharmacist interventions, which is similar to what was found in 2 previously published systematic reviews that analyzed the effect of pharmacist interventions on this outcome.22,23 These findings suggest that pharmacists, through their interventions, may play an essential role in enhancing adherence to prescribed medications among patients with type 2 diabetes, which, in turn, may have a beneficial effect on treatment outcomes. In fact, in some studies that evaluated this outcome, the increase in medication adherence observed in the intervention group during the follow-up period was accompanied by an improvement in other outcomes, such as Alc, blood pressure, and lipid profile. However, it should be borne in mind that the method most frequently used to measure this outcome (self-reported adherence) might overestimate adherence.69,70
As for HRQoL, most of the included studies demonstrated an improvement in overall or subdomain scores among the patients of the intervention groups. The lack of significant improvements observed in some studies might be because there is no tool for measuring quality of life that is specifically designed for use in pharmaceutical care, and the existing tools might not have enough sensitivity to detect the subtle changes on HRQoL that may result from pharmaceutical care.71 Compared with a previous systematic review evaluating the effectiveness of pharmacist interventions in type 2 diabetes that also included HRQoL as an outcome measure, the findings from the present review are more powerful, since it included 11 studies that reported data on this outcome, while the other review only included 1 study,23 which is among our included studies.
Cost-effectiveness
The evidence regarding the cost-effectiveness of pharmacist interventions was limited. In fact, only 3 studies conducted an economic analysis. This is in accordance with the findings from the other 2 systematic reviews that evaluated the effects of pharmacist interventions on patients with diabetes, in which a small proportion of studies (2 out of 21 studies and 1 out of 8 studies, respectively) assessed the cost-effectiveness of the interventions under study.21,23 However, given the current resource restraints in the health care systems, and in order to inform policymakers and influence their decisions towards widespread implementation of pharmacist interventions on the management of type 2 diabetes, cost-utility studies proving the cost-effectiveness of such interventions are of the utmost importance. Indeed, a comprehensive evaluation of pharmaceutical services has to consider clinical and humanistic outcomes, as well as economic outcomes (ECHO approach).72
The pharmacist interventions being studied encompassed a variety of activities related to nonpharmacological and pharmacological issues, such as education on lifestyle modification and medication review. The type of interventions delivered by the pharmacists in each study reflects in part the difference in roles played by pharmacists within the health care systems in different countries. Because pharmacist interventions in the included studies comprised different elements, it is difficult to pinpoint which elements contributed the most for the observed effects. Thus, further research is needed to compare the effect of the different intervention elements on outcome measures in order to identify the most effective and practical approach.
Limitations
This review presents some limitations that are discussed as follows. First, some included studies did not report their outcome data in sufficient detail so that the data could be used in our data synthesis, and the respective authors were not contacted in an attempt to obtain the missing data. However, in order to prevent this from happening in future systematic reviews, study authors should prepare their publications according to reporting guidelines, such as the Consolidated Standards of Reporting Trials (CONSORT) Statement.73 Second, this review included studies that took place in different settings and that evaluated the effectiveness of different types of interventions, which increased the level of heterogeneity of the results. Third, the evidence regarding some of the outcomes under study was limited by the small number of included studies that reported them (e.g., 10-year CHD risk and economic outcomes). Fourth, for some outcomes, such as medication adherence and HRQoL, the included studies used several tools for assessment, which prevented us from directly comparing the effect of pharmacist interventions on these outcomes across all studies. Fifth, since the method most frequently used to ascertain medication adherence was self-reported adherence, there might have been an overestimation of the effect of pharmacist interventions on this outcome. Therefore, future studies should consider the use of more accurate methods in the assessment of medication adherence (e.g., drug assays of blood or urine), in order to provide more precise evidence regarding the effectiveness of pharmacist intervention on this outcome among patients with type 2 diabetes.
Finally, although, overall, the findings from this review are encouraging, it should be borne in mind that the included studies presented some weaknesses concerning methodological quality, as assessed by the Cochrane risk of bias tool. Of note, some types of risk of bias (e.g., allocation concealment and blinding of outcome assessment) were classified as “unclear” in a large proportion of studies, given that there was no sufficient information in the publications to classify them precisely. Thus, future studies should take this limitation into consideration and provide information that is as complete and detailed as possible in their publications, so that their risk of bias can be assessed more accurately.
Conclusions
This systematic review provides evidence that pharmacist interventions can have a positive influence on metabolic control, medication adherence, and HRQol of patients with type 2 diabetes. These promising findings support the involvement of pharmacists as members of a health care team in the management of this patient population.
A considerable amount of data has been gathered in this review concerning various outcomes, which may make it possible to conduct a meta-analysis in the near future, by selecting data on some outcomes from a more homogeneous subset of studies included in this review.
Future studies evaluating the effectiveness of pharmacist interventions in the management of type 2 diabetes should include clinical, humanistic, and economic outcomes. Additionally, when assessing some particular outcomes (e.g., medication adherence) among study participants, studies should preferably use the most accurate methods in order to provide more reliable evidence regarding the effect of the intervention being studied on those outcomes.
Further research is also needed to evaluate which intervention elements contribute the most for the observed effects. It would also be of great value to concentrate efforts on building standard, well-validated tools to ascertain certain outcomes, such as HRQoL, so that data from different studies concerning these outcomes can be analyzed together.
APPENDIX. Search Strategy
PubMed
Diabetes mellitus, type 2[mh] (87.255)
Type 2 diabetes (113.885)
T2DM (7.760)
Non insulin dependent diabetes mellitus (106.016)
NIDDM (96.382)
1 OR 2 OR 3 OR 4 OR 5 (125.207)
Pharmaceutical services[mh] (50.073)
Pharmaceutical care (69.689)
Clinical pharmacy (44.165)
Community pharmacy (15.465)
Pharmacist* (25.127)
7 OR 8 OR 9 OR 10 OR 11 (124.573)
Randomized controlled trial[pt] (380.924)
Random* AND Control* (663.250)
13 OR 14 (663.264)
6 AND 12 AND 15 (278)
Cochrane Central Register of Controlled Trials
[mh “Diabetes mellitus, type 2”] (9.054)
Type 2 diabetes (19.141)
T2DM (1.225)
Non insulin dependent diabetes mellitus (5.281)
NIDDM (1.093)
1 OR 2 OR 3 OR 4 OR 5 (20.135)
[mh “Pharmaceutical services”] (1.322)
Pharmaceutical care (3.551)
Clinical pharmacy (7.797)
Community pharmacy (1.336)
Pharmacist* (2.769)
7 OR 8 OR 9 OR 10 OR 11 (12.439)
6 AND 12 (254)
Web of Science
ts = Type 2 diabetes (351.632)
ts = T2DM (19.524)
ts = Non insulin dependent diabetes mellitus (29.057)
ts = NIDDM (24.822)
1 OR 2 OR 3 OR 4 (375.234)
ts = Pharmaceutical services (23.487)
ts = Pharmaceutical care (39.352)
ts = Clinical pharmacy (19.468)
ts = Community pharmacy (15.019)
ts = Pharmacist* (57.991)
6 OR 7 OR 8 OR 9 OR 10 (118.778)
ts = (Random* AND Control*) (1.260.847)
5 AND 11 AND 12 (175)
REFERENCES
- 1.Stratton IM, Adler AI, Neil HA, et al. Association of glycaemia with macrovascular and microvascular complications of type 2 diabetes (UKPDS 35): prospective observational study. BMJ. 2000;321(7258):405-12. [DOI] [PMC free article] [PubMed] [Google Scholar]
- 2.Wu Y, Ding Y, Tanaka Y, Zhang W. Risk factors contributing to type 2 diabetes and recent advances in the treatment and prevention. Int J Med Sci. 2014;11(11):1185-200. [DOI] [PMC free article] [PubMed] [Google Scholar]
- 3.Huang ES, Brown SE, Ewigman BG, Foley EC, Meltzer DO. Patient perceptions of quality of life with diabetes-related complications and treatments. Diabetes Care. 2007;30(10):2478-83. [DOI] [PMC free article] [PubMed] [Google Scholar]
- 4.Solli O, Stavem K, Kristiansen IS. Health-related quality of life in diabetes: the associations of complications with EQ-5D scores. Health Qual Life Outcomes. 2010;8:18. [DOI] [PMC free article] [PubMed] [Google Scholar]
- 5.Wexler DJ, Grant RW, Wittenberg E, et al. Correlates of health-related quality of life in type 2 diabetes. Diabetologia. 2006;49(7):1489-97. [DOI] [PubMed] [Google Scholar]
- 6.International Diabetes Federation. IDF Diabetes Atlas. 7th ed. Brussels, Belgium: International Diabetes Federation. 2015. Available at: http://www.idf.org/diabetesatlas. Accessed March 14, 2016. [Google Scholar]
- 7.Collins R, Armitage J, Parish S, Sleigh P, Peto R; Heart Protection Study Collaborative Group. MRC/BHF Heart Protection Study of cholesterol-lowering with simvastatin in 5963 people with diabetes: a randomised placebo-controlled trial. Lancet. 2003;361(9374):2005-16. [DOI] [PubMed] [Google Scholar]
- 8.UK Prospective Diabetes Study (UKPDS) Group. Intensive blood-glucose control with sulphonylureas or insulin compared with conventional treatment and risk of complications in patients with type 2 diabetes (UKPDS 33). Lancet. 1998;352(9131):837-53. [PubMed] [Google Scholar]
- 9.UK Prospective Diabetes Study Group. Tight blood pressure control and risk of macrovascular and microvascular complications in type 2 diabetes: UKPDS 38. BMJ. 1998;317(7160):703-13. [PMC free article] [PubMed] [Google Scholar]
- 10.Charpentier G, Genes N, Vaur L, et al. Control of diabetes and cardiovascular risk factors in patients with type 2 diabetes: a nationwide French survey. Diabetes Metab. 2003;29(2 Pt 1):152-58`. [DOI] [PubMed] [Google Scholar]
- 11.Eliasson B, Cederholm J, Nilsson P, Gudbjornsdottir S; Steering Committee of the Swedish National Diabetes Register. The gap between guidelines and reality: type 2 diabetes in a National Diabetes Register 1996-2003. Diabet Med. 2005;22(10):1420-26. [DOI] [PubMed] [Google Scholar]
- 12.Kemp TM, Barr EL, Zimmet PZ, et al. Glucose, lipid, and blood pressure control in Australian adults with type 2 diabetes: the 1999-2000 AusDiab. Diabetes Care. 2005;28(6):1490-92. [DOI] [PubMed] [Google Scholar]
- 13.Debussche X. Is adherence a relevant issue in the self-management education of diabetes? A mixed narrative review. Diabetes Metab Syndr Obes. 2014;7:357-67. [DOI] [PMC free article] [PubMed] [Google Scholar]
- 14.Nam S, Chesla C, Stotts NA, Kroon L, Janson SL. Barriers to diabetes management: patient and provider factors. Diabetes Res Clin Pract. 2011;93(1):1-9. [DOI] [PubMed] [Google Scholar]
- 15.Vermeire E, Hearnshaw H, Van Royen P, Denekens J. Patient adherence to treatment: three decades of research. A comprehensive review. J Clin Pharm Ther. 2001;26(5):331-42. [DOI] [PubMed] [Google Scholar]
- 16.American College of Clinical Pharmacy, Hume AL, Kirwin J, et al. Improving care transitions: current practice and future opportunities for pharmacists. Pharmacotherapy. 2012;32(11):e326-37. [DOI] [PubMed] [Google Scholar]
- 17.Nichols-English GJ, Provost M, Koompalum D, Chen H, Athar M. Strategies for pharmacists in the implementation of diabetes mellitus management programs: new roles in primary and collaborative care. Dis Manag Health Outcomes. 2002;10(12):783-803. [Google Scholar]
- 18.American Diabetes Association. Standards of medical care in diabetes−2015. Diabetes Care. 2015;38(Suppl 1):S1-93. Available at: http://care.diabetesjournals.org/content/38/Supplement_1. Accessed March 16, 2016. [PubMed] [Google Scholar]
- 19.Hepler CD, Strand LM. Opportunities and responsibilities in pharmaceutical care. Am J Hosp Pharm. 1990;47(3):533-43. [PubMed] [Google Scholar]
- 20.Santschi V, Chiolero A, Paradis G, Colosimo AL, Burnand B. Pharmacist interventions to improve cardiovascular disease risk factors in diabetes: a systematic review and meta-analysis of randomized controlled trials. Diabetes Care. 2012;35(12):2706-17. [DOI] [PMC free article] [PubMed] [Google Scholar]
- 21.Wubben DP, Vivian EM. Effects of pharmacist outpatient interventions on adults with diabetes mellitus: a systematic review. Pharmacotherapy. 2008;28(4):421-36. [DOI] [PubMed] [Google Scholar]
- 22.Antoine SL, Pieper D, Mathes T, Eikermann M. Improving the adherence of type 2 diabetes mellitus patients with pharmacy care: a systematic review of randomized controlled trials. BMC Endocr Disord. 2014;14:53. [DOI] [PMC free article] [PubMed] [Google Scholar]
- 23.Omran D, Guirguis LM, Simpson SH. Systematic review of pharmacist interventions to improve adherence to oral antidiabetic medications in people with type 2 diabetes. Can J Diabetes. 2012;36(5):292-99. [Google Scholar]
- 24.Cochrane Consumers and Communication Review Group. Data extraction template. 2015. Available at: http://cccrg.cochrane.org/author-resources. Accessed March 16, 2016.
- 25.Higgins JP, Altman DG, Gotzsche PC, et al. The Cochrane Collaboration’s tool for assessing risk of bias in randomised trials. BMJ. 2011;343:d5928. [DOI] [PMC free article] [PubMed] [Google Scholar]
- 26.Krass I, Armour CL, Mitchell B, et al. The Pharmacy Diabetes Care Program: assessment of a community pharmacy diabetes service model in Australia. Diabet Med. 2007;24(6):677-83. [DOI] [PubMed] [Google Scholar]
- 27.Mehuys E, Van Bortel L, De Bolle L, et al. Effectiveness of a community pharmacist intervention in diabetes care: a randomized controlled trial. J Clin Pharm Ther. 2011;36(5):602-13. [DOI] [PubMed] [Google Scholar]
- 28.Choe HM, Mitrovich S, Dubay D, Hayward RA, Krein SL, Vijan S. Proactive case management of high-risk patients with type 2 diabetes mellitus by a clinical pharmacist: a randomized controlled trial. Am J Manag Care. 2005;11(4):253-60. [PubMed] [Google Scholar]
- 29.Cohen LB, Taveira TH, Khatana SA, Dooley AG, Pirraglia PA, Wu WC. Pharmacist-led shared medical appointments for multiple cardiovascular risk reduction in patients with type 2 diabetes. Diabetes Educ. 2011;37(6): 801-12. [DOI] [PubMed] [Google Scholar]
- 30.Grant RW, Devita NG, Singer DE, Meigs JB. Improving adherence and reducing medication discrepancies in patients with diabetes. Ann Pharmacother. 2003;37(7-8):962-69. [DOI] [PubMed] [Google Scholar]
- 31.Jaber LA, Halapy H, Fernet M, Tummalapalli S, Diwakaran H. Evaluation of a pharmaceutical care model on diabetes management. Ann Pharmacother. 1996;30(3):238-43. [DOI] [PubMed] [Google Scholar]
- 32.Jacobs M, Sherry PS, Taylor LM, Amato M, Tataronis GR, Cushing G. Pharmacist Assisted Medication Program Enhancing the Regulation of Diabetes (PAMPERED) study. J Am Pharm Assoc (2003). 2012;52(5):613-21. [DOI] [PubMed] [Google Scholar]
- 33.Odegard PS, Goo A, Hummel J, Williams KL, Gray SL. Caring for poorly controlled diabetes mellitus: a randomized pharmacist intervention. Ann Pharmacother. 2005;39(3):433-40. [DOI] [PubMed] [Google Scholar]
- 34.Rothman RL, Malone R, Bryant B, et al. A randomized trial of a primary care-based disease management program to improve cardiovascular risk factors and glycated hemoglobin levels in patients with diabetes. Am J Med. 2005;118(3):276-84. [DOI] [PubMed] [Google Scholar]
- 35.Scott DM, Boyd ST, Stephan M, Augustine SC, Reardon TP. Outcomes of pharmacist-managed diabetes care services in a community health center. Am J Health Syst Pharm. 2006;63(21):2116-22. [DOI] [PubMed] [Google Scholar]
- 36.Simpson SH, Majumdar SR, Tsuyuki RT, Lewanczuk RZ, Spooner R, Johnson JA. Effect of adding pharmacists to primary care teams on blood pressure control in patients with type 2 diabetes: a randomized controlled trial. Diabetes Care. 2011;34(1):20-26. [DOI] [PMC free article] [PubMed] [Google Scholar]
- 37.Taveira TH, Dooley AG, Cohen LB, Khatana SA, Wu WC. Pharmacist-led group medical appointments for the management of type 2 diabetes with comorbid depression in older adults. Ann Pharmacother. 2011;45(11):1346-55. [DOI] [PubMed] [Google Scholar]
- 38.Taveira TH, Friedmann PD, Cohen LB, et al. Pharmacist-led group medical appointment model in type 2 diabetes. Diabetes Educ. 2010;36(1):109-17. [DOI] [PubMed] [Google Scholar]
- 39.Mourao AO, Ferreira WR, Martins MA, et al. Pharmaceutical care program for type 2 diabetes patients in Brazil: a randomised controlled trial. Int J Clin Pharm. 2013;35(1):79-86. [DOI] [PubMed] [Google Scholar]
- 40.Plaster CP, Melo DT, Boldt V, et al. Reduction of cardiovascular risk in patients with metabolic syndrome in a community health center after a pharmaceutical care program of pharmacotherapy follow-up. Braz J Pharm Sci. 2012;48(3):435-46. [Google Scholar]
- 41.Ali M, Schifano F, Robinson P, et al. Impact of community pharmacy diabetes monitoring and education programme on diabetes management: a randomized controlled study. Diabet Med. 2012;29(9):e326-33. [DOI] [PubMed] [Google Scholar]
- 42.Fornos JA, Andres NF, Andres JC, Guerra MM, Egea B. A pharmacotherapy follow-up program in patients with type-2 diabetes in community pharmacies in Spain. Pharm World Sci. 2006;28(2):65-72. [DOI] [PubMed] [Google Scholar]
- 43.Kjeldsen LJ, Bjerrum L, Dam P, Larsen BO, Rossing C, Søndergaard B. Safe and effective use of medicines for patients with type 2 diabetes: a randomized controlled trial of two interventions delivered by local pharmacies. Res Social Adm Pharm. 2015;11(1):47-62. [DOI] [PubMed] [Google Scholar]
- 44.Sarkadi A, Rosenqvist U. Experience-based group education in type 2 diabetes: a randomised controlled trial. Patient Educ Couns. 2004;53(3):291-98. [DOI] [PubMed] [Google Scholar]
- 45.Adibe MO, Ukwe CV, Aguwa CN. The impact of pharmaceutical care intervention on the quality of life of Nigerian patients receiving treatment for type 2 diabetes. Value Health Reg Issues. 2013;2(2):240-47. [DOI] [PubMed] [Google Scholar]
- 46.Adepu R, Ari SM. Influence of structured patient education on therapeutic outcomes in diabetes and hypertensive patients. Asian J Pharm Clin Res. 2010;3(3):174-78. [Google Scholar]
- 47.Adepu R, Rasheed A, Nagavi B. Effect of patient counseling on quality of life in type-2 diabetes mellitus patients in two selected South Indian community pharmacies: a study. Indian J Pharm Sci. 2007;69(4):519-24. [Google Scholar]
- 48.Al Mazroui NR, Kamal MM, Ghabash NM, Yacout TA, Kole PL, McElnay JC. Influence of pharmaceutical care on health outcomes in patients with type 2 diabetes mellitus. Br J Clin Pharmacol. 2009;67(5):547-57. [DOI] [PMC free article] [PubMed] [Google Scholar]
- 49.Chan CW, Siu SC, Wong CK, Lee VW. A pharmacist care program: positive impact on cardiac risk in patients with type 2 diabetes. J Cardiovasc Pharmacol Ther. 2012;17(1):57-64. [DOI] [PubMed] [Google Scholar]
- 50.Chung WW, Chua SS, Lai PS, Chan SP. Effects of a pharmaceutical care model on medication adherence and glycemic control of people with type 2 diabetes. Patient Prefer Adherence. 2014;8:1185-94. [DOI] [PMC free article] [PubMed] [Google Scholar]
- 51.Farsaei S, Sabzghabaee AM, Zargarzadeh AH, Amini M. Effect of pharmacist-led patient education on glycemic control of type 2 diabetics: a randomized controlled trial. J Res Med Sci. 2011;16(1):43-49. [PMC free article] [PubMed] [Google Scholar]
- 52.Ghosh S, Rajvanshi AK, Kishun S. Assessment the influence of patient counseling on quality of life in type-II diabetes mellitus patients. Int J Pharma Bio Sci. 2010;1(3):1-6. [Google Scholar]
- 53.Jarab AS, Alqudah SG, Mukattash TL, Shattat G, Al-Qirim T. Randomized controlled trial of clinical pharmacy management of patients with type 2 diabetes in an outpatient diabetes clinic in Jordan. J Manag Care Pharm. 2012;18(7):516-26. Available at: http://www.jmcp.org/doi/abs/10.18553/jmcp.2012.18.7.516. [DOI] [PMC free article] [PubMed] [Google Scholar]
- 54.Mahwi TO, Obied KA. Role of the pharmaceutical care in the management of patients with type 2 diabetes mellitus. Int J Pharm Sci Res. 2013;4(4):1363-69. [Google Scholar]
- 55.Malathy R, Narmadha M, Ramesh S, Alvin JM, Dinesh BN. Effect of a diabetes counseling programme on knowledge, attitude and practice among diabetic patients in Erode district of South India. J Young Pharm. 2011;3(1):65-72. [DOI] [PMC free article] [PubMed] [Google Scholar]
- 56.Ramanath KV, Santhosh YL. Impact of clinical pharmacist provided patient education on QOL outcome in type II diabetes mellitus in rural population. Asian J Pharm Clin Res. 2011;4(4):15-20. [Google Scholar]
- 57.Sriram S, Chack LE, Ramasamy R, Ghasemi A, Ravi TK, Sabzghabaee AM. Impact of pharmaceutical care on quality of life in patients with type 2 diabetes mellitus. J Res Med Sci. 2011;16(Suppl 1):S412-18. [PMC free article] [PubMed] [Google Scholar]
- 58.Suppapitiporn S, Chindavijak B, Onsanit S. Effect of diabetes drug counseling by pharmacist, diabetic disease booklet and special medication containers on glycemic control of type 2 diabetes mellitus: a randomized controlled trial. J Med Assoc Thai. 2005;88(Suppl 4):S134-41. [PubMed] [Google Scholar]
- 59.Venkatesan R, Devi AS, Parasuraman S, Sriram S. Role of community pharmacists in improving knowledge and glycemic control of type 2 diabetes. Perspect Clin Res. 2012;3(1):26-31. [DOI] [PMC free article] [PubMed] [Google Scholar]
- 60.Wishah RA, Al-Khawaldeh OA, Albsoul AM. Impact of pharmaceutical care interventions on glycemic control and other health-related clinical outcomes in patients with type 2 diabetes: randomized controlled trial. Diabetes Metab Syndr. 2015;9(4):271-76. [DOI] [PubMed] [Google Scholar]
- 61.Clifford RM, Davis WA, Batty KT, Davis TM. Effect of a pharmaceutical care program on vascular risk factors in type 2 diabetes: the Fremantle Diabetes Study. Diabetes Care. 2005;28(4):771-76. [DOI] [PubMed] [Google Scholar]
- 62.Stevens RJ, Kothari V, Adler AI, Stratton IM; United Kingdom Prospective Diabetes Study Group. The UKPDS risk engine: a model for the risk of coronary heart disease in Type II diabetes (UKPDS 56). Clin Sci (Lond). 2001;101(6):671-79. [PubMed] [Google Scholar]
- 63.Wilson PW, D’Agostino RB, Levy D, Belanger AM, Silbershatz H, Kannel WB. Prediction of coronary heart disease using risk factor categories. Circulation. 1998;97(18):1837-47. [DOI] [PubMed] [Google Scholar]
- 64.Wood D, De Backer G, Faergeman O, Graham I, Mancia G, Pyorala K. Prevention of coronary heart disease in clinical practice: recommendations of the Second Joint Task Force of European and other Societies on Coronary Prevention. Atherosclerosis. 1998;140(2):199-270. [DOI] [PubMed] [Google Scholar]
- 65.Rodríguez NFA, Pérez JAF, Iglesias JCA. Valoración del conocimiento/cumplimiento en un programa de seguimiento farmacoterapéutico en diabéticos tipo 2 en farmacia comunitaria: estudio aleatorizado. Pharm Care Esp. 2007;9(1):2-9. [Google Scholar]
- 66.Adibe MO, Aguwa CN, Ukwe CV. Cost-utility analysis of pharmaceutical care intervention versus usual care in management of Nigerian patients with type 2 diabetes. Value Health Reg Issues. 2013;2(2):189-98. [DOI] [PubMed] [Google Scholar]
- 67.Simpson SH, Lier DA, Majumdar SR, et al. Cost-effectiveness analysis of adding pharmacists to primary care teams to reduce cardiovascular risk in patients with type 2 diabetes: results from a randomized controlled trial. Diabet Med. 2015;32(7):899-906. [DOI] [PubMed] [Google Scholar]
- 68.Emerging Risk Factors Collaboration, Sarwar N, Gao P, et al. Diabetes mellitus, fasting blood glucose concentration, and risk of vascular disease: a collaborative meta-analysis of 102 prospective studies. Lancet. 2010;375(9733):2215-22. [DOI] [PMC free article] [PubMed] [Google Scholar]
- 69.Gonzalez JS, Schneider HE, Wexler DJ, et al. Validity of medication adherence self-reports in adults with type 2 diabetes. Diabetes Care. 2013;36(4):831-37. [DOI] [PMC free article] [PubMed] [Google Scholar]
- 70.Osterberg L, Blaschke T. Adherence to medication. N Engl J Med. 2005;353(5):487-97. [DOI] [PubMed] [Google Scholar]
- 71.Kheir NM, van Mil JW, Shaw JP, Sheridan JL. Health-related quality of life measurement in pharmaceutical care. Targeting an outcome that matters. Pharm World Sci. 2004;26(3):125-28. [DOI] [PubMed] [Google Scholar]
- 72.Kozma CM, Reeder CE, Schulz RM. Economic, clinical, and humanistic outcomes: a planning model for pharmacoeconomic research. Clin Ther. 1993;15(6):1121-32. [PubMed] [Google Scholar]
- 73.Schulz KF, Altman DG, Moher D; CONSORT Group. CONSORT 2010 statement: updated guidelines for reporting parallel group randomised trials. BMJ. 2010;340:c332. [DOI] [PMC free article] [PubMed] [Google Scholar]