

Abstract
BACKGROUND:
Despite the favorable efficacy, safety, and cost-effectiveness profile of bisphosphonate (BIS) treatment for osteoporosis (OP), patient compliance remains suboptimal. A longer follow-up period could help to better characterize patient behavior as well as the predictors of noncompliance because of the extended durations of osteoporosis and time to a fracture.
OBJECTIVE:
To determine health care outcomes associated with compliance and noncompliance to BIS therapy in women diagnosed with OP.
METHODS:
This retrospective claims study focused on women with OP, who were aged 55 years and older and using oral BIS treatment. Patients were identified within the HealthCore Integrated Research Environment (HIRE) between January 1, 2007, through June 30, 2010. Patients were required to have ≥ 12 months of pre-index eligibility and ≥ 24 months of post-index health plan eligibility. Post-index eligibility was split into 2 periods: (1) the compliance time period (the first 12-month post-index period, in which compliance was determined) and (2) the cost and consequences time period (13- to 24-month post-index period during which time health care resource utilization, cost, and outcomes were assessed). Noncompliance was defined as medical possession ratio (MPR) < 70%. Descriptive statistics described outcome variables for the study population. A logistic regression model determined variables predictive of compliance. Further, a generalized linear model was used to examine associations between all-cause or OP-related medical/total costs and to estimate health care utilization.
RESULTS:
Of patients overall (N = 27,905), 59% were noncompliant, and 62% discontinued medication. Among noncompliant patients, 6.7% switched BIS therapy (after 64 days average); 97% discontinued (87 days average); and 21% restarted medication (218 days average). Of noncompliant patients, 14% had > 1 inpatient visits; 16% had >1 emergency room visits; 94% had >1 outpatient visits; and 95% had > 1 office visits. Logistic regression results indicated that under aged 65 years (P = 0.012) predicted noncompliance. Relative to the compliant group, noncompliant patients had higher fracture rates at post-index second year, 3.3% vs. 2.4%, and combined second and third years, 6.0% vs. 4.8%, respectively. Compared with noncompliant patients, compliant patients had 9% (P = 0.007) lower OP-related costs, 3% lower all-cause costs during the second post-index year, and 11% (P = 0.016) lower OP-related costs. Mean 13- to 24-month post-index period all-cause costs were $7,237 for noncompliant patients versus $6,758 for compliant patients (P = 0.008).
CONCLUSIONS:
These results indicate high noncompliance rates in this population of older females. OP medication compliance was associated with lower fracture rates, OP- and all-cause costs, and health care utilization. These findings highlight the financial implications and treatment outcomes of BIS medication noncompliance within a female osteoporotic population.
What is already known about this subject
Prescription medications, especially bisphosphonates, have favorable efficacy, safety, and cost-effectiveness for the treatment of osteoporosis (OP).
Bisphosphonate treatment compliance remains poor among OP patients, despite the availability of safe and efficacious treatments and expanding patient education efforts.
What this study adds
This study provided additional confirmation of the overall expectation that patient compliance to OP therapy in real-world settings would approximate the suboptimal levels previously reported in the literature.
This study employed a longer follow-up period than several prior analyses that investigated this research question. This is advantageous because patients can be on osteoporotic therapy for several years, and the time to fracture may also take a number of years.
Notably, our logistic regression modeling demonstrated that an important indicator of noncompliance was being under aged 65 years.
Osteoporosis (OP) is a commonly occurring and painful bone disease that is associated with degradations in bone architecture, mass, density, and strength and with heightened fracture risk, especially in the hip, spine, and wrist.1-3 The National Osteoporosis Foundation has estimated that more than 10 million Americans, predominantly women, have OP, with another 33.6 million at risk for the disease because of low bone density.1,4 Hip fractures alone are associated with annual increases in mortality ranging from 8.4% to 36%5 and a 2.5-fold increase in future fractures.6 About one-fifth of the patients recovering from hip fracture require long-term nursing home care; only 40% regain their pre-fracture functionality and independence.1,2 In the United States, osteoporotic fractures impose serious economic burdens that include more than 432,000 hospital admissions, 2.5 million clinician office visits, approximately 180,000 nursing home admissions, and costs amounting to $17 billion (most recent, 2005), annually.1,2,7 The U.S. Surgeon General projects that the health care burden attributable to OP will increase 2- to 3-fold by the year 2040 because of the aging U.S. population.1
Treatment modalities include over-the-counter (OTC) preparations, diet, exercise, and other lifestyle changes and prescription pharmaceuticals.1 Available prescription drug options for preventing or treating OP include bisphosphonates (BIS)—risedronate, alendronate, ibandronate, and zoledronic acid—calcitonin, estrogen/hormone therapy, estrogen agonist/antagonist (raloxifene), and parathyroid hormones such as teriparatide.1 Thinning bones, a natural accompaniment of the aging process, may be forestalled by early therapy to reduce bone loss. Other treatment goals include the prevention of broken bones, the retention and maintenance of bone density, relieving pain from fractures and other bone changes, and the maintenance of physical function.1
Studies indicating favorable efficacy, safety, and cost-effectiveness of prescription medications, especially BIS, for OP treatment are well represented in the literature.1,8-11 Still, treatment compliance among patients with OP remains poor.12-15 Huybrechts et al. (2006) reported less than 80% medication possession ratio (MPR) rates for three-fourths of a group of 66-year-old managed care enrollees (N = 38,120) followed for an average of 1.7 years; fracture rates increased 17%.13 In a 24-month study with 35,537 osteoporotic women, Siris et al. (2006) reported refill compliance rates of 43% during the study and only 20% at the end of the study; fracture rates were significantly lower among compliant patients.15 In a study (N = 8,454) to estimate primary nonadherence, defined as the failure to pick up BIS prescriptions for 60 days, Reynolds et al. (2013) reported that 1 in 3 women with OP satisfied the definition, which could negatively impact compliance rates.14 In a study that measured compliance and persistence among women with OP, Cramer et al. (2005) found a strong association between compliance rates with dosing frequency but concluded that compliance was low for all the dosing regimens evaluated.12
Daily, weekly, monthly, and yearly dosing formulations are available for OP medications.16 In a study that compared daily and weekly dosing in women (N = 2,741) aged 45 years and older, Cramer et al. (2007) reported that less frequent dosing (weekly compared with daily) was associated with significantly improved compliance and persistence.16 Out-of-pocket costs, prescription copays, and misperceptions about symptoms and risk levels are commonly implicated for low compliance rates.17,18 Other factors may include high cost and adverse effects of drugs, inadequacies in disease education, and in patient follow-up and involvement in treatment decisions.17,18
The primary objective of this study was to estimate compliance, noncompliance, and discontinuation rates of oral BIS therapy among OP patients. This study also examined the characteristics of patients who were compliant, noncompliant, or who discontinued OP therapy. It estimated the costs, health care resource utilization, and fracture rates associated with medication compliance and noncompliance.
Methods
Study Design and Population
This retrospective cohort study queried the HealthCore Integrated Research Environment (HIRE) to identify females aged 55 or more years who had at least 1 pharmacy claim for any of 3 oral BIS treatments (alendronate, risedronate, or ibandronate) from January 1, 2007, through September 30, 2010. The HIRE is a repository of longitudinal medical and pharmacy claims data for 14 geographically dispersed U.S. health plans covering approximately 35.5 million researchable lives. In this nonexperimental study, all materials were handled in strict compliance with the Health Insurance Portability and Accountability Act. Data were kept anonymous throughout, and patient confidentially was safeguarded; researchers only accessed a limited dataset devoid of any individual patient identifiers. This nonexperimental study did not require the approval of an investigational review board.
Inclusion/Exclusion Criteria
To be included in this study, patients were required to have continuous health plan eligibility 12 months before and 24 months after the index date, defined as the date of the first pharmacy claim for any of the 3 medications. Patients were excluded if they had Paget’s disease (International Classification of Diseases, Ninth Revision, Clinical Modification [ICD-9-CM] code 731.0x) or malignant neoplasms (ICD-9-CM codes 140.xx-171.xx, 174.xx-208.xx, 230.xx-239.xx) at any time during the study period. Also excluded were patients with prescription fills for multiple study medications on the index date or with a pharmacy claim for study medications during the 12-month pre-index period.
Outcome Measures
In this study, the pre-index (baseline) period was defined as the 12 months prior to the index date, and patient outcomes were evaluated at the 12-month and 24-month points during follow-up. Post-index eligibility was split into 2 follow-up periods. The first, labeled as the compliance time period, was the 12-month time period after the index date in which compliance was determined. The second time period, labeled as the cost and consequences time period, was the 13 to 24 months after the index date in which health care resource utilization, cost, and outcomes were assessed. Patient characteristics including age, type of health plan, and geographic region were compared for the treatment compliant and noncompliant cohorts. Comorbidities were measured with the Deyo-Charlson Comorbidity Index (DCI) for the 12-month baseline period. The DCI consists of 19 diagnoses identified by ICD-9-CM codes, and a weight from 1 to 6 is applied to each diagnosis. The final score represents the sum of weighted values of the comorbidities present, and higher scores indicate greater comorbidity burden.19
Treatment Patterns
Treatment patterns, including compliance, discontinuation, switching, and restarting, were assessed during the 12-month post-index period. Medication compliance was measured with MPR, defined as the summation of days’ supply of OP medications divided by the length of the study interval. The MPR of the index drug was defined as the summation of the days’ supply of medication refills divided by 365 × 100. Noncompliance was defined as an MPR of < 70%. Discontinuation was defined as a gap of ≥ 60 days between the fills of 2 sequential prescriptions during the 12-month post-index period. Within the subgroup of patients who discontinued treatment, medication switching was defined as receiving another nonindex OP medication within 45 days of discontinuation (first switch only). Restart was defined as the re-initiation of treatment during the 12-month post-index period following a treatment discontinuation.
Health Care Utilization and Costs
OP-related resource utilization and cost and all-cause health care costs were calculated from the administrative claims for inpatient hospitalizations, emergency room (ER) visits, outpatient services, physician office visits, and pharmacy claims during the post-index period. OP-related resource utilization and costs were defined as any utilization or cost claim with an ICD-9-CM code for OP (733.0x). Total health care resource utilization and cost were defined as the summation of all health care resources utilized within a specified time frame (e.g., post-index 13-24 months). All costs were adjusted to 2012 U.S. dollars.
Statistical Analysis
Descriptive statistics, means (± standard deviation [SD]), median, and relative frequencies were reported for continuous and categorical data. Continuous characteristics were compared using appropriate analysis of variance methodology (both parametric and nonparametric). Categorical variables were compared using chi-square tests. For all analyses, a 2-tailed level of significance was set at a conventional alpha of 0.05. Logistic regression modeling was used to examine the association between compliance and patients’ demographic and clinical characteristics. Generalized linear models (GLMs) with log link function and gamma distribution were used to examine the association between all-cause and OP-related health care costs and compliance while controlling for patient demographic and other clinical characteristics. Statistical analyses were performed using SAS version 9.2 (SAS Institute, Inc., Carey, NC).
Results
Study Population
Of all the patients (N = 27,905) who met study eligibility requirements (Figure 1), 15,917 (57.0%) indexed on alendronate, 6,739 (24.1%) on risedronate, and 5,249 (18.8%) on ibandronate, as shown in Table 1.
FIGURE 1.
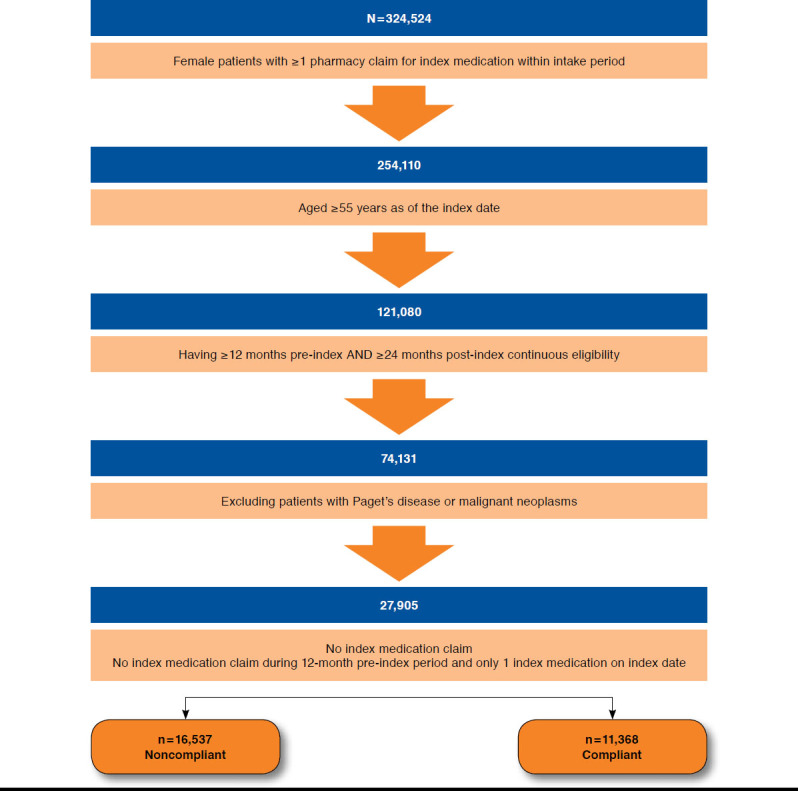
Disposition of Study Population
TABLE 1.
Treatment Status During Post-Index Period
| Total Patients (N = 27,905) | MPR (Categorical) | Discontinued (n = 17,243) | |||
|---|---|---|---|---|---|
| MPR < 70% (n = 16,537) | MPR ≥ 70% (n = 11,368) | P Valuea | |||
| Index medication, n (%) b | |||||
| Alendronate | 15,917 (57.0) | 9,192 (55.6) | 6,725 (59.2) | < 0.001 | 9,585 (55.6) |
| Risedronate | 6,739 (24.1) | 4,070 (24.6) | 2,669 (23.5) | 4,217 (24.5) | |
| Ibandronate | 5,249 (18.8) | 3,275 (19.8) | 1,974 (17.4) | 3,441 (20.0) | |
| MPR within 12-month post-index period, median (SD)c | 53.5 (35.3) | 27.4 (19.4) | 91.4 (9.1) | < 0.001 | 30.0 (22.4) |
| Number of index drug prescriptions within 12-month post-index period, mean (SD) | 5.6 (4.3) | 4.1 (3.7) | 9.2 (3.2) | < 0.001 | 3.1 (2.5) |
| Index medication treatment patterns during 12-month post-index period | |||||
| Discontinued, n (%)d | 17,243 (61.8) | 15,984 (96.7) | 1,259 (11.1) | < 0.001 | 17,243 (100.0) |
| Mean time (days) to discontinuation mean (SD) | 95 (77.0) | 87 (70.0) | 199 (90.0) | < 0.001 | 82 (69.0) |
| Switched, n (%) | 1,168 (6.8) | 1,107 (6.7) | 61 (0.5) | 0.005 | 1,168 (6.8) |
| Mean time (days) to switch, mean (SD) | 72 (76.0) | 64 (66.0) | 216 (109.0) | < 0.001 | 53 (60.0) |
| Restart, n,(%) | 4,240 (15.2) | 3,495 (21.1) | 745 (6.6) | < 0.001 | 4,240 (24.6) |
| Mean time (days) to restart, mean (SD) | 220 (79.0) | 218 (78.0) | 226 (82.0) | 0.019 | 223 (77.0) |
| Total fractures within 13- to 24-months post-index period, n (%) | 822 (2.9) | 547 (3.3) | 275 (2.4) | < 0.001 | 573 (3.3) |
| Dorsal and lumbar | 339 (1.2) | 235 (1.4) | 104 (0.9) | 0.001 | 243 (1.4) |
| Hip, pelvis, femur, lower forearm, radius/ulna, humerus fracture | 372 (1.3) | 246 (1.5) | 126 (1.1) | 0.007 | 257 (1.5) |
| Other fracture | 165 (0.6) | 105 (0.6) | 60 (0.5) | 0.267 | 111 (0.6) |
| Total fractures within 25- to 36-month post-index period, n (%) | 1,035 (5.5) | 659 (6.0) | 376 (4.8) | < 0.001 | 686 (6.0) |
| Dorsal and lumbar | 425 (2.3) | 279 (2.5) | 146 (1.9) | 0.002 | 287 (2.5) |
| Hip, pelvis, femur, lower forearm, radius/ulna, humerus fracture | 484 (2.6) | 307 (2.8) | 177 (2.3) | 0.028 | 320 (2.8) |
| Other fracture | 215 (1.1) | 125 (1.1) | 90 (1.2) | 0.945 | 130 (1.1) |
a P values ≤ 0.05 are italicized.
b Index medication is the first medication of study interest on index date.
c MPR = (sum of days supply regardless of overlapping/365 days) × 100.
d Discontinuation = a gap of at least 60 days between 2 sequential prescription fills.
MPR = medication possession ratio; SD = standard deviation.
Clinical and Demographic Characteristics at Baseline
In the 12-month pre-index period, 16,537 patients were treatment noncompliant (MPR < 70%), while 11,368 patients were compliant with their OP treatment regimens, as shown in Table 2. Both compliant and noncompliant patients had similar mean age, approximately 66 years. Greater proportions of patients were aged 65 years or less in the noncompliant (56.4%) and compliant (55.9%) cohorts. The distribution of patients by geographic regions was roughly similar; however, the proportions for noncompliant (34.8%) and compliant (36.3%) patients were greatest in the Midwest (P < 0.001). More than one-half of the patients were enrolled in preferred provider organizations (PPOs), while slightly less than one-fourth were covered by health maintenance organizations (HMOs) in both cohorts and overall (P < 0.001). The overall mean (± SD) pre-index DCI comorbidity score was 0.60 (± 1.07). Patients in the noncompliant cohort had a higher mean (± SD) comorbidity score (0.64 ± 1.11) compared with the compliant cohort (0.54 ± 1.01, P < 0.001). Within the study population, 3.7% of the patients had rheumatoid arthritis, 6.9% had asthma; and 7.1% had stroke. The noncompliant cohort had significantly higher percentages of patients with rheumatoid arthritis, asthma, and stroke, as well as chronic obstructive pulmonary disease and renal diseases compared with the compliant cohort.
TABLE 2.
Demographics and Clinical Characteristics
| Total Patients (N = 27,905) | MPR (Categorical) | Discontinued (n = 17,243) | |||
|---|---|---|---|---|---|
| MPR < 70% (n = 16,537) | MPR ≥ 70% (n = 11,368) | P Valuea | |||
| Age, n (%) | |||||
| < 65 | 15,679 (56.2) | 9,324 (56.4) | 6,355 (55.9) | 0.427 | 9,651 (60.7) |
| ≥ 65 | 12,226 (43.8) | 7,213 (43.6) | 5,013 (44.1) | 7,592 (47.8) | |
| Mean age (SD) | 66.1 (9.7) | 66.1 (9.8) | 66.0 (9.7) | 0.705 | 66.2 (9.8) |
| Geographic region, n (%) | |||||
| Northeast | 5,983 (21.4) | 3,495 (21.1) | 2,488 (21.9) | < 0.001 | 3,674 (23.1) |
| Midwest | 9,872 (35.4) | 5,748 (34.8) | 4,124 (36.3) | 6,012 (37.8) | |
| South | 7,341 (26.3) | 4,521 (27.3) | 2,820 (24.8) | 4,658 (29.3) | |
| West | 4,709 (16.9) | 2,773 (16.8) | 1,936 (17.0) | 2,899 (18.2) | |
| Health plan type, n (%) | |||||
| HMO | 6,369 (22.8) | 3,809 (23.0) | 2,560 (22.5) | < 0.001 | 3,983 (25.1) |
| PPO | 16,425 (58.9) | 9,671 (58.5) | 6,754 (59.4) | 10,074 (63.4) | |
| Other | 5,111 (18.3) | 3,057 (18.5) | 2,054 (18.1) | 3,186 (20.0) | |
| Pre-index comorbidities during 12-month pre-index period, n (%) | |||||
| Deyo-Charlson Comorbidity Score, mean (SD) | 0.60 (1.07) | 0.64 (1.11) | 0.54 (1.01) | < 0.001 | 0.64 (1.11) |
| Anorexia nervosa | 9 (0.0) | 6 (0.0) | 3 (0.0) | 0.746 | 6 (0.0) |
| Celiac disease | 45 (0.2) | 25 (0.2) | 20 (0.2) | 0.650 | 25 (0.1) |
| Inflammatory bowel disease | 243 (0.9) | 162 (1.0) | 81 (0.7) | 0.018 | 156 (0.9) |
| Lactose intolerance | 99 (0.4) | 66 (0.4) | 33 (0.3) | 0.151 | 68 (0.4) |
| Lupus | 213 (0.8) | 140 (0.8) | 73 (0.6) | 0.059 | 142 (0.8) |
| Rheumatoid arthritis | 1,031 (3.7) | 676 (4.1) | 355 (3.1) | < 0.001 | 696 (4.0) |
| Asthma | 1,939 (6.9) | 1,241 (7.5) | 698 (6.1) | < 0.001 | 1,290 (7.5) |
| Stroke | 1,976 (7.1) | 1,234 (7.5) | 742 (6.5) | 0.003 | 1,307 (7.6) |
| Dementia | 336 (1.2) | 188 (1.1) | 148 (1.3) | 0.219 | 198 (1.1) |
| COPD | 1,672 (6.0) | 1,077 (6.5) | 595 (5.2) | < 0.001 | 1,120 (6.5) |
| Renal disease | 862 (3.1) | 543 (3.3) | 319 (2.8) | 0.024 | 561 (3.3) |
| Hyperparathyroidism | 229 (0.8) | 127 (0.8) | 102 (0.9) | 0.251 | 130 (0.8) |
a P values ≤ 0.05 are italicized.
COPD = chronic obstructive pulmonary disease; HMO = health maintenance organization; MPR = medication possession ratio; PPO = preferred provider organization; SD = standard deviation.
Outcomes at 12-Month Post-Index Period
During the 12-month post-index period, the overall mean (± SD) MPR was 53.5% (± 35.3%). The MPR in the compliant cohort was 91.4% (± 9.1%) and 27.4% (± 19.4%) in the noncompliant cohort (P < 0.001). For the compliant cohort, the mean (± SD) number of prescription scripts in the 12-month post-index period (9.2 ± 3.2) was significantly higher than that in the noncompliant (4.1 ± 3.7) cohort (P < 0.001).
Within the entire study population, 17,243 (61.8%) patients discontinued their index medications during the 12-month post-index period an average of 95 days from the index date, as shown in Table 1. Almost two-thirds (60.7%) of the patients who discontinued were aged less than 65 years; 37.8% were located in the Midwest region and 29.3% in the South region; and 63.4% had health coverage from PPOs. Patients who discontinued had an average MPR of 30.0 (± 22.4). Of patients who discontinued, 6.8% switched to another OP medication while 24.6% restarted their index medications after discontinuation.
Most of the noncompliant patients (96.7%) discontinued the index medication, while only 11.1% of the compliant patients discontinued (P < 0.001). The average time to discontinuation was also significantly longer for the compliant group, 199 days, versus 87 days for the noncompliant cohort (P < 0.001). The rate of medication switching was significantly greater in the noncompliant group (6.7%) versus 0.5% in the compliant group, and the mean time to switch was significantly shorter: 64 days for the noncompliant patients versus 216 days for those in the compliant category (P < 0.001). Overall, 15.2% of the patients who discontinued their OP medications restarted treatment after an average of 220 days. A significantly smaller proportion of the compliant patients (6.6%) restarted treatment compared with noncompliant (21.1%) patients (P < 0.001). The average time to restart therapy was roughly similar for the 2 cohorts, 218 and 226 days for the noncompliant and compliant patients, respectively.
Outcomes at 13- to 24-Month Post-Index Period
In the 13- to 24-month post-index period, greater proportions of patients in the compliant cohort had OP-related inpatient admissions, ER visits, physician office visits, and other outpatient services, relative to the noncompliant group. Cost differences across these service categories, however, were not significant. Not unexpectedly, the rate of pharmacy utilization (90.5% vs. 42.4%, P < 0.001) and costs ($536 vs. $213, P < 0.001) among compliant patients was significantly higher than in the noncompliant group, respectively, as shown in Table 3. Likewise, the compliant cohort had significantly greater higher mean total costs versus the noncompliant cohort ($970 vs. $674, P < 0.001). Patients in the compliant cohort had significantly lower mean costs in all-cause inpatient admission, ER visits, physician office visits, and outpatient services (P < 0.001 for all comparisons). Similar to the OP-related pharmacy utilization and costs, however, patients in the compliant cohort had significantly higher mean all-cause pharmacy costs relative to noncompliant patients ($2,643 vs. $2,197, P < 0.001). Compliant patients had lower mean total costs ($6,758 vs. $7,237, P = 0.008).
TABLE 3.
OP-Related and All-Cause Health Care Utilization/Costs During the 13- to 24-Month Post-Index Period
| Total Patients | MPR (Categorical) | Discontinued | |||||||||||
|---|---|---|---|---|---|---|---|---|---|---|---|---|---|
| MPR < 70% | MPR ≥ 70% | P Valuea | |||||||||||
| OP-related health care costs | 27,905 | 16,537 | 59.3% | 11,368 | 40.7% | 17,243 | 61.8% | ||||||
| Inpatient admissions | |||||||||||||
| Visits, n (%) | 783 | (2.8) | 439 | (2.7) | 344 | (3.0) | 0.065 | 452 | (2.6) | ||||
| Cost, mean (SD, median), $ | 318 | 3,697 | 0 | 334 | 4,220 | 0 | 294 | 2,765 | 0 | 0.338 | 328 | 4,164 | 0 |
| Emergency room visits | |||||||||||||
| Visits, n (%) | 238 | (0.9) | 138 | (0.8) | 100 | (0.9) | 0.691 | 145 | (0.8) | ||||
| Cost, mean (SD, median), $ | 6 | 97 | 0 | 5 | 95 | 0 | 6 | 100 | 0 | 0.587 | 5 | 94 | 0 |
| Physician office visits | |||||||||||||
| Visits, n (%) | 6,968 | (25.0) | 3,742 | (22.6) | 3,226 | (28.4) | < 0.001 | 3,961 | (23.0) | ||||
| Cost, mean (SD, median), $ | 45 | 208 | 0 | 44 | 245 | 0 | 46 | 139 | 0 | 0.493 | 45 | 241 | 0 |
| Outpatient services | |||||||||||||
| Visits, n (%) | 5,235 | (18.8) | 2,841 | (17.2) | 2,394 | (21.1) | < 0.001 | 3,018 | (17.5) | ||||
| Cost, mean (SD, median), $ | 82 | 641 | 0 | 77 | 643 | 0 | 88 | 639 | 0 | 0.167 | 79 | 638 | 0 |
| Prescription drugs | |||||||||||||
| Visits, n (%) | 17,291 | (62.0) | 7,009 | (42.4) | 10,282 | (90.5) | < 0.001 | 7,486 | (43.4) | ||||
| Cost, mean (SD, median), $ | 345 | 645 | 95 | 213 | 636 | 0 | 536 | 609 | 263 | < 0.001 | 222 | 635 | 0 |
| Total costs, mean (SD, median), $ | 795 | 3,882 | 175 | 674 | 4,406 | 46 | 970 | 2,949 | 428 | < 0.001 | 678 | 4,348 | 55 |
| All-cause costs | |||||||||||||
| Inpatient admissions | |||||||||||||
| Visits, n (%) | 3,480 | (12.5) | 2,260 | (13.7) | 1,220 | (10.7) | < 0.001 | 2,342 | (13.6) | ||||
| Cost, mean (SD, median), $ | 1,737 | 11,756 | 0 | 1,986 | 12,299 | 0 | 1,375 | 10,909 | 0 | < 0.001 | 1,975 | 12,198 | 0 |
| Emergency room visits | |||||||||||||
| Visits, n (%) | 4,033 | (14.5) | 2,586 | (15.6) | 1,447 | (12.7) | < 0.001 | 2,671 | (15.5) | ||||
| Cost, mean (SD, median), $ | 224 | 1,266 | 0 | 258 | 1,482 | 0 | 174 | 856 | 0 | < 0.001 | 255 | 1,457 | 0 |
| Physician office visits | |||||||||||||
| Visits, n (%) | 26,547 | (95.1) | 15,657 | (94.7) | 10,890 | (95.8) | < 0.001 | 16,326 | (94.7) | ||||
| Cost, mean (SD, median), $ | 705 | 1,082 | 434 | 738 | 1,157 | 447 | 658 | 959 | 418 | < 0.001 | 736 | 1,139 | 449 |
| Outpatient services | |||||||||||||
| Visits, n (%) | 26,301 | (94.3) | 15,460 | (93.5) | 10,841 | (95.4) | < 0.001 | 16,134 | (93.6) | ||||
| Cost, mean (SD, median), $ | 1,996 | 4,689 | 669 | 2,057 | 4,944 | 678 | 1,908 | 4,290 | 652 | 0.008 | 2,063 | 4,867 | 686 |
| Prescription drugs | |||||||||||||
| Visits, n (%) | 26,798 | (96.0) | 15,578 | (94.2) | 11,220 | (98.7) | < 0.001 | 16,244 | (94.2) | ||||
| Cost, mean (SD, median), $ | 2,379 | 3,702 | 1,386 | 2,197 | 3,660 | 1,169 | 2,643 | 3,746 | 1,635 | < 0.001 | 2,212 | 3,657 | 1,181 |
| Total costs, mean (SD, median), $ | 7,042 | 15,033 | 3,522 | 7,237 | 15,736 | 3,431 | 6,758 | 13,944 | 3,630 | 0.008 | 7,240 | 15,618 | 3,435 |
a P values ≤0.05 are italicized.
MPR = medication possession ratio; OP = osteoporosis; SD = standard deviation.
Overall, 822 patients (2.9%) had a fracture during the 13- to 24-month post-index period, and there was a significant difference in the fracture rate between the compliant and noncompliant groups (3.3% vs. 2.4%, P < 0.001), respectively, as shown in Table 1.
Factors Associated with Compliance
The results of the logistic regression model exploring factors associated with compliance indicated that age and DCI score were important predictors of medication compliance. Patients aged 65 years or older were more likely to be compliant than younger patients (14%, P = 0.012). Furthermore, the probability of compliance increased by 12% (P = 0.020) if the DCI score increased by 1, keeping other factors constant, as shown in Table 4.
TABLE 4.
Logistic Regression Model Estimating Compliance
| Odds Ratio | SE | P Valuea | |
|---|---|---|---|
| Age category (aged < 65 years as reference) | 1.14 | 1.05 | 0.012 |
| Geographic region (Northeast as reference) | |||
| Midwest | 0.96 | 1.08 | 0.578 |
| South | 0.81 | 1.08 | 0.007 |
| West | 0.95 | 1.09 | 0.550 |
| Health plan type (HMO as reference) | |||
| PPO | 1.02 | 1.07 | 0.750 |
| Other | 1.01 | 1.09 | 0.934 |
| Pre-index osteoporosis | |||
| Pre-index comorbidities | 0.97 | 1.03 | 0.347 |
| Deyo-Charlson Comorbidity Score | 1.12 | 1.05 | 0.020 |
| Inflammatory bowel disease | 0.39 | 1.31 | 0.001 |
| Rheumatoid arthritis | 0.81 | 1.15 | 0.119 |
| Asthma | 0.94 | 1.11 | 0.529 |
| Stroke | 1.12 | 1.11 | 0.278 |
| COPD | 0.93 | 1.12 | 0.496 |
| Renal disease | 0.89 | 1.18 | 0.470 |
| Index medication (Alendronate as reference) | |||
| Risedronate | 0.92 | 1.06 | 0.140 |
| Ibandronate | 1.02 | 1.07 | 0.801 |
| Discontinued | 0.00 | 1.05 | < 0.001 |
Note: Dependent variable is Compliance, Yes = 1, No = 0.
a P values ≤ 0.05 are italicized.
COPD = chronic obstructive pulmonary disease; HMO = health maintenance organization; MPR = medication possession ratio; PPO = preferred provider organization; SE = standard error.
Cost Predictors
GLMs to assess independent predictors of all-cause and OP-related health care total costs showed that compliant patients had 3% (P = 0.298) lower all-cause total costs compared with noncompliant patients, as shown in Table 5. The adjusted all-cause total cost was $12,997 for noncompliant patients and $12,653 for compliant patients. For OP-related health care total costs with noncompliance as reference, compliance was associated with 9% (P = 0.007) lower costs than noncompliance, and adjusted OP-related total costs were $2,393 for noncompliant patients and $2,168 for compliant patients.
TABLE 5.
GLM Estimates of Post-Index Second Year All-Cause and OP-Related Total Costs
| All-Cause Total Costs | OP-Related Total Costs | |||||
|---|---|---|---|---|---|---|
| Costs | SE | P Valuea | Costs | SE | P Valuea | |
| Complianceb (No as reference) | 0.97 | 1.03 | 0.298 | 0.91 | 1.04 | 0.007 |
| Age (aged < 65 years as reference) | 0.73 | 1.01 | < 0.001 | 0.90 | 1.02 | < 0.001 |
| Geographic region (Northeast as reference) | ||||||
| Midwest | 0.80 | 1.02 | < 0.001 | 0.96 | 1.03 | 0.180 |
| South | 0.81 | 1.02 | < 0.001 | 0.85 | 1.03 | < 0.001 |
| West | 0.92 | 1.02 | 0.001 | 1.05 | 1.03 | 0.162 |
| Health plan type (HMO as reference) | ||||||
| PPO | 0.83 | 1.02 | < 0.001 | 0.73 | 1.03 | < 0.001 |
| Other | 0.98 | 1.02 | 0.299 | 1.01 | 1.03 | 0.802 |
| Pre-index osteoporosis | 0.97 | 1.01 | 0.045 | 1.14 | 1.02 | < 0.001 |
| Pre-index comorbidities | ||||||
| Deyo-Charlson Comorbidity Score | 1.30 | 1.01 | < 0.001 | 1.05 | 1.01 | < 0.001 |
| Inflammatory bowel disease | 1.62 | 1.07 | < 0.001 | 1.59 | 1.11 | < 0.001 |
| Rheumatoid arthritis | 1.73 | 1.03 | < 0.001 | 1.50 | 1.05 | < 0.001 |
| Asthma | 1.35 | 1.03 | < 0.001 | 1.01 | 1.04 | 0.779 |
| Stroke | 0.91 | 1.03 | 0.001 | 0.87 | 1.04 | 0.001 |
| COPD | 1.16 | 1.03 | < 0.001 | 1.37 | 1.04 | < 0.001 |
| Index medication (Alendronate as reference) | ||||||
| Renal disease | 0.91 | 1.04 | 0.023 | 1.18 | 1.06 | 0.006 |
| Risedronate | 1.04 | 1.02 | 0.005 | 1.51 | 1.02 | < 0.001 |
| Ibandronate | 1.16 | 1.02 | < 0.001 | 1.59 | 1.03 | < 0.001 |
| Discontinued | 1.01 | 1.03 | 0.740 | 1.02 | 1.04 | 0.637 |
a P values ≤ 0.05 are italicized.
b Patients with MPR ≥ 70% were considered compliant.
COPD = chronic obstructive pulmonary disease; GLM = generalized linear models; HMO = health maintenance organization; MPR = medication possession ratio; OP = osteoporosis; PPO = preferred provider organization; SE = standard error.
Discussion
The results in this study—high rates of noncompliance, discontinuations (with substantially fewer restarts), and notable levels of switching among OP patients receiving BIS therapy—were largely consistent with prior research.12-16 Not unexpectedly, noncompliant patients were associated with higher rates of fracture throughout the post-index period—during the post-index second year (3.3% vs. 2.4%) and for the combined second and third years (6.0% vs. 4.8%), respectively. Our findings also indicated greater health care utilization and OP-related and all-cause costs for noncompliant versus compliant patients.
These results constitute a notable addition to an important body of literature on OP management. With more than half (59%) of the patients categorized as noncompliant, this study provided additional confirmation of the overall expectation that patient compliance to OP therapy in real-world settings would approximate the suboptimal levels previously reported in the literature (e.g., 57%-75% of patients having an MPR <80% during a mean follow-up period of 17-24 months13). Similarly, Siris et al. reported a noncompliance rate of 57% in a study that queried 2 U.S. databases representing 45 employers and 100 health plans.15 These results also confirm a longstanding trend that suggests persistant noncompliance with OP therapy despite the availability of safe and efficacious treatments and expanding patient education efforts.1
In addition to replicating and confirming the anticipated results and trends of OP management, several of the inherent features in this study could be considered new knowledge in this area. We employed rigorous methodologies to assess medication compliance among commercially insured patients who may be representative of the national OP population. Notably, our logistic regression modeling demonstrated that an important indicator of noncompliance was being less than aged 65 years. The GLM models, which investigated independent predictors of OP-related and all-cause health care costs, indicated a strong association between noncompliance and higher costs.
Furthermore, this study employed a longer follow-up period than several prior analyses that investigated this research question. This is because patients can be on osteoporotic therapy for several years, and the time to fracture may also take a number of years. In response, we studied patients for as long as data were available on them. As a result, a patient with an early index date in this study could potentially have cumulative data spanning more than 3 years of study time.12,13,16
Despite high noncompliance rates, consistent with previous investigations in this area, a clear interpretation of the results of this study is that compliance with osteoporosis therapy, especially the first-line BIS drugs, was associated with lower risk of subsequent OP-related fractures irrespective of confounders such as comorbidities and demographic characteristics. This finding will have implications for patients, providers, and payers who are engaged in decision making and general management of OP.
Limitations
Administrative claims were the primary data in this study. These claims data were collected for accounting transactions and not necessarily for research. As a result, the misattribution of an OP-related fracture is possible. Diagnosis codes were not independently validated with patient chart data and other medical reviews. Fractures could have resulted from other causes unknown to us, although such events were likely nominal. While systemic bias is a potential limitation with claims data, there was none in the classification of a fracture in this study, which included all patients who met the inclusion criteria, insurance eligibility, age, and treatment requirements. Other research limitations inherent in claims data include coding errors and the absence of demographic factors such as family history of fractures, smoking rates, and heavy alcohol use. Furthermore, laboratory values such as bone mineral density, which could be instructive in fracture risk models, were not available. Patients were identified with index prescription for 1 of the OP study medications. The date of a pharmacy fill was considered the start date of medication usage; however, it is possible that actual usage could commence later. In addition, pharmacy claims may not reflect the full extent of medication usage, since patients sometimes use OTC preparations and may receive medications as samples from providers. This study did not evaluate dosing frequency, a key factor in OP medication compliance, which could be due more to study design than the limitations of claims data. Also, generalizing the findings from this study to the entire population of patients at risk for osteoporosis, or those who incur fractures due to OP, might not be possible.
Conclusions
The findings in this study confirmed that there are high rates of noncompliance among older women diagnosed with OP, despite the availability of safe and effective medications and increasing patient education efforts. Noncompliance to BIS treatment was associated with increased post-index fracture risk. Compliance was associated with lower post-index OP-related and all-cause costs and overall health care utilization. This study provides valuable data related to outcomes among patients with low compliance rates. Furthermore, this work highlights the financial implications and treatment outcomes of BIS medication noncompliance within a female osteoporotic population. These results could be of value to patients, providers, payers, and other stakeholders dealing with OP therapies and treatment patterns.
ACKNOWLEDGMENTS
Elizabeth A. Marks, BS, at HealthCore, Inc., provided support for the submission of this manuscript.
REFERENCES
- 1.National Osteoporosis Foundation. Clinician’s Guide to Prevention and Treatment of Osteoporosis. Washington, DC: National Osteoporosis Foundation; 2013. [Google Scholar]
- 2.U.S. Department of Health and Human Services. Bone Health and Osteoporosis: A Report of the Surgeon General. Rockville, MD: U.S. Department of Health and Human Services, Office of the Surgeon General; 2004. [Google Scholar]
- 3.Cosman F. The prevention and treatment of osteoporosis: a review. MedGenMed. 2005;7(2):73. [PubMed] [Google Scholar]
- 4.National Osteoporosis Foundation. America’s Bone Health: The State of Osteoporosis and Low Bone Mass in Our Nation. Washington, DC: National Osteoporosis Foundation; 2002. [Google Scholar]
- 5.Abrahamsen B, van Staa T, Ariely R, Olson M, Cooper C.. Excess mortality following hip fracture: a systematic epidemiological review. Osteoporos Int. 2009;20(10):1633-50. [DOI] [PubMed] [Google Scholar]
- 6.Colón-Emeric C, Kuchibhatla M, Pieper C, et al. The contribution of hip fracture to risk of subsequent fractures: data from two longitudinal studies. Osteoporos Int. 2003;14(11):879-83. [DOI] [PubMed] [Google Scholar]
- 7.Burge R, Dawson-Hughes B, Solomon DH, Wong JB, King A, Tosteson A.. Incidence and economic burden of osteoporosis-related fractures in the United States, 2005-2025. J Bone Miner Res. 2007;22(3):465-75. [DOI] [PubMed] [Google Scholar]
- 8.Fleurence RL, Iglesias CP, Johnson JM.. The cost effectiveness of bisphosphonates for the prevention and treatment of osteoporosis: a structured review of the literature. Pharmacoeconomics. 2007;25(11):913-33. [DOI] [PubMed] [Google Scholar]
- 9.Levis S, Theodore G.. Summary of AHRQ’s comparative effectiveness review of treatment to prevent fractures in men and women with low bone density or osteoporosis: update of the 2007 report. J Manag Care Pharm. 2012;18(4 Suppl B):S1-S15. Available at: http://www.ahrq.gov/professionals/education/continuing-ed/index.html. [DOI] [PMC free article] [PubMed] [Google Scholar]
- 10.Stevenson M, Jones ML, De Nigris E, Brewer N, Davis S, Oakley J.. A systematic review and economic evaluation of alendronate, etidronate, risedronate, raloxifene and teriparatide for the prevention and treatment of postmenopausal osteoporosis. Health Technol Assess. 2005;9(22):1-160. [DOI] [PubMed] [Google Scholar]
- 11.Tosteson AN, Burge RT, Marshall DA, Lindsay R.. Therapies for treatment of osteoporosis in US women: cost-effectiveness and budget impact considerations. Am J Manag Care. 2008;14(9):605-15. [PubMed] [Google Scholar]
- 12.Cramer JA, Amonkar MM, Hebborn A, Altman R.. Compliance and persistence with bisphosphonate dosing regimens among women with postmenopausal osteoporosis. Curr Med Res Opin. 2005;21(9):1453-60. [DOI] [PubMed] [Google Scholar]
- 13.Huybrechts KF, Ishak KJ, Caro JJ.. Assessment of compliance with osteoporosis treatment and its consequences in a managed care population. Bone. 2006;38(9):922-28. [DOI] [PubMed] [Google Scholar]
- 14.Reynolds K, Muntner P, Cheetham TC, et al. Primary non-adherence to bisphosphonates in an integrated healthcare setting. Osteoporos Int. 2013;24(9):2509-17. [DOI] [PubMed] [Google Scholar]
- 15.Siris ES, Harris ST, Rosen CJ, et al. Adherence to bisphosphonate therapy and fracture rates in osteoporotic women: relationship to vertebral and nonvertebral fractures from 2 US claims databases. Mayo Clin Proc. 2006;81(8):1013-22. [DOI] [PubMed] [Google Scholar]
- 16.Cramer JA, Gold DT, Silverman SL, Lewiecki EM.. A systematic review of persistence and compliance with bisphosphonates for osteoporosis. Osteoporos Int. 2007;18(8):1023-31. [DOI] [PubMed] [Google Scholar]
- 17.Gold DT, Silverman S.. Review of adherence to medications for the treatment of osteoporosis. Curr Osteoporos Rep. 2006;4(1):21-27. [DOI] [PubMed] [Google Scholar]
- 18.Gold DT. Understanding patient compliance and persistence with osteoporosis therapy. Drugs Aging. 2011;28(4):249-55. [DOI] [PubMed] [Google Scholar]
- 19.Deyo RA, Cherkin DC, Ciol MA.. Adapting a clinical comorbidity index for use with ICD-9-CM administrative databases. J Clin Epidemiol. 1992;45(6):613-19. [DOI] [PubMed] [Google Scholar]