

Abstract
BACKGROUND:
Necitumumab (Neci) was the first biologic approved by the FDA for use in combination with gemcitabine and cisplatin (Neci + GCis) in first-line treatment of metastatic squamous non-small cell lung cancer (msqNSCLC). The potential financial impact on a health plan of adding Neci + GCis to drug formularies may be important to value-based decision makers in the United States, given ever-tightening budget constraints.
OBJECTIVE:
To estimate the budget impact of introducing Neci + GCis for first-line treatment of msqNSCLC from U.S. commercial and Medicare payer perspectives.
METHODS:
The budget impact model estimates the costs of msqNSCLC before and after adoption of Neci + GCis in hypothetical U.S. commercial and Medicare health plans over a 3-year time horizon. The eligible patient population was estimated from U.S. epidemiology statistics. Clinical data were obtained from randomized clinical trials, U.S. prescribing information, and clinical guidelines. Market share projections were based on market research data. Cost data were obtained from online sources and published literature. The incremental aggregate annual health plan, per-patient-per-year (PPPY), and per-member-per-month (PMPM) costs were estimated in 2015 U.S. dollars. One-way sensitivity analyses were conducted to assess the effect of model parameters on results.
RESULTS:
In a hypothetical 1,000,000-member commercial health plan with an estimated population of 30 msqNSCLC patients receiving first-line chemotherapy, the introduction of Neci + GCis at an initial market share of approximately 5% had an overall year 1 incremental budget impact of $88,394 ($3,177 PPPY, $0.007 PMPM), representing a 2.9% cost increase and reaching $304,079 ($10,397 PPPY, $0.025 PMPM) or a 7.4% cost increase at a market share of 14.7% in year 3. This increase in total costs was largely attributable to Neci drug costs and, in part, due to longer survival and treatment duration for patients treated with Neci+GCis. Overall, treatment costs increased by $81,812 (13.5%), and disease costs increased by $7,951 (0.4%), whereas adverse event costs decreased by $1,368 (0.5%) in year 1. From the Medicare perspective, the overall year 1 incremental budget impact was $438,056 ($0.037 PMPM, $3,112 PPPY), representing a 3.0% cost increase. The higher incremental budget in Medicare, compared with commercial plans, was due to higher msqNSCLC incidence in the older Medicare patients (154 vs. 30 patients, respectively). Results were most sensitive to Neci drug costs.
CONCLUSIONS:
Based on projected market shares, coverage for first-line therapy with Neci + GCis appeared to modestly affect overall U.S. health care budgets for msqNSCLC-related care. Given the small eligible patient population, the PMPM budgetary impact on a commercial health plan of reimbursing Neci + GCis in the first year was less than $0.01, rising with increased use of Neci + GCis to $0.025 in the third year. The real-world effect of Neci + GCis needs to be evaluated to validate this analysis; however, these findings may help policymakers in making coverage decisions for Neci + GCis.
What is already known about this subject
Approximately 30% of patients with non-small cell lung cancer (NSCLC) present with squamous histology, which, compared with nonsquamous histology, is more difficult to treat and offers fewer therapeutic options.
Despite recent advances, platinum-based doublet chemotherapy is still the standard first-line treatment for patients with non-oncogenic-driven metastatic squamous NSCLC (msqNSCLC).
A phase 3 clinical trial demonstrated that the addition of necitumumab to gemcitabine and cisplatin (platinum-based doublet chemotherapy) improves overall survival in patients with msqNSCLC.
What this study adds
This analysis estimated the budget impact of using necitumumab plus gemcitabine and cisplatin (Neci+GCis), compared with conventional first-line chemotherapy treatment options, as first-line treatment of msqNSCLC in a hypothetical U.S. commercial health plan or Medicare.
Given the small eligible patient population, the estimated budget impact of Neci+GCis use in a commercial health plan was small, less than 1 cent per member per month (PMPM) in year 1, rising with increased Neci+GCis use to 2.5 cents PMPM in the third year.
The budget impact in Medicare was higher than for commercial plans ($0.037 vs. $0.007 PMPM in year 1, respectively) due to higher msqNSCLC incidence in the older Medicare population.
Lung cancer is the leading cause of death from cancer in the United States (> 154,000 deaths expected in 2018), and the number of deaths is increasing.1 An estimated 234,050 new cases of lung cancer are expected in 2018, accounting for about 13% of all new cancer diagnoses.1 It is the second most common cancer in men (after prostate cancer) and women (after breast cancer). Non-small cell lung cancer (NSCLC) constitutes 85%-90% of all lung cancers in the United States,2 of which 26%-35% are of the squamous histologic subtype.2,3 The median age at the time of NSCLC diagnosis is 71 years,4 and most patients present with locally advanced or metastatic disease, with a median overall survival of 8-10 months and a 5-year survival rate of 18%.1,5 In the United States, only half of patients with metastatic squamous NSCLC (msqNSCLS) who receive first-line treatment go on to receive second-line therapy,3 thus, it is important to maximize the benefit that patients receive from first-line treatment.
Although significant progress has been made in first-line treatment of advanced nonsquamous NSCLC (e.g., bevacizumab and pemetrexed), until recently available first-line regimens (i.e., platinum-doublet chemotherapy) to treat msqNSCLC had remained essentially unchanged for the past 2 decades.6-9 The vast majority of targeted agents previously tested in the first-line msqNSCLC setting have failed to show significant efficacy benefit.10-14 This relative lack of therapeutic advancement and poor prognosis for patients with msqNSCLC is in part due to a number of patient and molecular factors (e.g., older age, smoking history, high prevalence of comorbidities, and tumors that are in close proximity to large blood vessels) that together make msqNSCLC a distinct, aggressive, and especially challenging disease to manage and treat.15 While the presence of actionable molecular biomarkers is found less frequently among patients with msqNSCLC compared with those with nonsquamous histology, the 30% of chemotherapy-naive msqNSCLC patients who overexpress (tumor proportion score of ≥ 50%) PD-L1 levels may be treated with pembrolizumab, the first and only immune-checkpoint inhibitor approved by the U.S. Food and Drug Administration (FDA) in October 2016 for first-line treatment of advanced NSCLC.16
In November 2015, necitumumab (Neci), a monoclonal antibody, was the first biologic approved by the FDA for use in combination with the standard chemotherapy drugs gemcitabine and cisplatin (Neci + GCis) as a first-line treatment option for patients with msqNSCLC, regardless of the molecular profile of the tumor (e.g., PD-L1 expression). This approval was based on results from SQUIRE, the first phase 3 clinical trial specifically designed to assess first-line treatment of msqNSCLC with a targeted agent.17,18 SQUIRE showed that the addition of Neci to a platinum-based doublet (GCis) was associated with a 16% reduction in risk of death and improvement in median overall survival by 1.6 months (11.5 vs. 9.9 months; hazard ratio [HR] = 0.84, 95% confidence interval [CI] = 0.74-0.96; P = 0.01) and median progression-free survival by 0.2 months (5.7 vs. 5.5 months; HR = 0.84, 95% CI = 0.75-0.95; P = 0.006), with an acceptable benefit-to-risk ratio and health-related quality of life profile.18,19 The ability of Neci + GCis to extend life beyond the current standard of care is a positive step in addressing the unmet need in patients with nononcogenic-driven msqNSCLC.6,19
Given the substantial clinical and economic burden of lung cancer faced by health care systems in the United States, coupled with the continuous rise in health care spending (expected to average 5.8% annually over 2015-202520) and ever-tightening budget constraints, U.S. health plans may be concerned about the potential financial impact of adding Neci + GCis to their formularies. Therefore, a budget impact analysis (BIA) was conducted from a U.S. payer perspective to estimate the incremental expenditures of the adoption of Neci + GCis by a commercial health plan or Medicare for first-line treatment of msqNSCLC.
Methods
Model Structure, Perspective, and Time Horizon
Using Microsoft Excel (Microsoft, Redmond, WA), a flexible model was designed to estimate the projected health plan-level budget impact of Neci + GCis compared with conventional first-line chemotherapy treatment options for msqNSCLC. The model framework was developed based on published BIA guidelines.21 The analyses were conducted over a 3-year time horizon. U.S. commercial payer and Medicare perspectives were considered separately. The Medicare perspective estimated the budget impact for a U.S. population aged 65 + years, with population-specific epidemiological and cost inputs based on Centers for Medicare & Medicaid Services data.
Two scenarios were considered in the model. In the current scenario, Neci + GCis was not available for first-line treatment, so only the use of current standard first-line treatment options were considered. In the alternative scenario, Neci + GCis was an option for first-line treatment in addition to the current treatment options.
Population
The baseline target population was defined as all msqNSCLC patients eligible to receive first-line chemotherapy. To estimate this target population, incidence rates per 100,000 persons from the Surveillance, Epidemiology, and End Results program were combined with U.S. Census data and proportions receiving first-line chemotherapy from Orsini et al. (2014; Appendix A, available in online article).3,22,23 Given the relatively short time horizon, the annual number of patients starting chemotherapy treatment was assumed to be constant over each year modeled. In the base case, the market shares of treatments for patients were assumed to remain constant in the current scenario, while the alternative scenario had patients switching from the other regimens to Neci + GCis.
Treatments and Market Share
Based on Orsini et al., 41% of incident cases of msqNSCLC were expected to receive first-line treatment.3 Platinum-based doublet chemotherapy is the standard first-line treatment for patients with nononcogenic-driven msqNSCLC, as approved by the FDA and recommended by the American College of Chest Physicians.24 Thus, first-line treatment regimens considered in the model included (a) GCis, (b) gemcitabine and carboplatin, (c) paclitaxel and carboplatin, and (d) nab-paclitaxel and carboplatin. The efficacy of these regimens, as well as Neci + GCis, has been established in phase 2 and phase 3 clinical trials (Table 1).18,25,26
TABLE 1.
Model Inputs
| Treatment Efficacy | ||||||
|---|---|---|---|---|---|---|
| Regimen | Months (Median) | Source | ||||
| Duration of Treatment | Overall Survival | |||||
| Necitumumab + gemcitabine and cisplatin | – | 11.50 | Thatcher 201518 | |||
| Necitumumab | 4.60 | – | ||||
| Gemcitabine and cisplatin | 4.14 | – | ||||
| Gemcitabine and cisplatin | 3.90 | 9.90 | ||||
| Gemcitabine and carboplatin | 4.30 | 6.60 | Treat 201025 | |||
| Paclitaxel and carboplatin | 4.14 | 9.50 | Socinski 201326 | |||
| Nab-paclitaxel and carboplatin | 4.14 | 10.70 | Socinski 201326 | |||
| Expected Market Share | ||||||
| Treatment Regimen, % | Annual Share Without Necitumumab | 2016 | 2017 | 2018 | ||
| Necitumumab + gemcitabine and cisplatin | 0.00 | 4.41 | 11.77 | 14.70 | ||
| Gemcitabine and cisplatin | 4.41 | 2.94 | 1.47 | 1.47 | ||
| Gemcitabine and carboplatin | 22.06 | 21.33 | 19.85 | 19.12 | ||
| Paclitaxel and carboplatin | 54.41 | 52.94 | 50.00 | 48.53 | ||
| Nab-paclitaxel and carboplatin | 19.12 | 18.38 | 16.91 | 16.18 | ||
| Drug Dosing Information and Patient Treatment Costs | ||||||
| Regimen | Dosing | Average Dose | Vials or Pills | Doses per Cycle | Source | Treatment Cost per Month, $a |
| Necitumumab Gemcitabine Cisplatin |
800 mg 1,250 mg/m2 75 mg/m2 |
800 mg 2,325 mg 140 mg |
1,800 mg 2 1,000 mg + 2 200 mg 1 100 mg + 1 50 mg |
2 2 1 |
Thatcher 201518 | 14,695 |
| Gemcitabine Cisplatin |
1,250 mg/m2 75 mg/m2 |
2,325 mg 140 mg |
2 1,000 mg + 2 200 mg 1 100 mg + 1 50 mg |
2 1 |
Thatcher 201518 | 2,693 |
| Gemcitabine Carboplatin |
1,000 mg/m2 687.5 mg |
1,860 mg 688 mg |
1 1,000 mg + 5 200 mg 1 450 mg + 5 50 mg |
2 1 |
Treat 201025 | 2,268 |
| Paclitaxel Carboplatin | 200 mg/m2 750 mg |
372 mg 750 mg |
1 300 mg + 3 30 mg 1 450 mg + 6 50 mg |
1 1 |
Socinski 201326 | 1,858 |
| Nab-paclitaxel Carboplatin | 100 mg/m2 750 mg |
186 mg 750 mg |
2 100 mg 1 450 mg + 6 50 mg |
3 1 |
Socinski 201326 | 11,494 |
| Clinical Trial Adverse Event Rates and Costs | ||||||
| Adverse Event | 2015 Cost, $ | Necitumumab + Gemcitabine and Cisplatin, % | Gemcitabine and Cisplatin, % | Gemcitabine and Carboplatin, % | Paclitaxel and Carboplatin, % | Nab-paclitaxel and Carboplatin, % |
| Source | HCUP 2015 30 | Thatcher 2015 18 | Thatcher 2015 18 | Treat 2010 25 | Socinski 2013 26 | Socinski 2013 26 |
| Anemia | 6,421 | 10.59 | 10.91 | 9.09 | 4.00 | 26.00 |
| Arterial thromboembolism | 21,825 | 3.90 | 2.03 | 0.00 | 0.00 | 0.00 |
| Arthralgia | 5,977 | 0.00 | 0.00 | 2.53 | 0.00 | 0.00 |
| Asthenia (fatigue) | 7,149 | 7.25 | 7.02 | 0.00 | 6.00 | 4.00 |
| Diarrhea | 7,292 | 1.67 | 1.48 | 2.02 | 0.00 | 0.00 |
| Eye disorders (conjunctivitis) | 4,117 | 0.37 | 0.00 | 0.00 | 0.00 | 0.00 |
| Febrile neutropenia | 19,444 | 0.74 | 1.29 | 3.03 | 0.00 | 0.00 |
| Hypomagnesemia | 5,364 | 9.29 | 1.11 | 0.00 | 0.00 | 0.00 |
| Infection | 11,979 | 0.00 | 0.00 | 3.03 | 0.00 | 0.00 |
| Infusion-related reaction | 7,383 | 0.37 | 0.00 | 0.00 | 0.00 | 0.00 |
| Interstitial lung disease-like events | 13,091 | 0.37 | 0.55 | 0.00 | 0.00 | 0.00 |
| Nausea | 6,500 | 0.00 | 0.00 | 5.56 | 0.00 | 0.00 |
| Neuropathy | 14,401 | 0.00 | 0.00 | 6.06 | 11.00 | 3.00 |
| Neutropenia | 12,652 | 24.35 | 27.54 | 32.83 | 51.00 | 43.00 |
| Rash | 6,490 | 7.06 | 0.37 | 0.00 | 0.00 | 0.00 |
| Thrombocytopenia | 10,563 | 10.22 | 10.72 | 29.29 | 7.00 | 22.00 |
| Venous thromboembolism | 8,038 | 5.02 | 2.59 | 0.00 | 0.00 | 0.00 |
| Vomiting | 6,500 | 0.00 | 0.00 | 5.05 | 0.00 | 0.00 |
| Total, $ | – | 7,929 | 6,987 | 10,644 | 9,462 | 10,152 |
aTreatment cost per month was calculated for each treatment regimen based on drug wholesale acquisition price.
In the current and alternative scenarios, the projected market shares for each of the msqNSCLC first-line treatment regimens are shown in Table 1. In the alternative scenario, the Neci + GCis market share was assumed to increase to 4.4% in the first year then 11.8% and 14.7% in the second and third years, respectively. With the introduction of Neci + GCis and increased market share over 3 years, corresponding market share decreases were assumed for the other treatment options.
Cost Estimation
Treatment costs, grade ≥ 3 adverse event (AE) costs, and disease costs were included in the analysis. As per established BIA guidelines,21 no discounting of costs was applied to the budget impact model.
Drug and Administration Costs.
Treatment costs were calculated assuming that patients were treated in accordance with the U.S. prescribing information (USPI). These costs included drug and administration costs for pretreatment (e.g., costs for hydration, steroids, and antinausea medication) and each first-line regimen as determined based on the USPI for the respective therapies. The cost of treatment administration was a product of the average number of infusions per patient and the infusion administration cost. Infusion costs were based on the 2015 Medicare reimbursement rate for chemotherapy administration for a 1-hour infusion (Current Procedural Terminology codes 96413, 96415, and 96417).27
The wholesale acquisition costs were used for drug costs, as derived from the 2015 RED BOOK Online database.28 Drug costs for Neci + GCis were based on flat dosing and duration of use as reported in the SQUIRE trial (Table 1).18 The treatment duration with Neci + GCis was longer than that for the other agents, since patients who were progression free after 6 cycles on Neci + GCis continued treatment with single-agent Neci until disease progression or unacceptable toxicity.18,25,26 Drug costs for the other agents were calculated using the average patient baseline characteristics,18 administration instructions, and median treatment durations from the respective pivotal trials and USPIs (Table 1).18,25,26 The default value for weight was based on the average weight of msqNSCLC patients in the SQUIRE trial (71.8 kg), and the corresponding body surface area was calculated using the equation contained in Livingston and Lee (2001).29 Treatment costs accounted for wastage; however, the potential cost impacts of dose reductions, delays in administration, and treatment holidays were not modeled.
Adverse Events Costs.
Costs of managing AEs grade 3 or higher were based on events reported in the pivotal trial publications of the respective therapies in the model.18,25,26 This reporting ensured that the cost of rare but potentially expensive AEs were not omitted from the BIA. Each AE was indexed to a specific code from the International Classification of Diseases, Ninth Revision, Clinical Modification. Resource use and costs associated with disease monitoring and AEs were based on Healthcare Cost and Utilization Project data,30 inflated using medical costs data from the Consumer Price Index (Table 1).31 For each regimen, all AE rates were independently multiplied by their associated AE costs, and the sum of the products was used as the total AE cost. When an AE was included for 1 treatment, the absolute event rates for that AE were reported for all other treatments. The costs of managing each AE were assumed to be constant over the time horizon.
Disease Costs.
Disease costs represented additional cancer-attributable health care expenditures (e.g., diagnosis work-up, inpatient and outpatient medical costs due to comorbidities, posttreatment care costs, and hospice care) not included as drug treatment nor AE costs associated with the first-line regimens in the model. Total disease costs were the sum of disease costs accumulated during and after treatment. Disease costs during first-line therapy were accumulated while receiving one of the specified regimens and derived from Cipriano et al. (2011).32 For patients receiving subsequent lines of therapy (16%, as estimated from Orsini et al.3 and assumed to be similar for all regimens), disease costs during subsequent treatment were estimated using data from a budget impact model of NSCLC second-line treatment33 and the cost of subsequent treatments and their associated AEs. Cancer care costs accumulated after discontinuation of subsequent treatment, or after one of the specified regimens was discontinued if patients did not receive subsequent treatment, were based on posttreatment disease costs estimates by Cipriano et al.32 Posttreatment disease costs accumulated by patients who survived past the first year were added to the total disease cost in the second or third year, as appropriate.
Budget Impact Analysis
Comparing the costs of treating patients in the current and alternative scenarios provided an estimate of the financial impact on a health plan’s budget of adding Neci + GCis to the formulary in the first-line setting. Calculated costs were presented as aggregate annual costs to the health plan, per-patient-per-year (PPPY) costs, and per-member-per-month (PMPM) costs, as well as incremental costs for each of the 3 years following the addition of Neci + GCis, after which the budget impact was expected to stabilize pending introduction of new therapies to the market.
The total costs to the health plan were computed by multiplying the target population by the market shares for each specified first-line treatment regimen by the average per-patient costs for each regimen and then summing across all regimens. The PMPM cost was calculated by dividing the total cost to the plan by the number of members in the plan, then dividing by 12 months. The PPPY costs were calculated by dividing the total annual cost to the plan by the number of msqNSCLC patients in the plan. Costs that were assumed to be minimal or equal for all treatments (e.g., costs for grades 1 and 2 AEs) were not included in the analysis.
All costs were expressed in 2015 U.S. dollars. In cases where costs were calculated from Medicare sources, a Medicare- to commercial-reimbursement conversion factor of 1.53 (the 6-year [2008-2013] average hospital payment to cost ratio for private payers vs. Medicare)34 was applied.
Sensitivity Analysis
Since budget impact models are subject to uncertainty, a deterministic one-way sensitivity analysis was performed to examine the effect on model outputs of uncertainty around key parameters. In this sensitivity analysis, 1 parameter was changed at a time using a predefined parameter uncertainty range, and the new incremental cost was calculated. Thus, after analyses were performed using base-case parameter estimates, individual key parameters were varied from their default values using an uncertainty range of ± 10% for parameters where data were leveraged from clinical trials (e.g., AE rates) and ± 25% for parameters with greater uncertainty (e.g., drug costs). This analysis relied on several assumptions, which are itemized in Table 2.
TABLE 2.
Key Model Assumptions
| Assumption |
|---|
| • A constant hazard is assumed for mortality, thus, overall survival is approximated by an exponential curve matching the median survival from the trials. Due to the 1-year time frame, the mean survival during the incident year is calculated from the area under the survival curve up to 1 year. |
| • It was expected that first-line treatment costs would be incurred within 12 months of msqNSCLC diagnosis. |
| • Duration of first-line treatment is assumed to be less than a year for all patients. |
| • In the first year, only incident cases are considered. In subsequent years, survival time equivalent to the difference between the areas under 3-year and 1-year survival curves from the previous year’s population is added to the posttreatment times for each comparator to account for costs accrued by patients who survive beyond a year. |
| • Costs are reported by individual year and, thus, are not discounted. |
| • Demographic characteristics (age, gender, and ethnicity) do not affect dosing, AE rates, duration, or costs of treatment. |
| • Age has the same effect on incidence for all ethnicities. |
| • Plan size, cancer incidence for regimens included in the model, proportions receiving chemotherapy, AE rates, and AE and disease costs do not change from the base year. |
| • All AEs are assumed to be independent, with rates representing the proportion of the cohort that experiences them. |
| • Monthly disease costs per person during and after treatment for necitumumab + gemcitabine and cisplatin and the alternative regimens are the same, so differences in totals are due only to the durations of time on and after treatment. |
| • The possibility of double counting AEs exists if a publication does not indicate that events reported for multiple definitions are separate. |
| • AE costs are applied as 1-time costs to a population based on the AE rates for each treatment and treatment market shares. |
| • There is no vial sharing assumed in the model, thus, wastage is included. |
| • Alternative regimens in the model are based on common doublet chemotherapy regimens for chemotherapy-naive patients with squamous lung cancer. |
AE = adverse event; msqNSCLS = metastatic squamous non-small cell lung cancer.
Results
Budget Impact Analysis
As depicted in Table 3, for a hypothetical 1,000,000-member commercial plan, 74 patients were estimated to be newly diagnosed with msqNSCLC each year, of which 30 patients were expected to be eligible for first-line treatment with chemotherapy in the current or alternative scenario. The estimated total treatment costs, including drug costs, administration, related AEs, and nondrug disease costs are also presented in Table 3. Before the introduction of Neci + GCis, aggregate total annual costs to the commercial payer for treatment of msqNSCLC were estimated to be $3,099,677 ($0.258 PMPM), and average PPPY costs were $134,164. After introduction of Neci + GCis, total annual costs increased slightly to $3,188,071 ($0.266 PMPM), representing an $88,394 ($0.007 PMPM), or 2.9%, cost increase in the first year. Similarly, the average first-year PPPY costs increased by $3,177, or 2.4%.
TABLE 3.
Base-Case Commercial Scenario Results
| Plan population | 1,000,000 | ||||||||
| msqNSCLC patients | 74 | ||||||||
| msqNSCLC patients with first-line therapy | 30 | ||||||||
| Plan Without Necitumumab, $ | |||||||||
| Drug and Admin Cost | AE Cost | Nondrug Disease Cost | Total Cost | PMPM | Average Drug/Admin Cost per Patient | Average AE Cost per Patient | Average Disease Cost per Patient | Average PPPY | |
| Year 1 | 603,955 | 296,697 | 2,199,025 | 3,099,677 | 0.258 | 19,838 | 9,745 | 104,581 | 134,164 |
| Year 2 | 603,955 | 296,697 | 3,029,068 | 3,929,720 | 0.327 | 19,838 | 9,745 | 104,581 | 134,164 |
| Year 3 | 603,955 | 296,697 | 3,183,973 | 4,084,625 | 0.340 | 19,838 | 9,745 | 104,581 | 134,164 |
| Plan with Necitumumab, $ | |||||||||
| Year 1 | 685,766 | 295,329 | 2,206,975 | 3,188,071 | 0.266 | 22,525 | 9,700 | 105,116 | 137,341 |
| Year 2 | 819,668 | 292,161 | 3,054,934 | 4,166,763 | 0.347 | 26,923 | 9,596 | 106,029 | 142,548 |
| Year 3 | 871,342 | 290,378 | 3,226,984 | 4,388,704 | 0.366 | 28,620 | 9,538 | 106,403 | 144,561 |
| Incremental Results, $ | |||||||||
| Incremental Drug and Admin Cost | Incremental AE Cost | Incremental NonDrug Disease Cost | Overall Cost Impact | Incremental PMPM | Average Increase in Drug/Admin Cost per Patient | Average Increase in AE Cost per Patient | Average Increase in Disease Cost per Patient | Average Increase in PPPY | |
| Year 1 | 81,812 | -1,368 | 7,951 | 88,394 | 0.007 | 2,687 | -45 | 535 | 3,177 |
| Year 2 | 215,714 | -4,536 | 25,865 | 237,043 | 0.020 | 7,085 | (149) | 1,448 | 8,384 |
| Year 3 | 267,387 | -6,319 | 43,011 | 304,079 | 0.025 | 8,783 | (208) | 1,822 | 10,397 |
Admin= administration; AE = adverse event; msqNSCLC = metastatic squamous non-small cell lung cancer; PMPM = per member per month; PPPY = per patient per year.
The incremental budget impact for years 2 and 3 was $237,043 ($8,384 PPPY, $0.020 PMPM) and $304,079 ($10,397 PPPY, $0.025 PMPM), representing 6.0% and 7.4% increases in costs over baseline at market shares of 11.8% and 14.7% for Neci + GCis, respectively (Table 3). The increase in total costs from year 1 to year 3 reflects an increase in patient uptake of Neci + GCis, as well as increased annual disease costs due to additional patients surviving in the previous years.
The introduction of Neci + GCis was estimated to increase drug and administration costs by $81,812, or approximately $0.082 PMPM in year 1. While the cost of first-line treatment accounted for a sizable portion of the overall total costs in the current and alternative scenarios (19% and 22%, respectively) for the first year, disease costs represented the largest component (71% and 69%, respectively). This trend was consistent for years 2 and 3. In the current scenario, treatment and AE costs were the same in all 3 years because the distribution of patients among treatments was assumed to remain constant during this time horizon (Table 1). AE costs were slightly higher for Neci + GCis than for GCis, partly driven by AE costs incurred during the single-agent Neci continuation phase of the SQUIRE trial. However, Neci + GCis had lower AE costs than carboplatin-based regimens in the current treatment mix (Table 1). Therefore, as Neci + GCis captured market share from the current treatment mix, particularly the carboplatin-based regimens, the total costs of treating AEs decreased slightly from $296,697 in the current scenario to $295,329 in the alternative scenario for the first year (Table 3).
While the absolute values of estimated costs differed between the commercial and Medicare perspectives, trends were similar. The Medicare perspective had a higher overall incremental budget impact ($438,056 in year 1), but the 3.0% rate of increase was consistent with the increase in the commercial perspective (Appendix B, available in online article). Changes in disease costs and AE costs were consistent in magnitude with the commercial perspective.
Sensitivity Analysis
The univariate sensitivity analysis showed that results were most sensitive to drug and AE toxicity costs per cycle of Neci + GCis. An increase of 25% in the drug cost of Neci resulted in an approximately 25% rise in the incremental cost (Figure 1), while an increase of 10% in AE-related costs for Neci + GCis only increased the incremental total cost by approximately 1% (Figure 2). The only other parameter that had an effect (i.e., at least 1% variation) on the incremental costs was the drug cost of nab-paclitaxel.
FIGURE 1.
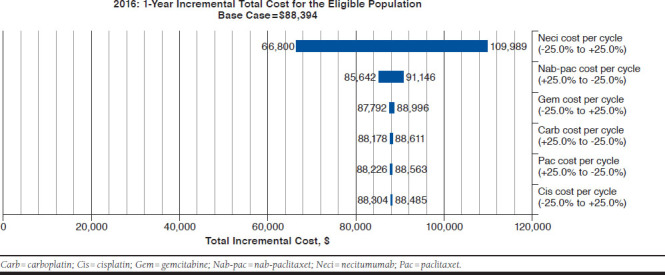
Commercial Scenario Sensitivity Analysis Tornado Diagram: Incremental Total Drug Costs
FIGURE 2.
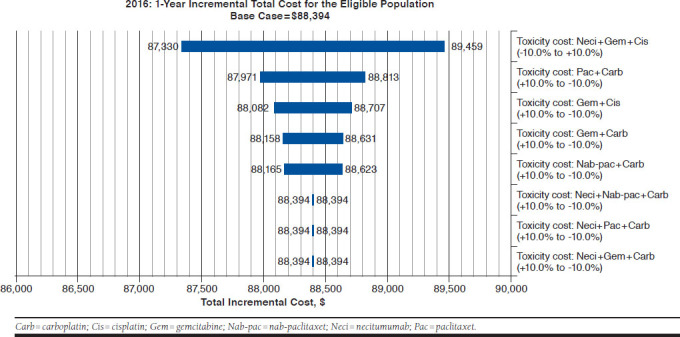
Commercial Scenario Sensitivity Analysis Tornado Diagram: Incremental Total Toxicity Costs
Discussion
BIAs can help those who manage health plan budgets to assess the financial impact of adopting new drugs and can form part of a formal health technology assessment.21 This BIA compared the costs of hypothetical health plan populations with msqNSCLC patients receiving first-line treatment and estimated the budget impact of adding Neci + GCis as a first-line treatment option from U.S. commercial payer and Medicare perspectives. To our knowledge, this is the first analysis that specifically examines the budget impact of first-line treatment for msqNSCLC patients, with standard chemotherapy being used in routine clinical practice in the United States.
Under the model’s assumptions for market shares, results of the BIA suggest that the addition and increasing use of Neci + GCis in a 1,000,000-member health plan would result in budget increases for U.S. commercial payers ranging from $88,394 ($0.007 PMPM) in year 1 to $304,079 ($0.025 PMPM) in year 3, which represents budget increases of 2.8% and 7.4%, respectively. These added costs of expected benefits with Neci + GCis may be considered small and are primarily driven by the small size of the eligible patient population. This modest budget impact highlights that the increased treatment costs associated with Neci are to a large part mitigated by its targeted use in patients with msqNSCLC. Given the therapeutic implications of underlying histology, the subclassification and distinction of NSCLC into squamous and nonsquamous histology subtypes ensures that Neci + GCis is used only in a minority (approximately 30%) of patients with NSCLC who are most likely to benefit most from this treatment. The BIA results were most sensitive to the drug costs for Neci.
The increased total costs to the health plan were largely attributable to increased drug costs for patients receiving Neci + GCis who experienced longer survival and treatment duration in the SQUIRE trial.18,19 Not surprisingly, the magnitude of this increase in drug costs (approximately $0.08 PMPM) did not substantially affect the overall budget for msqNSCLC care, in part, because overall drug costs in the current BIA accounted for a relatively small proportion of total cancer care costs (approximately 21%). In line with published estimates,35 disease costs constituted the majority of total costs, but in the current analysis, these costs only contributed slightly to the budget impact ($2,206,975 with Neci + GCis vs. $2,199,025 without Neci + GCis), since disease costs associated with all regimens in the model were assumed to be similar. The small difference in disease costs between the current and alternative scenarios was due to differences in duration of time on and after first-line treatment between the specified regimens.
Based on results of pivotal trials for the regimens included in the model,18,25,26 some AEs were expected to occur more frequently with Neci (e.g., hypomagnesemia and skin rash), while others seemed to have been more frequent with 1 or more of the other regimens. Notably, rates of hematological AEs such as neutropenia, febrile neutropenia, and thrombocytopenia in the SQUIRE trial were essentially balanced between Neci + GCis and GCis,36 and as expected, rates for these cisplatin-based regimens were generally lower than those associated with carboplatin-based regimens in the respective clinical trials. These differences were accounted for in the current BIA. While it should be noted that hypomagnesemia and skin rash are common and manageable AEs in lung cancer patients, particularly in those receiving epidermal growth factor receptor (EGFR)-targeted therapy, these AEs are associated with a relatively smaller increase in health care resource use compared with the previously mentioned hematological AEs.30 Therefore, the increased cost of AEs associated with the introduction and increased use of Neci + GCis was offset by the reduced cost of AEs associated with the proportional decreased use of the other regimens in the model, particularly carboplatin-based regimens, resulting in a slightly lower overall cost of AEs in the alternative scenario. The reduced AE costs in the alternative scenario offset a small part of the added costs of treatment with Neci + GCis.
A strength of the current BIA lies in its flexibility and consideration of multiple perspectives. Based on current results, the projected financial implications of adding Neci + GCis to the formulary were directionally consistent across the U.S. commercial payer and Medicare perspectives. The differences between perspectives are reflected by small differences in the magnitude of budget impact. While overall costs per patient were higher for the commercial perspective because of higher medical cost inputs for commercial plans, the higher incremental cost PMPM for Medicare ($0.037 vs. $0.007) was due to a higher proportion of Neci + GCis patients eligible for Medicare, since most advanced NSCLC diagnoses occur in patients aged 65 + years.
The comparison of current results to those of the literature is difficult, since, to our knowledge, no other pharmacoeconomic analysis has been published on Neci + GCis after its approval in the United States. Before market entry of Neci + GCis; however, Goldstein et al. (2015) applied a cost-effectiveness framework to establish value-based pricing for new oncology drugs entering the U.S. marketplace and suggested that Neci would need to be priced at 10% of the average price for many new cancer drugs (> $10,000 monthly), based on cost of a quality-adjusted life-year threshold of $100,000-$200,000.37 It is worth noting that Neci and many other oncology drugs in routine practice in the United States are priced above the suggested price and would fare poorly against these cost-effectiveness thresholds, even when in some cases the price is close to or approaches zero.38,39 The current BIA offers complementary information to this cost-effectiveness analysis and estimates whether the health system can ultimately afford the adoption and increased use of Neci.
Limitations
As with any economic model, the validity of the results is only as plausible as the inputs and assumptions made within the model. First, assumptions made in this BIA are unlikely to be applicable to all health plans or payer types with different population distributions, formulary structures, cost-sharing arrangements, or copayment requirements. For instance, while the uptake of Neci + GCis and its effect on market shares for the other regimens in the model were based on rational assumptions, the actual mix of treatments may vary resulting in under- or overestimation of the budget impact in the current analysis. However, these base case assumptions likely result in overestimation of budget impact, since cost-sharing mechanisms are typically designed to reduce financial burden for the health plan.
Second, other scenarios in the first-line treatment setting were not considered in the base-case analysis. For instance, the analysis was restricted to patients who were eligible for first-line chemotherapy, and treatment with EGFR tyrosine kinase inhibitors, ALK inhibitors, or PD-1 inhibitors (e.g., pembrolizumab) was not considered in the model. Thus, current findings could not be generalized to those whose treatment can be selected based on molecular biomarkers such as high PD-L1 expression. In addition, msqNSCLC patients may switch to another front-line agent, receive other potential treatment options not indicated for front-line use in msqNSCLC, or receive treatment for longer duration. Nonetheless, since the model was insensitive to cost of a platinum-doublet regimen, any differences in associated costs for excluded chemotherapy doublet options would not substantially affect the model results.
Third, the model assumed that health plans would incur treatment costs for the full duration of treatment, including wastage, regardless of whether patients received all of their treatment or incurred any copayment fees. Dose changes and delays in treatment administration due to AEs, personal, and other reasons were not accounted for in the model. Hence, the duration and cost of treatment and associated budget impact may have been overestimated, depending on the extent of dosage changes or interruptions. Fourth, there is currently no evidence from head-to-head clinical trials comparing Neci + GCis with other regimens included in the model other than GCis. For the other regimens, clinical information was obtained from their respective clinical trials without formal cross-trial comparison.
Finally, the current BIA was conducted using data from clinical trials that may not fully reflect the real-world experience of msqNSCLC patients. Nevertheless, this BIA, in addition to clinical evidence, provides important information to value-based decision makers from multiple perspectives for evaluation of the potential economic impact of adding Neci + GCis to medical and pharmacy budgets beyond just forecasting market utilization.
Conclusions
Under model assumptions, this BIA estimated a small impact to U.S. health plan budgets of adopting Neci + GCis for first-line treatment of msqNSCLC, primarily because of a relatively small eligible population. The incremental cost is largely driven by increased drug costs for patients receiving Neci + GCis and, in part, because of longer treatment duration, given longer survival with Neci + GCis treatment. Thus, expanding access to Neci + GCis for eligible patients could be an efficient resource allocation for U.S. health payers to optimize first-line msqNSCLC therapy beyond chemotherapy alone. This information should be supplemented with other factors, such as cost-effectiveness and other patient-centered outcomes, to fulfill a complete economic evaluation. Further research is warranted to validate the total direct costs of msqNSCLC in the real world.
ACKNOWLEDGMENTS
The authors thank Stephen L. Able, PhD; Lisa Hess, PhD; and Maciej Gil, MD, at Eli Lilly and Company, and Harry J. Smolen, at Medical Decision Modeling, for valuable contributions to this study and manuscript.
APPENDIX A. Population Breakdown
| Age, Gender, Ethnicity Distribution | SEER NSCLC Incidence Rates | Plan Members × Population Distribution × Annual Incidence/100,000 | ||||
|---|---|---|---|---|---|---|
| Source | U.S. Census Bureau 2011 22 | SEER NSCLC 2011 23 | Calculation | |||
| Non-Hispanic white | Male, % | Female, % | Male | Female | Male | Female |
| Age < 25 | 9.76 | 9.36 | – | 0.01 | – | 0 |
| Age 25-44 | 8.17 | 8.13 | 0.54 | 0.23 | 0 | 0 |
| Age 45-64 | 9.46 | 9.72 | 20.84 | 8.82 | 20 | 9 |
| Age 66+ | 4.50 | 5.69 | 107.30 | 58.13 | 48 | 33 |
| Non-Hispanic black | ||||||
| Age < 25 | 2.87 | 2.86 | – | – | – | – |
| Age 25-44 | 1.68 | 1.98 | 0.78 | 0.13 | 0 | 0 |
| Age 45-64 | 1.40 | 1.71 | 24.08 | 11.23 | 3 | 2 |
| Age 66+ | 0.45 | 0.70 | 136.27 | 50.92 | 6 | 4 |
| Hispanic | ||||||
| Age < 25 | 3.98 | 3.67 | 0.02 | – | 0 | – |
| Age 25-44 | 2.66 | 2.33 | 0.17 | 0.14 | 0 | 0 |
| Age 45-64 | 1.40 | 1.43 | 5.08 | 2.43 | 1 | 0 |
| Age 66+ | 0.40 | 0.53 | 58.70 | 24.57 | 2 | 1 |
| Asian | ||||||
| Age < 25 | 0.91 | 0.90 | – | 0.06 | – | 0 |
| Age 25-44 | 0.79 | 0.87 | 0.23 | 0.21 | 0 | 0 |
| Age 45-64 | 0.56 | 0.64 | 7.07 | 2.61 | 0 | 0 |
| Age 66+ | 0.21 | 0.28 | 62.31 | 16.67 | 1 | 0 |
| Value | Source | Patients | ||||
| Plan members | 1,000,000 | Assumption | Patients with sqNSCLC | 133 | ||
| Proportion advanced/metastatic | 56% | SEER NSCLC 201623 | Patients with advanced/msqNSCLC | 74 | ||
| Proportion receiving first-line chemotherapy | 41% | Orsini 20143 | Patients with msqNSCLC receiving first-line chemotherapy | 30 | ||
msqNSCLC = metastatic squamous non-small cell lung cancer; SEER = Surveillance, Epidemiology, and End Results program; sqNSCLC = squamous non-small cell lung cancer.
APPENDIX B. Base-Case Medicare Scenario Results
| Plan population | 1,000,000 | ||||||||
| msqNSCLC patients | 376 | ||||||||
| msqNSCLC patients with first-line therapy | 154 | ||||||||
| Plan Without Necitumumab, $ | |||||||||
| Drug and Admin Cost | AE Cost | Nondrug Disease Cost | Total Cost | PMPM | Average Drug/Admin Cost per Patient | Average AE Cost per Patient | Average Disease Cost per Patient | Average PPPY | |
| Year 1 | 2,503,629 | 983,052 | 11,148,170 | 14,634,852 | 1.220 | 16,221 | 6,369 | 104,581 | 127,171 |
| Year 2 | 2,503,629 | 983,052 | 15,356,156 | 18,842,838 | 1.570 | 16,221 | 6,369 | 104,581 | 127,171 |
| Year 3 | 2,503,629 | 983,052 | 16,141,463 | 19,628,144 | 1.636 | 16,221 | 6,369 | 104,581 | 127,171 |
| Plan with Necitumumab, $ | |||||||||
| Year 1 | 2,905,911 | 978,519 | 11,188,477 | 15,072,907 | 1.256 | 18,827 | 6,340 | 105,116 | 130,283 |
| Year 2 | 3,562,067 | 968,024 | 15,487,283 | 20,017,374 | 1.668 | 23,079 | 6,272 | 106,029 | 135,380 |
| Year 3 | 3,813,870 | 962,116 | 16,359,511 | 21,135,497 | 1.761 | 24,710 | 6,234 | 106,403 | 137,347 |
| Incremental Results, $ | |||||||||
| Incremental Drug and Admin Cost | Incremental AE Cost | Incremental Nondrug Disease Cost | Overall Cost Impact | Incremental PMPM | Average Increase in Drug/Admin Cost per Patient | Average Increase in AE Cost per Patient | Average Increase in Disease Cost per Patient | Average Increase in PPPY | |
| Year 1 | 402,282 | -4,533 | 40,307 | 438,056 | 0.037 | 2,606 | -29 | 535 | 3,112 |
| Year 2 | 1,058,438 | (15,028) | 131,127 | 1,174,537 | 0.098 | 6,858 | (97) | 1,448 | 8,208 |
| Year 3 | 1,310,241 | (20,936) | 218,048 | 1,507,352 | 0.126 | 8,489 | (136) | 1,822 | 10,175 |
Admin = administration; msqNSCLC = metastatic squamous non-small cell lung cancer; PMPM = per member per month; PPPY = per patient per year.
REFERENCES
- 1.Siegel RL, Miller KD, Jemal A.. Cancer statistics, 2018. CA Cancer J Clin. 2018;68(1):7-30. [DOI] [PubMed] [Google Scholar]
- 2.Houston KA, Henley SJ, Li J, White MC, Richards TB.. Patterns in lung cancer incidence rates and trends by histologic type in the United States, 2004-2009. Lung Cancer. 2014;86(1):22-28. [DOI] [PMC free article] [PubMed] [Google Scholar]
- 3.Orsini LS, Korytowsky B, Petrilla A, et al. Real-world use of systemic anti-cancer treatment by histology and line of therapy in U.S. Medicare patients with advanced non-small cell lung cancer. Int J Radiat Oncol Biol Phys. 2014;90(5 Suppl):S58-S59 [Abstract 232]. Available at: http://www.redjournal.org/article/S0360-3016(14)03954-6/abstract. Accessed April 14, 2018. [Google Scholar]
- 4.Subramanian J, Morgensztern D, Goodgame B, et al. Distinctive characteristics of non-small cell lung cancer (NSCLC) in the young: a surveillance, epidemiology, and end results (SEER) analysis. J Thorac Oncol. 2010;5(1):23-28. [DOI] [PubMed] [Google Scholar]
- 5.Molina JR, Yang P, Cassivi SD, Schild SE, Adjei AA.. Non-small cell lung cancer: epidemiology, risk factors, treatment, and survivorship. Mayo Clin Proc. 2008;83(5):584-94. [DOI] [PMC free article] [PubMed] [Google Scholar]
- 6.Oliver TG, Patel J, Akerley W.. Squamous non-small cell lung cancer as a distinct clinical entity. Am J Clin Oncol. 2015;38(2):220-26. [DOI] [PubMed] [Google Scholar]
- 7.Cetin K, Ettinger DS, Hei Y-J, O’Malley CD.. Survival by histologic subtype in stage IV nonsmall cell lung cancer based on data from the Surveillance, Epidemiology and End Results Program. Clin Epidemiol. 2011;3:139-48. [DOI] [PMC free article] [PubMed] [Google Scholar]
- 8.Hirsch FR, Spreafico A, Novello S, Wood MD, Simms L, Papotti M.. The prognostic and predictive role of histology in advanced non-small cell lung cancer: a literature review. J Thorac Oncol. 2008;3(12):1468-81. [DOI] [PubMed] [Google Scholar]
- 9.Morgensztern D, Waqar S, Subramanian J, Gao F, Govindan R.. Improving survival for stage IV non-small cell lung cancer: a surveillance, epidemiology, and end results survey from 1990 to 2005. J Thorac Oncol. 2009;4(12):1524-29. [DOI] [PubMed] [Google Scholar]
- 10.Johnson DH, Fehrenbacher L, Novotny WF, et al. Randomized phase II trial comparing bevacizumab plus carboplatin and paclitaxel with carboplatin and paclitaxel alone in previously untreated locally advanced or metastatic non-small-cell lung cancer. J Clin Oncol. 2004;22(11):2184-91. [DOI] [PubMed] [Google Scholar]
- 11.Scagliotti G, Novello S, von Pawel J, et al. Phase III study of carboplatin and paclitaxel alone or with sorafenib in advanced non-small-cell lung cancer. J Clin Oncol. 2010;28(11):1835-42. [DOI] [PubMed] [Google Scholar]
- 12.Sanofi. Sanofi provides update on phase 3 studies of two investigational compounds. June 3, 2013. Available at: http://mediaroom.sanofi.com/sanofiprovides-update-on-phase-3-studies-of-two-investigational-compounds/. Accessed April 14, 2018.
- 13.Rizvi NA, Hellmann MD, Brahmer JR, et al. Nivolumab in Combination with platinumbased doublet chemotherapy for first-line treatment of advanced non–small-cell lung cancer. J Clin Oncol. 2016;34(25):2969-79. [DOI] [PMC free article] [PubMed] [Google Scholar]
- 14.Bristol Myers Squibb . Phase 3 trial in squamous non small cell lung cancer subjects comparing ipilimumab versus placebo in addition to paclitaxel and carboplatin. Clinical Trial NCT01285609. August 31, 2016. Available at: https://clinicaltrials.gov/ct2/show/NCT01285609. Accessed April 16, 2018.
- 15.Langer CJ, Obasaju C, Bunn P, et al. Incremental innovation and progress in advanced squamous cell lung cancer: current status and future impact of treatment. J Thorac Oncol. 2016;11(12):2066-81. [DOI] [PubMed] [Google Scholar]
- 16.Reck M, Rodríguez-Abreu D, Robinson AG, et al. Pembrolizumab versus chemotherapy for PD-l1-positive non-small-cell lung cancer. N Engl J Med. 2016;375(19):1823-33. [DOI] [PubMed] [Google Scholar]
- 17.Thatcher N, Hirsch FR, Luft AV, et al. Necitumumab plus gemcitabine and cisplatin versus gemcitabine and cisplatin alone as first-line therapy in patients with stage IV squamous non-small-cell lung cancer (SQUIRE): an open-label, randomised, controlled phase 3 trial. Lancet Oncol. 2015;16(7):763-74. [DOI] [PubMed] [Google Scholar]
- 18.Reck M, Socinski MA, Luft A, et al. The effect of necitumumab in combination with gemcitabine plus cisplatin on tolerability and on quality of life: results from the phase 3 SQUIRE trial. J Thorac Oncol. 2016;11(6):808-18. [DOI] [PubMed] [Google Scholar]
- 19.Perez-Moreno P, Brambilla E, Thomas R, Soria J-C.. Squamous cell carcinoma of the lung: molecular subtypes and therapeutic opportunities. Clin Cancer Res. 2012;18(9):2443-51. [DOI] [PubMed] [Google Scholar]
- 20.Keehan SP, Poisal JA, Cuckler GA, et al. National health expenditure projections, 2015-25: economy, prices, and aging expected to shape spending and enrollment. Health Aff (Millwood). 2016;35(8):1522-31. [DOI] [PubMed] [Google Scholar]
- 21.Sullivan SD, Mauskopf JA, Augustovski F, et al. Budget impact analysis—principles of good practice: report of the ISPOR 2012 Budget Impact Analysis Good Practice II Task Force. Value Health. 2014;17(1):5-14. [DOI] [PubMed] [Google Scholar]
- 22.U.S. Census Bureau . Age and sex composition in the United States: 2011. Updated July 6, 2016. Available at: https://www.census.gov/data/tables/2011/demo/age-and-sex/2011-age-sex-composition.html. Accessed May 2, 2018.
- 23.Howlander N, Noone A, Krapcho M, et al. SEER cancer statistics review, 1975-2012. Based on November 2014 SEER data submission, posted to the SEER web site April 2015. National Cancer Institute. Bethesda, MD. Available at: https://seer.cancer.gov/archive/csr/1975_2012/. Accessed April 16, 2018. [Google Scholar]
- 24.Socinski MA, Evans T, Gettinger S, et al. Treatment of stage IV non-small cell lung cancer: diagnosis and management of lung cancer, 3rd ed: American College of Chest Physicians Evidence-Based Clinical Practice Guidelines. Chest. 2013;143(5 Suppl):e341S-68S. [DOI] [PMC free article] [PubMed] [Google Scholar]
- 25.Treat J, Edelman MJ, Belani CP, et al. A retrospective analysis of outcomes across histological subgroups in a three-arm phase III trial of gemcitabine in combination with carboplatin or paclitaxel versus paclitaxel plus carboplatin for advanced non-small cell lung cancer. Lung Cancer. 2010;70(3):340-46. [DOI] [PubMed] [Google Scholar]
- 26.Socinski MA, Okamoto I, Hon JK, et al. Safety and efficacy analysis by histology of weekly nab-paclitaxel in combination with carboplatin as first-line therapy in patients with advanced non-small-cell lung cancer. Ann Oncol. 2013;24(9):2390-96. [DOI] [PubMed] [Google Scholar]
- 27.Centers for Medicare & Medicaid Services . Physician fee schedule search. 2016. Available at: https://www.cms.gov/apps/physician-fee-schedule/search/search-criteria.aspx. Accessed April 16, 2018.
- 28.Truven Health Analytics . RED BOOK Online Database. IBM Micromedex 2.0, (electronic version). Greenwood Village, CO. Available at: http://www.micromedexsolutions.com/. Accessed August 12, 2015.
- 29.Livingston EH, Lee S.. Body surface area prediction in normal-weight and obese patients. Am J Physiol Endocrinol Metab. 2001;281(3):e586-91. [DOI] [PubMed] [Google Scholar]
- 30.Agency for Healthcare Research and Quality . Healthcare Cost and Utilization Project (HCUP). 2015. Available at: https://hcupnet.ahrq.gov. Accessed May 2, 2018. [PubMed]
- 31.U.S. Department of Labor . Bureau of Labor Statistics. Consumer Price Index. All urban consumers, U.S. medical care, January 2016 values. 2016. Available at: http://data.bls.gov/cgi-bin/surveymost?cu. Accessed April 16, 2018.
- 32.Cipriano LE, Romanus D, Earle CC, et al. Lung cancer treatment costs, including patient responsibility, by disease stage and treatment modality, 1992 to 2003. Value Health. 2011;14(1):41-52 [DOI] [PMC free article] [PubMed] [Google Scholar]
- 33.Hess LM, Cinfio FN, Wetmore S, et al. Enhancing the budget impact model for institutional use: a tool with practical applications for the hospital oncology pharmacy. Hosp Pharm. 2016;51(6):452-60. [DOI] [PMC free article] [PubMed] [Google Scholar]
- 34.American Hospital Association . Chart 4.6: Aggregate hospital payment-to-cost ratios for private payers, Medicare and Medicaid, 1994-2014. In: TrendWatch Chartbook 2016. Available at: https://www.aha.org/system/files/research/reports/tw/chartbook/2016/2016chartbook.pdf. Accessed April 16, 2018.
- 35.American Cancer Society . Cancer facts & figures 2015. Atlanta, GA. Available at: https://www.cancer.org/content/dam/cancer-org/research/cancer-facts-and-statistics/annual-cancer-facts-and-figures/2015/cancer-facts-and-figures-2015.pdf. Accessed April 16, 2018.
- 36.Rosell R, Gatzemeier U, Betticher DC, et al. Phase III randomised trial comparing paclitaxel/carboplatin with paclitaxel/cisplatin in patients with advanced non-small-cell lung cancer: a cooperative multinational trial. Ann Oncol. 2002;13(10):1539-49. [DOI] [PubMed] [Google Scholar]
- 37.Goldstein DA, Chen Q, Ayer T, et al. Necitumumab in metastatic squamous cell lung cancer: establishing a value-based cost. JAMA Oncol. 2015;1(9):1293-300. [DOI] [PubMed] [Google Scholar]
- 38.Gilden DM, Kubisiak JM, Pohl GM, et al. Treatment patterns and cost-effectiveness of first line treatment of advanced non-squamous non-small cell lung cancer in Medicare patients. J Med Econ. 2017;20(2):151-61. [DOI] [PubMed] [Google Scholar]
- 39.Bae YHJ, Mullins CD.. Do value thresholds for oncology drugs differ from nononcology drugs? J Manag Care Spec Pharm. 2014;20(11):1086-92. Available at: https://www.jmcp.org/doi/abs/10.18553/jmcp.2014.20.11.1086. [DOI] [PMC free article] [PubMed] [Google Scholar]