

Abstract
BACKGROUND:
Reliance on prescription opioids to manage pain has been associated with increases in diversion, overdose, and addiction. Prevalence of misuse and abuse has been shown to be higher among government-insured populations than commercially insured populations. However, the prevalence and costs of misuse/abuse among the Medicare fee-for-service (FFS) population has not been studied.
OBJECTIVES:
To (a) determine the prevalence and costs of prescription opioid misuse/abuse and (b) evaluate the prevalence and costs associated with those identified as at risk for opioid misuse/abuse in Medicare FFS beneficiaries.
METHODS:
This retrospective case-control study used Medicare claims data for the calendar years of 2010 and 2011 and included Medicare beneficiaries aged at least 18 years. The index date was the date of first diagnosed misuse/abuse or at risk for abuse and had to occur between July 1, 2010, and June 30, 2011, and beneficiaries had to have at least 6 months continuous eligibility before and after the index date. Matching (1:1) was used for comparing opioid misusers/abusers with nonabuser controls, as well as comparing patients at risk for opioid abuse with controls not at risk for abuse. Controls were matched to cases by gender, age, disability, and geographic region. The index date of the control patient was set equal to the index date of the matched case.
RESULTS:
Prevalence of misuse/abuse in the Medicare FFS population was 13.1 per 1,000 persons, with the majority among patients receiving Medicare based on disability (76.2%). The prevalence of at risk for misuse/abuse was 117.4 per 1,000 persons. Approximately half of the Medicare FFS patients used an opioid. Overall total annual unadjusted mean costs of health care resources were significantly greater for abusers than for matched controls ($46,194 vs. $21,964; P < 0.0001), with a mean annual excess cost of $24,230. The overall total adjusted 6-month post-index mean costs of health care resources for abusers was significantly greater than that of matched controls ($33,942 vs. $10,754; P < 0.0001), with a mean excess cost of $23,188.
CONCLUSIONS:
The prevalence of diagnosed abuse among Medicare FFS population (13.1 per 1,000 persons) was higher than other payer groups studied using similar ICD-9-CM codes, and the majority of abuse was among those receiving Medicare based on disability (76.2%). The prevalence of at-risk abuse was 9 times higher than the prevalence of diagnosed abuse. As with other studies, health care resource utilization and costs were significantly greater for diagnosed abuse than matched controls.
What is already known about this subject
Using claims databases to identify misuse and abuse of opioids demonstrates that the prevalence of diagnosed misuse/abuse in the general population ranges from 1.15 per 1,000 persons in commercially insured patients to 8.7 per 1,000 persons in Medicaid patients.
Similar studies demonstrate that diagnosed abuse results in excess health care resource utilization and associated mean excess annual costs of approximately $15,000 per patient.
What this study adds
This study demonstrated that the prevalence of diagnosed abuse among Medicare fee-for-service patients is higher (13.1 per 1,000 persons) than that seen in any other payer groups.
The majority (76.2%) of Medicare fee-for-service patients with diagnosed abuse were receiving Medicare based on a disability.
Pain is a prevalent and costly condition. It is estimated that 126.1 million adults in the United States have experienced some pain in the previous 3 months, and 11.2% (25.3 million adults) suffer from chronic pain.1 The Institute of Medicine estimates that chronic pain costs the United States up to $635 billion annually in medical treatment and lost productivity.2 In the United States, the management of chronic pain has come to rely on prescription opioids because of the demonstrated effectiveness of opioids to manage acute pain and the limitations of therapeutic alternatives.3 This reliance on prescription opioids has been associated with increases in diversion, overdose, and addiction.3 In 2015, more than half (53.7%) of people aged 12 years or older who misused pain relievers in the previous year indicated that they had obtained the pain relievers from a friend or relative for their most recent misuse episode.4 The number of emergency department (ED) visits related to prescription opioid nonmedical use increased 117% from 2005 to 2011—from 168,379 visits in 2005 to 366,181 in 2011.5 From 2000 to 2014, the rate of opioid overdoses tripled, with 28,647 deaths involving an opioid in 2014.6 In 2015, there were 33,091 overdose deaths involving an opioid, which represents a further 15.6% increase in the death rate since 2014.7 The significant increase in 2015 was driven by illicit fentanyl and heroin.7
The epidemic of deaths, nonfatal overdoses, and addiction associated with opioids stem from the misuse and abuse of prescription opioids. However, little is known about the prevalence of the misuse/abuse of prescription opioids partly because of the lack of consensus on the definition of misuse/abuse.8 In 2015, the National Survey on Drug Use and Health estimated that 12.5 million Americans aged ≥ 12 years were past year misusers of pain relievers, that is, 4.7% of the population.4 In 12.1% of the past year misusers,4 the main reason for misuse was to “feel good or get high”—terms often related to abuse.
Insurance claim databases provide an opportunity to evaluate the prevalence of diagnosed abuse through the use of International Classification of Diseases (ICD) codes. Recently, systematic reviews of the costs and prevalence of opioid misuse/abuse as determined by ICD codes were reported.9,10 The economic burden of prescription opioid misuse/abuse on payers has resulted in excess annual costs of approximately $15,000 per patient, and the majority of costs associated with prescription opioid misuse/abuse comes from government-funded systems.9 In 2013, the total economic burden of opioid overdose, abuse, and dependence in the United States was estimated to be $78.5 billion.11
A U.S. Government Accountability Office report (2011) found that about 170,000 Medicare Part D beneficiaries had obtained a prescription for a frequently abused prescription drug from 5 or more medical practitioners (“doctor shopping”) in 2008.12 According to the report, this finding represented about $148 million, or 5%, of the total cost for these drugs.12 Of note, approximately 71% of the beneficiaries identified by the report were eligible for Medicare Part D because of a disability.12 The prevalence and costs of misuse/abuse among the Medicare fee-for-service (FFS) population has not been studied.
The purpose of this study was to determine the prevalence and costs of prescription opioid misuse/abuse within the Medicare FFS population. In addition, we evaluated the prevalence and costs associated with those identified as at risk for opioid abuse, along with the effect of those beneficiaries eligible for Medicare due to a disability.
Methods
This retrospective study used Medicare claims data, including medical, pharmacy, and enrollment information, from 2010 to 2011. Study subjects included Medicare beneficiaries identified as diagnosed or at risk for abuse and matched controls. The index date was the date of the first diagnosis of abuse, at risk for abuse, or opioid use, as applicable.
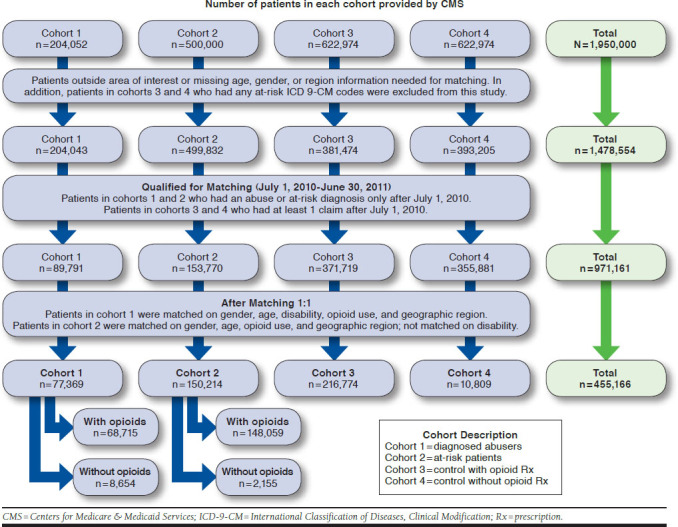
Medicare beneficiary data files for the calendar years of 2010 and 2011 were acquired from the Centers for Medicare & Medicaid Services (CMS). The Medicare beneficiary data is HIPAA compliant. Data files included enrollment/summary files; utilization files including inpatient, skilled nursing facility, outpatient, carrier, durable medical equipment, and Part D event data; and Part D characteristics files, including drug characteristics, plan characteristics, prescriber characteristics, and pharmacy characteristics files. The database was provided by CMS, and no additional data cleaning was performed beyond that provided by CMS. Four cohorts were requested, and eligible patients for the study had Part D data and were not included in managed care for their medical claims. Cohort 1 included those patients with a diagnosis of abuse; cohort 2 included patients at risk for abuse; and cohorts 3 and 4 included controls with and without at least 1 opioid prescription, respectively (Figure 1)
FIGURE 1.
Step-by-Step Identification of Each Cohort for Analysis
The final protocol was reviewed and approved by the institutional review board of the University of Utah as a new study application. The study was conducted in accordance with legal and regulatory requirements, as well as with scientific purpose, value, and rigor and followed generally accepted research practices.
This study included Medicare beneficiaries aged at least 18 years, with an index date between July 1, 2010, and June 30, 2011, and at least 6 months continuous eligibility before and after the index date. Abusers were matched with nonabuser controls, and those at risk for abuse were matched with controls not at risk for abuse. Controls (those without a diagnosis for abuse or at risk for abuse) were selected and matched to cases by gender, age, disability (defined by CMS using the MEDPAR Beneficiary Medicare Status Code and the Disability Insurance Benefit Entitlement to Medicare Justification code), and geographic region (U.S. Census Bureau, https://www2.census.gov/geo/pdfs/maps-data/maps/reference/us_regdiv.pdf).
Cases were matched 1:1 to controls that met the matching criteria. The index date of the control patient was set equal to the index date of the matched case. All analyses were performed using the SAS software version 9.4 (SAS Institute, Cary, NC). Statistical comparisons associated with P values less than 0.05 were considered statistically significant. All study variables are defined further in this study, and the data source for each variable was the CMS dataset.
Demographic and Baseline Characteristics
Demographic and baseline characteristics were compared between cases and controls using McNemar’s test for categorical variables or dichotomous variables and paired t-tests for continuous variables (i.e., age). As a secondary outcome, the presence of medical comorbidities were evaluated for the 6-month period before and after the index date for each patient having at least 6 months of eligibility before and after the index date. Select comorbidities as used in previous studies were evaluated per International Classification of Diseases, Ninth Revision, Clinical Modification (ICD-9-CM) codes.14,15 Medical conditions related to pain were tracked separately from those not unrelated to pain. A pre-index Quan Charlson comorbidity score was computed for each patient.16 Risk of the development of comorbid conditions was compared between cases and controls using McNemar’s test.
Prevalence of Diagnosed Abuse, At Risk for Abuse, and Opioid Use
Diagnosed opioid abusers (cohort 1) were identified based on ICD-9-CM codes 304.0X (opioid type dependence), 304.7X (combinations of opioid abuse with any other), 305.5X (opioid abuse), or 965.00, 965.02, and 965.09 (poisoning by opiates and related narcotics, not heroin). The prevalence of diagnosed opioid abuse was calculated as the number of unique individuals with a claim for opioid abuse divided by the total number of unique enrolled patients for the period of interest.
The cohort for those at risk for abuse (cohort 2) was identified based on previously identified risk factors,13 using ICD-9-CM codes for nonopioid drug abuse or poisoning; mental illness not associated with substance abuse or hepatitis; and/or prescription claims (≥ 6 opioid prescriptions in a 1-year period, ≥ 1 buprenorphine prescription other than Butrans and Belbuca, or ≥ 1 methadone prescription).
The prevalence of at-risk abuse was calculated as the number of unique individuals identified based on related ICD-9-CM codes and/or prescription claims divided by the total number of unique enrolled patients for the period of interest. The prevalence of opioid use was calculated as the number of unique individuals with a claim for opioid use divided by the total number of unique enrolled patients for the period of interest.
Costs of Health Care Resource Use
Resource use and costs were determined for pharmacy, inpatient care, ED visits, and outpatient care in the 6 months before and after the index date. Costs were reported in actual dollars as total medical costs; all costs were those paid by Medicare. All hospitalizations with same day admission and discharge dates were classified as an ED visit. The response variable in each analysis of health care resource utilization and cost category was the total cost (6 months pre-index + 6 months post-index) variable. Differences in cost were compared between cases and controls using multivariable analyses. Specific covariates included in each model were determined by the study team based on clinical rationale and statistical significance.
In general, the statistical significance of each covariate was examined in the univariate regression analysis. Variables associated with x at (P < 0.1) in the univariate analysis were included in the multivariable model, along with relevant clinical variables (regardless of their P values). Adjusted costs 6 months after the index date were adjusted for differences in patient demographics and comorbidities between abusers or at-risk patients and matched controls by claim type, subtotal, and total using multivariate regression analyses.
Because cost data were not normally distributed, a 2-step model was used. In the first step, a logit regression model predicted a probability for each patient of having costs by claim type, as well as for subtotal and total costs based on patient age, gender, race, region, presence of poisonings, and comorbidities. The second step used a log normal regression analysis to estimate conditional costs for patients with nonzero costs also adjusting for age, gender, race, region, poisonings, and comorbidities. This adjusted log transformed cost was retransformed then multiplied by the patient’s probability of having a nonzero cost. This step adjusted the estimated mean cost downward to account for zero cost patients. The Kruskal Wallis test for P values was used.
Following standard procedure, for each model regression, diagnostics was performed to assess goodness of fit and violations of model assumptions (e.g., non-normality and multicollinearity).
Results
There were 53,765,609 Medicare beneficiaries for the 2 most recent years available (2010 and 2011). Of those, 15,526,034 Medicare beneficiaries had Medicare A, B, and D coverage and did not receive health maintenance organization (HMO) coverage (i.e., the population of interest).
Figure 1 summarizes the step-by-step identification of each cohort for analysis. Of the Medicare patients without HMO coverage, CMS provided all patients with a diagnosis of abuse (cohort 1: 204,052), a sample of 500,000 patients meeting the criteria of at risk for abuse (cohort 2), and an equal number of control patients with and without opioids (cohorts 3 and 4, respectively, 622,974 each) to provide a total dataset of 1,950,000 patients. After excluding subjects aged < 18 years; missing age, gender, or region information; outside the area of interest (e.g., Puerto Rico, Virgin Islands, Canada and Islands, Central America and West Indies, Europe, Mexico, and U.S. possessions); and patients from cohorts 3 and 4 with at-risk ICD-9-CM codes, there were 1,478,554 patients available for analysis (471,446 patients were excluded). After excluding patients from cohorts 1 and 2 who had a diagnosis for abuse or at risk for abuse, respectively, before July 1, 2010, and excluding patients from cohorts 3 and 4 who did not have at least 1 claim after July 1, 2010, there were 971,161 patients available for analysis that required matching.
After matching 1:1, there were 455,176 patients available for analysis and divided among the cohorts as follows: cohort 1 (diagnosed abusers), n = 77,369; cohort 2 (at risk for abuse), n = 150,214; cohort 3 (control with opioid use), n = 216,774; and cohort 4 (control without opioid use), n= 10,809.
Demographics and Baseline Characteristics
Table 1 summarizes the demographics and baseline characteristics of the diagnosed abusers and their matched controls. Due to matching, there were no differences between diagnosed abusers and their matched controls with respect to age, gender, region, or disability. The mean age of the diagnosed abusers and matched controls was 56.1 years; 52.9% were female; and most were from the South (41.8%). There were significant differences in Charlson Comorbidity Index (CCI) pain-related comorbidities and those unrelated to pain. Nearly 6 times as many diagnosed abusers than matched controls had a CCI score of ≥ 4. Notable differences were in comorbidities unrelated to pain, where there was at least a 5-fold greater number of diagnosed abusers than matched controls and included other substance abuse, nonopioid poisoning, psychiatric disorders, and hepatitis A, B, and C. Pain-related comorbidities were at least 2-fold greater for diagnosed abusers than nonabusers and included low back pain, other back/neck disorders, fibromyalgia, and headache/migraine.
Table 1.
Demographics and Baseline Characteristics of Diagnosed Abusers and Matched Controlsa
| Variable | Overall (N = 154,738) | Abuser (n = 77,369) | Control (n = 77,369) | P Value |
|---|---|---|---|---|
| Age, years | 56.1 (14.49) | 56.1 (14.49) | 56.1 (14.49) | 1.000 |
| Range | 20-106 | 20-106 | 20-106 | NA |
| Gender | ||||
| Male | 72,830 (47.1) | 36,415 (47.1) | 36,415 (47.1) | 1.000 |
| Female | 81,908 (52.9) | 40,954 (52.9) | 40,954 (52.9) | |
| Region | ||||
| Northeast | 27,056 (17.5) | 13,528 (17.5) | 13,528 (17.5) | 1.000 |
| Midwest | 32,722 (21.1) | 16,361 (21.1) | 16,361 (21.1) | |
| South | 64,636 (41.8) | 32,318 (41.8) | 32,318 (41.8) | |
| West | 30,324 (19.6) | 15,162 (19.6) | 15,162 (19.6) | |
| CCI score | ||||
| 0b | 70,191 (45.4) | 32,010 (41.4) | 38,181 (49.3) | < 0.0001 |
| 1 | 26,920 (17.4) | 9,507 (12.3) | 17,413 (22.5) | |
| 2 | 19,116 (12.4) | 7,309 (9.4) | 11,807 (15.3) | |
| 3 | 12,652 (8.2) | 6,546 (8.5) | 6,106 (7.9) | |
| ≥ 4 | 25,859 (16.7) | 21,997 (28.4) | 3,862 (5.0) | |
| Disability | ||||
| Aged without ESRD | 43,576 (28.2) | 21,788 (28.2) | 21,788 (28.2) | 1.000 |
| Aged with ESRD | 794 (0.5) | 397 (0.5) | 397 (0.5) | 1.000 |
| Disabled without ESRD | 106,992 (69.1) | 53,496 (69.1) | 53,496 (69.1) | 1.000 |
| Disabled with ESRD | 3,196 (2.1) | 1,598 (2.1) | 1,598 (2.1) | 1.000 |
| ESRD only | 180 (0.1) | 90 (0.1) | 90 (0.1) | 1.000 |
| Comorbidities unrelated to pain | ||||
| Other substance abuse | 39,262 (25.4) | 33,270 (43.0) | 5,992 (7.7) | < 0.0001 |
| Nonopioid poisoning | 5,766 (3.7) | 5,168 (6.7) | 598 (0.8) | < 0.0001 |
| Psychiatric disorders | 51,626 (33.4) | 50,240 (64.9) | 1,386 (1.8) | < 0.0001 |
| HIV/AIDS | 3,390 (2.2) | 2,179 (2.8) | 1,211 (1.6) | < 0.0001 |
| Endocarditis | 808 (0.5) | 555 (0.7) | 253 (0.3) | < 0.0001 |
| Skin infections/abscesses | 18,258 (11.8) | 11,779 (15.2) | 6,479 (8.4) | < 0.0001 |
| Gastrointestinal bleed | 32,829 (21.2) | 22,168 (28.7) | 10,661 (13.8) | < 0.0001 |
| Cirrhosis/chronic or acute liver disease | 9,778 (6.3) | 7,304 (9.4) | 2,474 (3.2) | < 0.0001 |
| Hepatitis A, B, C | 5,792 (3.7) | 5,760 (7.4) | 32 (0.0) | < 0.0001 |
| Alcoholic hepatitis | 338 (0.2) | 338 (0.4) | 0 (0) | NA |
| Other hepatitis | 292 (0.2) | 283 (0.4) | 9 (0.0) | < 0.0001 |
| Pancreatitis | 3,204 (2.1) | 2,575 (3.3) | 629 (0.8) | < 0.0001 |
| Sexually transmitted disease | 5,881 (3.8) | 3,405 (4.4) | 2,476 (3.2) | < 0.0001 |
| Herpes simplex | 1,232 (0.8) | 833 (1.1) | 399 (0.5) | < 0.0001 |
| Burns | 980 (0.6) | 719 (0.9) | 261 (0.3) | < 0.0001 |
| Trauma | 45,194 (29.2) | 30,279 (39.1) | 14,915 (19.3) | < 0.0001 |
| Motor vehicle accidents | 1,399 (0.9) | 1,057 (1.4) | 342 (0.4) | < 0.0001 |
| Cormorbidities related to pain | ||||
| Cancer | 13,822 (8.9) | 7,283 (9.4) | 6,539 (8.5) | < 0.0001 |
| Low back pain | 64,687 (41.8) | 45,322 (58.6) | 19,365 (25.0) | < 0.0001 |
| Other back/neck disorders | 51,396 (33.2) | 36,045 (46.6) | 15,351 (19.8) | < 0.0001 |
| Arthritis | 90,118 (58.2) | 53,595 (69.3) | 36,523 (47.2) | < 0.0001 |
| Neuropathic pain | 28,331 (18.3) | 18,459 (23.9) | 9,872 (12.8) | < 0.0001 |
| Fibromyalgia | 16,166 (10.4) | 12,315 (15.9) | 3,851 (5.0) | < 0.0001 |
| Headache/migraine | 21,362 (13.8) | 15,793 (20.4) | 5,569 (7.2) | < 0.0001 |
aValues in this table are shown as mean (%).
bFor patients who did not have any encounters related to defined ICD-9-CM codes for CCI comorbidities during 6-month pre-index period and aged < 60 years,
CCI score is zero.
CCI = Charlson Comorbidity Index; ESRD = end-stage renal disease; HIV/AIDS = human immunodeficiency virus/acquired immunodeficiency syndrome;
ICD-9-CM = International Classification of Diseases, Ninth Revision, Clinical Modification; NA = not applicable.
Table 2 summarizes the demographics and baseline characteristics of patients at risk for abuse and their matched controls. Due to matching, there were no differences between patients at risk for abuse and their matched controls with respect to age, gender, region, or disability. The mean age of at-risk patients and their matched controls was 68.7 years; 67.3% were female; and most were from the South (46.6%). There were significant differences in CCI pain-related comorbidities and those unrelated to pain. There were no at-risk patients with a CCI score of 4+, whereas 3.9% of the matched controls had a CCI score of 4+. Notable differences in comorbidities unrelated to pain, where there was at least a 2-fold greater number of at-risk patients than matched controls, included other substance abuse and hepatitis A, B, and C. Although the differences in pain-related comorbidities was significant between at-risk and matched controls, there were none that had a 2-fold difference or greater.
Table 2.
Demographics and Baseline Characteristics of At-Risk Patients and Matched Controlsa
| Variable | Overall (N = 300,428) | At Risk (n = 150,214) | Control (n = 150,214) | P Value |
|---|---|---|---|---|
| Age, years | 68.7 (14.8) | 68.7 (14.8) | 68.7 (14.8) | 1.000 |
| Gender | ||||
| Male | 98,208 (32.7) | 49,104 (32.7) | 49,104 (32.7) | 1.000 |
| Female | 202,220 (67.3) | 101,110 (67.3) | 101,110 (67.3) | |
| Region | ||||
| Northeast | 37,824 (12.6) | 18,912 (12.6) | 18,912 (12.6) | 1.000 |
| Midwest | 74,846 (24.9) | 37,423 (24.9) | 37423 (24.9) | |
| South | 139,876 (46.6) | 69,938 (46.6) | 69,938 (46.6) | |
| West | 47,882 (15.9) | 23,941 (15.9) | 23,941 (15.9) | |
| CCI score | ||||
| 0b | 69,026 (23.0) | 38,963 (25.9) | 30,063 (20.0) | < 0.0001 |
| 1 | 65,370 (21.8) | 32,810 (21.8) | 32,560 (21.7) | |
| 2 | 82,250 (27.4) | 40,106 (26.7) | 42,144 (28.1) | |
| 3 | 77882 (25.9) | 38,335 (25.5) | 39,547 (26.3) | |
| ≥ 4 | 5,900 (2.0) | 0 (0.0) | 5,900 (3.9) | |
| Disability | ||||
| Aged without ESRD | 195,638 (65.1) | 97,819 (65.1) | 97,819 (65.1) | 1.000 |
| Aged with ESRD | 3,708 (1.2) | 1,854 (1.2) | 1,854 (1.2) | 1.000 |
| Disabled without ESRD | 96,230 (32.0) | 48,115 (32.0) | 48,115 (32.0) | 1.000 |
| Disabled with ESRD | 4,580 (1.5) | 2,290 (1.5) | 2,290 (1.5) | 1.000 |
| ESRD only | 272 (0.1) | 136 (0.1) | 136 (0.1) | 1.000 |
| Cormorbidities unrelated to pain | ||||
| Other substance abuse | 23,998 (8.0) | 16,329 (10.9) | 7,669 (5.1) | < 0.0001 |
| Nonopioid poisoning | 2,616 (0.9) | 1,559 (1.0) | 1,057 (0.7) | < 0.0001 |
| Psychiatric disorders | 1,466 (0.5) | 599 (0.4) | 867 (0.6) | < 0.0001 |
| HIV/AIDS | 2,332 (0.8) | 1,278 (0.9) | 1,054 (0.7) | < 0.0001 |
| Endocarditis | 1,400 (0.5) | 851 (0.6) | 549 (0.4) | < 0.0001 |
| Skin infections/abscesses | 30,323 (10.1) | 17,738 (11.8) | 12,585 (8.4) | < 0.0001 |
| Gastrointestinal bleed | 57,934 (19.3) | 34,809 (23.2) | 23,125 (15.4) | < 0.0001 |
| Cirrhosis/chronic or acute liver disease | 11,347 (3.8) | 6,849 (4.6) | 4,498 (3.0) | < 0.0001 |
| Hepatitis A, B, C | 173 (0.1) | 123 (0.1) | 50 (0.0) | < 0.0001 |
| Alcoholic hepatitis | NA | NA | NA | NA |
| Other hepatitis | 24 (0.0) | 14 (0.0) | 10 (0.0) | 0.4142 |
| Pancreatitis | 3,515 (1.2) | 2,291 (1.5) | 1,224 (0.8) | < 0.0001 |
| Sexually transmitted disease | 8,223 (2.7) | 4,422 (2.9) | 3,801 (2.5) | < 0.0001 |
| Herpes simplex | 1,521 (0.5) | 862 (0.6) | 659 (0.4) | < 0.0001 |
| Burns | 1,102 (0.4) | 668 (0.4) | 434 (0.3) | < 0.0001 |
| Trauma | 74,629 (24.8) | 44,034 (29.3) | 30,595 (20.4) | < 0.0001 |
| Motor vehicle accidents | 1,190 (0.4) | 712 (0.5) | 478 (0.3) | < 0.0001 |
| Comorbidities related to pain | ||||
| Cancer | 37,402 (12.4) | 19,803 (13.2) | 17,599 (11.7) | < 0.0001 |
| Low back pain | 102,521 (34.1) | 63,489 (42.3) | 39,032 (26.0) | < 0.0001 |
| Other back/neck disorders | 80,808 (26.9) | 49,480 (32.9) | 31,328 (20.9) | < 0.0001 |
| Arthritis | 182,506 (60.7) | 102,519 (68.2) | 79,987 (53.2) | < 0.0001 |
| Neuropathic pain | 50,883 (16.9) | 30,658 (20.4) | 20,225 (13.5) | < 0.0001 |
| Fibromyalgia | 20,680 (6.9) | 13,461 (9.0) | 7,219 (4.8) | < 0.0001 |
| Headache/migraine | 25,725 (8.6) | 16,550 (11.0) | 9,175 (6.1) | < 0.0001 |
aValues in this table are presented as mean (%).
bFor patients who did not have any encounters related to defined ICD-9-CM codes for CCI comorbidities during 6-month pre-index period and aged < 60 years,
CCI score is zero.
CCI = Charlson Comorbidity Index; ESRD = end-stage renal disease; HIV/AIDS = human immunodeficiency virus/acquired immunodeficiency syndrome;
ICD-9-CM = International Classification of Diseases, Ninth Revision, Clinical Modification; NA = not applicable.
Prevalence
Table 3 summarizes the Medicare beneficiary population in this study including prevalence. All prevalence information is based on 2-year prevalence. For the years 2010 and 2011, there were 204,052 Medicare FFS patients with a diagnosis of abuse, which corresponds to a 2-year diagnosed abuse prevalence of 13.1 per 1,000 persons (1.3%). Of these, 155,386 (76.2%) were receiving Medicare benefits due to a disability. A total of 1,822,937 Medicare FFS beneficiaries were identified as at risk for abuse, which corresponds to a 2-year at risk for abuse prevalence of 117.4 per 1,000 persons (11.7%). The total number of controls with and without opioid use was 7,970,354 and 7,528,500, respectively. The 2-year prevalence of opioid use among the control population was 514.3 per 1,000 persons (51.4%).
Table 3.
Medicare Beneficiary Population and Prevalence
| Population | Prevalence |
|---|---|
| Total CMS population (2010-2011)a | 53,765,609 |
| CMS population, FFS (2010-2011)b | 15,526,034 |
| Diagnosed abusers, FFS (2010-2011) | 204,052 |
| Diagnosed abuser prevalence (2010-2011) | 13.1 per 1,000 (1.3%) |
| Diagnosed abusers with disability (2010-2011) | 155,386 |
| Proportion of diagnosed abusers with disability | 76.2% |
| At risk for abuse population, FFS (2010-2011) | 1,822,937 |
| At risk for abuse prevalence (2010-2011) | 117.4 per 1,000 (11.7%) |
| Control with opioid use population (2010 2011)c | 7,970,354 |
| Control without opioid use population (2010-2011) | 7,528,500 |
| Total control populationd | 15,498,854 |
| Prevalence of opioid use (2010-2011) | 514.3 per 1,000 (51.4%) |
| Prevalence of nonopioid use (2010-2011) | 485.7 per 1,000 (48.6%) |
aMedicare Beneficiary Summary File.
bDid not include patients who received Parts A and B through a Medicare Advantage plan.
cIncludes diagnosed abuse and at-risk abuse.
dOpioid use population + nonopioid use population.
CMS = Centers for Medicare & Medicaid Services; FFS = fee for service.
Health Care Resource Utilization and Costs of Diagnosed Abusers
Table 4 illustrates the unadjusted costs of health care resources for the abusers and 1:1 matched controls. Costs include patients with zero costs. Overall, there were significantly more pre- and post-index inpatient, outpatient, and ED visits for the diagnosed abusers than for the matched controls. The overall total annual unadjusted mean costs of all health care resources for diagnosed abusers were significantly greater than the matched controls ($46,194 vs. $21,964; P < 0.0001), with a mean annual excess cost of $24,230. Annual costs overall for each category of health care resource for diagnosed abusers were significantly greater than the matched controls (P < 0.0001). These differences were significant overall for each category of health care resource for the 6 months before and after the index date.
Table 4.
Number and Costs of Health Care Resources for Each Cohorta
| Unadjusted Costsb | ||||||
|---|---|---|---|---|---|---|
| Variable | Abusers (n = 77,369) | Controls (n = 77,369) | P Valuec | At Risk (n = 150,214) | Controls (n = 150,214) | P Valuec |
| Inpatients | ||||||
| Pre-index visits | 0.2 (0.6) | 0.1 (0.3) | <0.0001 | 0.1 (0.4) | 0.1 (0.3) | < 0.0001 |
| Post-index visits | 0.3 (0.8) | 0.1 (0.3) | <0.0001 | 0.2 (0.6) | 0.1 (0.3) | < 0.0001 |
| Pre-index costs | 7,042 (36,035) | 2,686 (23,648) | <0.0001 | 5,399 (35,763) | 2,769 (21,807) | < 0.0001 |
| Post-index costs | 12,653 (56,724) | 2,701 (22,759) | <0.0001 | 9,940 (46,119) | 3,151 (21,819) | < 0.0001 |
| Annual costs | 19,695 (72,146) | 5,387 (33,899) | <0.0001 | 15,338 (61,922) | 5,920 (32,111) | < 0.0001 |
| Outpatients | ||||||
| Pre-index visits | 2.8 (4.9) | 1.6 (3.5) | < 0.0001 | 2.4 (4.5) | 1.9 (3.8) | < 0.0001 |
| Post-index visits | 3.0 (5.2) | 1.7 (3.7) | < 0.0001 | 2.9 (5.1) | 1.9 (3.8) | < 0.0001 |
| Pre-index costs | 6,557 (29,744) | 5,387 (32,749) | < 0.0001 | 6,055 (29,122) | 5,634 (31,217) | < 0.0001 |
| Post-index costs | 6,892 (30,797) | 6,365 (37,987) | < 0.0001 | 7,311 (33,033) | 6,000 (32,720) | < 0.0001 |
| Annual costs | 13,449 (55,962) | 11,752 (67,850) | < 0.0001 | 13,366 (57,526) | 11,634 (61,491) | < 0.0001 |
| Emergency | ||||||
| Pre-index visits | 3.4 (7.7) | 0.6 (1.6) | < 0.0001 | 1.1 (2.4) | 0.5 (1.4) | < 0.0001 |
| Post-index visits | 3.9 (7.9) | 0.6 (1.6) | < 0.0001 | 1.7 (3.0) | 0.5 (1.4) | < 0.0001 |
| Pre-index costs | 2,494 (5,634) | 460 (1,372) | < 0.0001 | 805 (1,943) | 389 (1,178) | < 0.0001 |
| Post-index costs | 3,518 (6,496) | 495 (1,410) | < 0.0001 | 1,593 (2,896) | 431 (1,269) | < 0.0001 |
| Annual costs | 6,011 (11,150) | 955 (2,296) | < 0.0001 | 2,398 (4,119) | 820 (1,991) | < 0.0001 |
| Pharmacy | ||||||
| Pre-index costs | 3,520 (4,984) | 1,895 (3,988) | < 0.0001 | 2,520 (3,910) | 1,640 (3,107) | < 0.0001 |
| Post-index costs | 3,518 (5,289) | 1,975 (4,352) | < 0.0001 | 2,601 (3,956) | 1,672 (3,322) | < 0.0001 |
| Annual costs | 7,038 (9,645) | 3,870 (8,086) | < 0.0001 | 5,121 (7,468) | 3,312 (6,230) | < 0.0001 |
| Total cost | ||||||
| Pre-index costs | 19,614 (50,681) | 10,428 (42,599) | < 0.0001 | 14,779 (49,214) | 10,432 (40,314) | < 0.0001 |
| Post-index costs | 26,580 (68,639) | 11,536 (46,794) | < 0.0001 | 21,445 (60,045) | 11,253 (41,581) | < 0.0001 |
| Annual costs | 46,194 (100,608) | 21,964 (80,531) | < 0.0001 | 36,224 (91,735) | 21,685 (74,004) | < 0.0001 |
| Adjusted Post-Index Costsd | ||||||
| Inpatient | 12,600 (11,220) | 2,670 (3,251) | < 0.0001 | 9,861 (7,922) | 3,254 (3,357) | < 0.0001 |
| Outpatient | 7,580 (26,042) | 6,223 (24,559) | < 0.0001 | 7,834 (26,683) | 6,335 (25,254) | < 0.0001 |
| Emergency | 3,476 (2,167) | 509 (397) | < 0.0001 | 1,589 (753.3) | 435 (313) | < 0.0001 |
| Pharmacy | 3,667 (2,659) | 1,914 (1,085) | < 0.0001 | 2,661 (1,529) | 1,642 (944) | < 0.0001 |
| Total | 33,942 (54,445) | 10,754 (17,613) | < 0.0001 | 24,208 (36,164) | 11,692 (21,806) | < 0.0001 |
aValues in this table are shown as mean (SD).
bIncludes patients with zero costs.
cKruskal Wallis test P values for overall abuse versus overall control.
dMedical costs were adjusted for differences in patient demographics and comorbidities between abuse/dependence patients and their matched controls by claim type, subtotal, and total, using multivariate regression analyses. Because cost data are not normally distributed, a 2-step model was used. In the first step, a logit regression model predicted a probability for each patient of having costs by claim type, as well as for subtotal and total costs based on patient age, gender, race, region, poisonings, and comorbidities. The second step used a log normal regression analysis to estimate conditional costs for patients with nonzero costs and also adjusted for age, gender, race, region, poisonings, and comorbidities. This adjusted log transformed cost was retransformed then multiplied by the patient’s probability of having a nonzero cost. This step adjusted the estimated mean cost downward to account for zero cost patients.
SD = standard deviation.
The overall total adjusted 6-month post-index mean costs of all health care resources for diagnosed abusers were significantly greater than the matched controls ($33,942 vs. $10,754; P < 0.0001), with a mean 6-month excess cost of $23,189. The 6-month post-index mean costs overall for each category of health care resource for diagnosed abusers were significantly greater than the matched controls (P < 0.0001). For diagnosed abusers, inpatient costs were $12,600; outpatient costs were $7,580; ED costs were $3,476; and pharmacy costs were $3,667. For matched controls, inpatient costs were $2,670; outpatient costs were $6,223; ED costs were $509; and pharmacy costs were $1,914 (Table 4).
Health Care Resource Utilization and Costs of Patients At Risk for Abuse
Unadjusted costs of health care resources for patients at risk for abuse and 1:1 matched controls included patients with zero costs. Overall, there were significantly more pre- and post-index inpatient, outpatient, and ED visits for the at-risk patients than the matched controls. The overall total annual unadjusted mean costs of all health care resources for at-risk patients were significantly greater than the matched controls ($36,224 vs. $21,685; P < 0.0001), with a mean annual excess cost of $14,539. Annual costs overall for each category of health care resource for at-risk patients were significantly greater than the matched controls (P < 0.0001). For at-risk patients, inpatient costs were $15,338; outpatient costs were $13,366; ED costs were $2,398; and pharmacy costs were $5,121. For matched controls, inpatient costs were $5,920; outpatient costs were $11,634; ED costs were $820; and pharmacy costs were $3,312. These differences were significant overall for each category of health care resource for the 6 months before and after the index date (Table 4).
The adjusted 6-month post-index mean costs of all health care resources for at-risk patients were significantly greater than the matched controls ($24,208 vs. $11,692; P < 0.0001), with a mean 6-month excess cost of $12,637. The 6-month post-index mean costs overall for each category of health care resource for at-risk patients were significantly greater than the matched controls (P < 0.0001). For at-risk patients, inpatient costs were $9,861; outpatient costs were $7,834; ED costs were $1,589; and pharmacy costs were $2,661. For matched controls, inpatient costs were $3,254; outpatient costs were $6,335; ED costs were $435; and pharmacy costs were $1,642 (Table 4).
Discussion
The 2-year diagnosed abuse prevalence of 13.1 per 1,000 (1.3%) is similar to that reported among continuous opioid claimants in a Medicare-eligible population in the Truven Health Analytics Commercial MarketScan database, where the prevalence was 12 per 1,000 persons for 6 months in 2010 and 13 per 1,000 persons for 6 months in 2010-2011.17 However, the prevalence noted in the current study is greater than the 2010 6-month prevalence of 6.35 per 1,000 observed in a Humana Medicare managed care population,18 and it is higher than that reported in Medicaid (8.7 per 1,000 in 2002-2003) and Veterans Health Administration (11.1 per 1,000 in 2006-2010) populations.14,19
This study determined that 76.2% of the diagnosed abusers were receiving Medicare benefits due to a disability. To our knowledge, the extent of Medicare beneficiaries with diagnosed abuse receiving disability-related eligibility has not been reported. However, Dufour et al. (2014) found that 48.9% of the Medicare managed care beneficiaries were aged < 65 years in the first 6 months of 2010.18
A total of 1,822,937 Medicare FFS beneficiaries were identified as at risk for abuse. This number corresponds to a 2-year at risk for abuse prevalence of 117.4 per 1,000 (11.7%). The 2-year prevalence of opioid use among the control population was 514.3 per 1,000 (51.4%), which is higher than the prevalence of opioid use reported in a Humana Medicare population, which was 256.9 per 1,000 persons (25.7%) for the first 6 months of 2010.18
For this study, the health care resources used for the diagnosed abusers were significantly greater before and after the index date for inpatient, outpatient, and ED visits than the matched controls. Consistent with the increase in health care resource use, the overall total adjusted mean costs of all health care resources for diagnosed abusers was significantly greater than the matched controls in the 6 months after the index date ($33,942 vs. $10,754; P < 0.001), which represents an excess adjusted cost of $23,188 for the 6 months after the incident of diagnosed abuse. Similarly, the annual unadjusted mean costs for diagnosed abusers were significantly greater than the matched controls ($46,194 vs. $21,964; P < 0.0001), with a mean annual excess cost of $24,230. Taking into consideration the 204,052 diagnosed abusers identified in 2010-2011, this represents an excess annual cost of nearly $5 billion.
Recent studies indicate that excess costs begin occurring before the diagnosis of abuse and continue for at least a year after diagnosis. Kirson et al. (2017) and Scarpati et al. (2017) evaluated commercially insured beneficiaries during 2012-2015 and found that the monthly excess health care costs began 5 months before the incident of opioid abuse, peaked in the month of the incident of abuse, and continued for a year following the incident and never returned to baseline values.20,21 The mean annual excess cost reported in this study is higher than that reported in a systematic review of commercial and publicly funded programs in which the commercial population had an excess annual cost of $16,058; the Veterans Health Administration was $15,277; and Medicaid was $15,153.9
Health care resource utilization for at-risk patients was significantly greater pre- and post-index, except for pre-index inpatient visits, than the matched controls. Consistent with the increase in health care resource utilization, the overall total annual unadjusted mean costs of all health care resources for at-risk patients were significantly greater than the matched controls ($36,224 vs. $21,685; P < 0.0001), with a mean annual excess cost of $14,539.
The mean age of the diagnosed abusers and matched controls was 56.1 years; 52.9% were female; most were from the South (41.8%); and 71.2% were disabled with or without end stage renal disease. Although Dufour et al. did not report the mean age of diagnosed abusers among the Humana Medicare population, the highest prevalence was among the group aged 35-54 years.18 Rossiter et al. (2014) reported a mean age of 74.2 years among Medicare-eligible patients in the MarketScan data-base.17 In this study, there were significant differences between diagnosed abusers and matched controls for CCI pain-related comorbidities and those unrelated to pain. Rossiter et al. did not find any significant differences between matched abusers and nonabusers in the mean CCI score or select comorbidities, which was likely due to matching on propensity scores.17
Limitations
This study has some limitations to consider. First, the population was limited to those Medicare beneficiaries who had Medicare A, B, and D coverage and did not receive HMO coverage (i.e., FFS patients), so it may not reflect the entire Medicare beneficiary population.
Second, diagnosed abusers were identified through the use of ICD-9-CM codes, which presents several limitations, including the potential for misclassification; no allowance for differentiation between abuse of prescription opioids and abuse of nonprescription (illicit) opioids and reliance on clinician recognition and training in opioid abuse (the extent of this recognition and training among the clinicians is unknown); the underreporting of the total amount of nonmedical use of prescription opioids (i.e., misuse); and the possibility that undiagnosed abusers may have been included in the control group, thereby underrepresenting the amount of true abuse and biasing the control population.
Third, since the groups were not matched based on comorbidities, there could have been differences driving the different costs between the groups. Because methadone is not covered by Medicare Part D for medication-assisted therapy, prescriptions for methadone may have been for pain management. Therefore, the at-risk population may have identified some patients not at risk for abuse.
Finally, the time frame of this study was several years before the publication of the 2016 Centers for Disease Control and Prevention guidelines and the 2017 declaration of a national opioid crisis. Also, patients with cancer, end-of-life pain, or palliative care were not excluded.
Conclusions
This research determined that the prevalence of diagnosed abuse as determined by ICD-9-CM codes was 13.1 per 1,000 persons in the CMS Medicare FFS population, and the majority of diagnosed abuse was among those receiving Medicare based on disability (76.2%). This prevalence is higher than any other payer group studied using similar ICD-9-CM codes. The prevalence of this population at risk for diagnosed abuse was determined to be 9 times higher than the prevalence of diagnosed abuse. As with other studies, health care resource utilization and costs were significantly greater for diagnosed abuse than matched controls, with a mean adjusted 6-month post-index excess cost of $23,188.
References
- 1.Nahin RL. Estimates of pain prevalence and severity in adults: United States, 2012. J Pain. 2015;16(8):769-80. [DOI] [PMC free article] [PubMed] [Google Scholar]
- 2.Institute of Medicine. Relieving pain in America . A blueprint for transforming prevention, care, education, and research. Report brief. June 2011. Available at: http://www.nationalacademies.org/hmd/~/media/Files/Report%20Files/2011/Relieving-Pain-in-America-A-Blueprint-for-Transforming-Prevention-Care-Education-Research/Pain%20Research%202011%20Report%20Brief.pdf. Accessed October 23, 2018.
- 3.Volkow ND, McLellan AT. Opioid abuse in chronic pain—misconceptions and mitigation strategies. N Engl J Med. 2016;374(13):1253-63. [DOI] [PubMed] [Google Scholar]
- 4.Hughes A, Williams MR, Lipari RN, Bose J, Copello EAP, Kroutil LA. Prescription drug use and misuse in the United States: results from the 2015 National Survey on Drug Use and Health. NSDUH Data Review. September 2016. Available at: https://www.samhsa.gov/data/report/prescription-druguse-and-misuse-united-states-results-2015-national-survey-drug-use-and. Accessed October 23, 2018. [Google Scholar]
- 5.Crane EH. The CBHSQ report. Emergency department visits involving narcotic pain relievers. Substance Abuse and Mental Health Services Administration, Center for Behavioral Health Statistics and Quality. 2015. Available at: https://www.ncbi.nlm.nih.gov/books/NBK343537/. Accessed October 23, 2018. [PubMed] [Google Scholar]
- 6.Rudd RA, Aleshire N, Zibbel JE, Gladden RM. Increases in drug and opioid overdose deaths—United States, 2000-2014. MMWR Morb Mortal Wkly Rep. 2016;64(50-51):1378-82. [DOI] [PubMed] [Google Scholar]
- 7.Rudd RA, Seth P, David F, Scholl L. Increases in drug and opioid involved overdose deaths—United States, 2010-2015. MMWR Morb Mortal Wkly Rep. 2016;65(50-51):1445-52. [DOI] [PubMed] [Google Scholar]
- 8.Smith SM, Dart RC, Katz NP, et al. Classification and definition of misuse, abuse, and related events in clinical trials: ACTTION systematic review and recommendations. Pain. 2013;154(11):2287-96. [DOI] [PMC free article] [PubMed] [Google Scholar]
- 9.Oderda GM, Lake J, Rudell K, Roland CL, Masters ET. Economic burden of prescription opioid misuse and abuse: a systematic review. J Pain Palliat Care Pharmacother. 2015;29(4):388-400. [DOI] [PubMed] [Google Scholar]
- 10.Roland CL, Lake J, Oderda GM. Prevalence of prescription opioid misuse/abuse as determined by international classification of disease codes: a systematic review. J Pain Palliat Care Pharmacother. 2016;30(4):258-68. [DOI] [PubMed] [Google Scholar]
- 11.Florence CS, Zhou C, Luo F, Xu L. The economic burden of prescription opioid overdose, abuse, and dependence in the United States, 2013. Med Care. 2016;54(10):901-06. [DOI] [PMC free article] [PubMed] [Google Scholar]
- 12.Government Accountability Office . Medicare Part D: instances of questionable access to prescription drugs. GAO-11-699. September 2011. Available at: https://www.gao.gov/new.items/d11699.pdf. Accessed October 23, 2018. [Google Scholar]
- 13.McAdam-Marx C, Roland CL, Cleveland J, Oderda GM. Costs of opioid abuse and misuse determined from a Medicaid database. J Pain Palliat Care Pharmacother. 2010;24(1):5-18. [DOI] [PubMed] [Google Scholar]
- 14.White AG, Birnbaum HG, Schiller M, Waldman T, Cleveland JM, Roland CL. Economic impact of opioid abuse, dependence, and misuse. Am J Pharm Benefits. 2011;3(4):e59-e70. [DOI] [PubMed] [Google Scholar]
- 15.Quan H, Sundararajan V, Halfon P, et al. Coding algorithms for defining comorbidities in ICD-9-CM and ICD-10 administrative data. Med Care. 2005;43(11):1130-39. [DOI] [PubMed] [Google Scholar]
- 16.Rice JB, White AG, Birnbaum HG, Schiller M, Brown DA, Roland CL.. A model to identify patients at-risk for prescription opioid abuse, dependence, and misuse. Pain Med. 2012;13(9):1162-73. [DOI] [PubMed] [Google Scholar]
- 17.Rossiter LF, Kirson NY, Shei A, et al. Medical cost savings associated with an extended release opioid with abuse deterrent technology in the U.S. J Med Econ. 2014;17(4):279-87. [DOI] [PubMed] [Google Scholar]
- 18.Dufour R, Joshi AV, Pasquale MK, et al. The prevalence of diagnosed opioid abuse in commercial and medicare managed care populations. Pain Pract. 2014;14(3):e106-e115. [DOI] [PubMed] [Google Scholar]
- 19.Baser O, Xie L, Mardekian J, Schaaf D, Wang L, Joshi AV. Prevalence of diagnosed opioid abuse and its economic burden in the Veterans Health Administration. Pain Pract. 2014;14(5):437-45. [DOI] [PubMed] [Google Scholar]
- 20.Kirson NY, Scarpati LM, Enloe CJ, Dincer AP, Birnbaum HG, Mayne TJ. The economic burden of opioid abuse: updated findings. J Manag Care Spec Pharm. 2017;23(4):427-45. Available at: https://www.jmcp.org/doi/10.18553/jmcp.2017.16265. [DOI] [PMC free article] [PubMed] [Google Scholar]
- 21.Scarpati LM, Kirson NY, Jia ZB, Wen J, Howard J. Opioid abuse: a detailed examination of cost drivers over a 24-month follow-up period. J Manag Care Spec Pharm. 2017;23(11):1110-15. Available at: https://www.jmcp.org/doi/10.18553/jmcp.2017.17019. [DOI] [PMC free article] [PubMed] [Google Scholar]