

Abstract
BACKGROUND:
Overactive bladder (OAB) is a common medical condition with significant economic and humanistic burden. Inadequately managed OAB may exacerbate or result in comorbidities such as depression, falls, and urinary tract infections, which can further increase the burden to the health care system. Anticholinergics are often prescribed for management of OAB with urinary incontinence (“wet” OAB). However, research has shown that patient adherence and persistence to anticholinergic therapy is poor, with approximately 80% of patients ultimately failing their first prescribed anticholinergic medication within the first year. While there has been a fair amount of research on the economic burden of OAB, the real-world impact of initiating anticholinergic therapy in patients with wet OAB has not been well studied.
OBJECTIVE:
To compare falls/fractures, anxiety/depression, health care resource utilization, and health care costs between a cohort of patients with wet OAB who initiated anticholinergic therapy and a matched cohort of patients without OAB.
METHODS:
This study was a retrospective medical and pharmacy claims analysis. Cases were members of a primary care-based, multispecialty physician medical group located in California. Cases were eligible for inclusion if they were prescribed anticholinergic therapy between January 2008 and May 2012 based on pharmacy claims, had a diagnosis of OAB, and reported having ≥ 1 urinary incontinence episode per day. Wet OAB cases were matched to non-OAB controls in a 1:3 ratio based on sex, age, and observation time. Medical and pharmacy claims data were used to analyze patient comorbidities, as well as track health care resource utilization (HRU) and direct payer costs.
RESULTS:
After initiating anticholinergic therapy, wet OAB patients had a 46% higher adjusted risk of experiencing falls/fractures (P < 0.001) and a 33% higher adjusted risk of experiencing depression/anxiety (P = 0.022) than non-OAB patients. Wet OAB was significantly associated with increased HRU rates of hospital admissions, outpatient visits, prescriptions filled, and diagnostic tests performed. After adjustment for covariates, total health care cost was 33% higher for wet OAB patients than non-OAB patients, resulting in an increased cost of $1,746 per member per year.
CONCLUSIONS:
The findings of this research suggest OAB patients who initiate anticholinergic therapy and still experience incontinence are at a greater risk for comorbidities such as falls/fractures and depression/anxiety, and use significantly more health care resources, than patients without OAB. Programs to improve patient monitoring and referrals, the appropriate use of alternative treatments within guidelines, and adherence to evidence-based practice parameters may improve clinical outcomes and decrease HRU for these patients.
What is already known about this subject
Anticholinergics are often prescribed for management of wet overactive bladder (OAB). However, research has shown that patient adherence and persistence to anticholinergic therapy is poor, with approximately 80% of patients discontinuing or switching their first prescribed anticholinergic medication within the first year.
OAB significantly impairs patients’ psychosocial functioning and quality of life because of the increased time, cost, and effort required to manage symptoms during daily life. OAB also places a substantial economic burden on health care systems and society. Annual costs of OAB in the United States have been estimated at $65.9 billion, with $51.4 billion in direct medical and non-medical costs and $14.6 billion in indirect costs.
Large cross-sectional epidemiological studies have supported an association between OAB and falls/fractures and between OAB and depression/anxiety.
What this study adds
This study adds a better understanding of the burden of illness among anticholinergic-treated wet OAB patients by comparing their clinical and economic outcomes with non-OAB patients.
The results of this real-world observational study demonstrated that even after initiating anticholinergic therapy, wet OAB patients have substantially greater clinical and economic burden than non-OAB patients.
Overactive bladder (OAB) is defined by the International Continence Society as urgency of urination, with or without urgency urinary incontinence (UI), which is often accompanied by symptoms of urinary frequency and nocturia.1 Approximately 16.5% of American adults have OAB, with 37% of OAB patients also having UI (“wet” OAB).2
Large cross-sectional epidemiological studies have supported an association between OAB and falls/fractures,3,4 and between OAB and depression/anxiety.2,5,6 OAB significantly impairs patients’ psychosocial functioning and quality of life due to the increased time, cost, and effort required to manage symptoms during daily life. OAB also places a substantial economic burden on health care systems and society. Annual costs of OAB in the United States have been estimated at $65.9 billion, with $51.4 billion in direct medical and non-medical costs and $14.6 billion in indirect costs.7
Although anticholinergics are often prescribed for management of wet OAB, they are frequently associated with poor rates of medication persistence; published studies have reported that up to 80% of patients fail their first prescribed anticholinergic medication within the first year due to adverse events and lack of efficacy.8,9 Although the burden of OAB is well documented in the literature from epidemiology studies, there are no real-world studies to date using claims data to evaluate the burden of wet OAB patients who initiated anticholinergic therapy. The objective of this study was to compare clinical outcomes (risk of falls/fractures and anxiety/depression), health care resource utilization, and health care costs between a cohort of patients with wet OAB who initiated anticholinergic therapy and a matched cohort of patients without OAB.
Methods
Setting and Patient Population
Participants were recruited from HealthCare Partners (HCP; now DaVita, Denver, CO), a Southern California-based network of medical groups and physician networks serving approximately 800,000 patients across 66 sites in the greater Los Angeles area with 100 affiliated hospitals. HCP operates a mixed network system (i.e., an employee staff model and a contracted physician association), where records for prescription and medical claims are located in a single integrated database with tracking across health plans and providers. For capitated lives, encounters that are processed through patients’ insurance claims will be captured in HCP’s administrative database. This excludes encounters for non-capitated lives (fee-for-service) and excludes medical records for contracted physician offices and facilities not integrated with HCP’s electronic medical record system. The study population was drawn from a population of capitated patients who have selected HCP as their provider. This allows for the ability to evaluate longitudinal patient outcomes, and track both pharmacy- and medical-related outcomes with continuity of data availability even when a patient changes insurance. In order to eliminate potential confounding lower urinary tract conditions, patients with neurological problems (i.e., multiple sclerosis, spinal cord injury, or stroke), bladder cancer, or enlarged prostate were excluded by screening for the corresponding International Classification of Diseases, Ninth Revision, Clinical Modification (ICD-9-CM) diagnosis codes.
Case Selection
Wet OAB cases were eligible for inclusion if they had an OAB-related diagnosis in a medical claim, based on the presence of ICD-9-CM codes 788.30, 788.31, 788.33, 788.34, 788.36, 788.37, 788.39-788.43, 596.51, or 596.59; and if they initiated anticholinergic therapy as evidenced by at least 1 pharmacy claim between January 2008 and May 2012 (“index date”). Cases were required to have continuous enrollment from 6 months prior to index date (pre-index period) to May 2013. This design ensured that all potential cases would have at least 1 year of follow-up time (index date to May 2013).
Additionally, cases were required to be new users of anti-cholinergics with no history of anticholinergic use during the 6-month pre-index period. Patients found to be eligible based on claims data underwent a verbal questionnaire screening to assess incontinence status eligibility requirements; those who reported having ≥ 1 UI episodes per day that was not predominantly due to stress incontinence were eligible to participate. Eligible patients who provided consent to participate were included in the wet OAB cohort.
Control Selection
The control group was selected from the same eligible source population, but excluded patients with a diagnosis of OAB or UI in a medical claim, and individuals with a pharmacy claim for any anticholinergic medication. Three control patients were randomly matched to cases based on their age (year of birth) and sex. To ensure equal and continuous follow-up time, the matching algorithm used only matched control patients with enrollment coverage beginning at least 6 months prior to the respective case’s index date. Index dates were assigned to controls based on the index date of the matched OAB cases.
Outcomes Measured
All outcomes reported in this analysis were evaluated using administrative claims from index date to May 2013 (follow-up period). Additionally, patient data was captured for the 6-month pre-index period (baseline). This study describes the prevalence of comorbid conditions, health care resource utilization, and health care costs. Though all comorbid conditions were described and reported for each cohort, only the comor-bid outcomes listed a priori in the study design because of their known association with OAB (falls/fractures and depression/anxiety) were formally compared between cohorts using logistic regression. Comorbid conditions were identified with primary, secondary, or tertiary ICD-9-CM codes on at least 1 medical claim.
Health care utilization rates were categorized by the type of medical resource service (inpatient, skilled nursing facility [SNF], emergency room [ER], outpatient, pharmacy, and diagnostic tests). Inpatient and SNF utilization were measured as the number of all-cause admissions. ER utilization was measured as the number of all ER visits. Pharmacy utilization was measured as the number of all prescriptions filled. Outpatient utilization was measured as the number of outpatient visits. The outpatient visits analyzed in this study excluded those believed to be unrelated to OAB (i.e., with specialty fields listed as “durable medical equipment & medical supplies,” “home health,” “pharmacy,” “occupational therapy,” “physical therapy/rehabilitation,” “ambulance,” “pathology,” “optician,” “anesthesiology,” “chiropractic,” or “acupuncture”). Diagnostic tests utilization was measured as the number of diagnostic tests performed. The diagnostic tests selected for in the analysis were any outpatient visits that the specialty field specified “laboratory” or “radiology.”
The direct medical costs were reported by the type of medical resource service and aggregated to evaluate the total health care cost, the primary outcome of interest. Costs were defined from the perspective of the health plan and included total payments made by the health plan to health care providers. Patient copayments and deductibles were not included in the total medical costs. All cost estimates were converted to 2013 U.S. dollars using the Consumer Price Index (CPI) to adjust for inflation.
Outpatient, diagnostic tests, ER, and pharmacy costs were included in the dataset provided by HCP. These costs were calculated using the approved charges variable field in the administrative claims datasets. Inpatient and SNF costs were not included in the dataset and were estimated with other sources. SNF costs were estimated using Medicare’s 2011 daily base rates for urban nursing facilities.10
Contracted rates varied by hospital and were considered proprietary; thus, inpatient costs were estimated using Healthcare Cost and Utilization Project (HCUP) 2011 California State Inpatient Databases urban discharge data (accessed via HCUPnet). HCUP is a family of publicly available databases developed through a federal-state-industry partnership and sponsored by the Agency for Healthcare Research and Quality. The average age-specific per diem cost was estimated for every unique inpatient ICD-9-CM code using HCUP. Inpatient admission cost was estimated by multiplying inpatient primary diagnosis per diem cost by the number of nights the patient remained in the hospital (length of stay). The average inpatient cost across all age groups was utilized in cases where data for a specific age bracket was missing. Admissions with improper and/or missing primary inpatient ICD-9-CM codes were converted to diagnosis-related group codes when possible; otherwise, the second and third inpatient diagnoses were used to estimate cost, respectively. Inpatient admissions with all diagnosis codes missing from HCUP were excluded from the analysis.
Statistical Analysis
The focus of this analysis was to compare the inter-cohort difference in outcomes between patients with wet OAB treated with anticholinergic therapy and patients without OAB. Descriptive summary statistics were obtained for all study outcomes. Bivariate descriptive analyses were conducted to characterize the study population in terms of all demographic, comorbid-ity, medical utilization, and cost measures. Patient counts and percentages were reported for categorical variables, while mean and standard deviation were presented for continuous variables. Chi-square tests were conducted for categorical variables and Student’s t tests were conducted for continuous variables.
Regression models were developed to compare inter-cohort differences in comorbidities, health care resource utilization, and health care costs between wet OAB and non-OAB patients. All multivariate regression models were adjusted for age, sex, follow-up time, pre-index values of the respective outcome variable, and baseline comorbid conditions that differed between groups by P < 0.10.
The comorbid outcomes of interest that this study evaluated were the risk of experiencing falls/fractures and depression/anxiety. Univariate and multivariate logistic regression models were developed to calculate the odds ratio (OR) of fall/fractures and depression/anxiety between the wet OAB and control cohorts.
Health care utilization regression models were created for each health care resource type. Normally, distributed resource utilization outcomes were analyzed using multiple linear regression. Resource utilization outcomes with skewed count data were analyzed using negative binomial distributed generalized linear model (GLM) with a log-link function. Negative binomial was selected as the model distribution based on dispersion of the data. Coefficients for negative binomial models were computed as incidence rate ratios (IRR). Costs were analyzed using gamma-distributed log-link GLM. Coefficients for gamma-distributed cost models were computed as cost ratios (CR).
All analyses were conducted with SAS version 9.3 (SAS Institute, Cary, NC). The a priori type I error rate of 0.05 was used for all analyses. This study was conducted with the approval of Quorum Review Institutional Review Board (approval no. 27283).
Results
A total of 3,793 OAB patients newly initiated on an anticho-linergic between January 2008 and May 2012 were identified, of whom 1,504 agreed to be screened for UI symptoms. Of these, 924 patients met inclusion and exclusion criteria and 580 patients did not. Reasons for exclusion included reporting < 1 UI episode per day (n = 142); reporting predominantly stress incontinence, benign prostatic hyperplasia, or neurological problems (n = 403); and lacking complete claims data in the 6 months prior to index date (n = 35). Of the 959 patients who met eligibility requirements, 620 agreed to participate in the study, and were included in the final analysis (Figure 1).
FIGURE 1.

Recruitment Flow Diagram
Baseline Characteristics
Wet OAB patients were predominantly female (79.2%), with a mean (standard deviation) age of 73.3 (12.5) years. The mean follow-up time (i.e., index date to study end date) was 3.0 years. The non-OAB comparison cohort was matched with the OAB cohort on age, sex, and follow-up time. Thus, the non-OAB cohort population had the same average age, follow-up time, and sex distributions.
At the end of the study, 135 members (21.8%) had commercial insurance, 484 members (78.1%) had Medicare, and 1 member (0.16%) had dual eligibility (commercial and Medicare) in the wet OAB cohort. In the non-OAB cohort, 468 members (25.2%) had commercial insurance, 1,386 members (74.5%) had Medicare, and 6 members (0.3%) had dual eligibility. Since insurance types did not significantly differ, and there were no members with Medi-Cal (Medicaid) coverage, insurance type was not adjusted in subsequent statistical models (Table 1).
TABLE 1.
1 Characteristics of Wet OAB Versus Non-OAB Cohorts
| Characteristic | Wet OAB (n = 620) | No OAB (n = 1,860) | ||
|---|---|---|---|---|
| Female, n (%) | 491 | (79.2) | 1,473 | (79.2) |
| Male, n (%) | 129 | (20.8) | 387 | (20.8) |
| Mean age (SD), years | 73.32 | (12.5) | 73.32 | (12.5) |
| Mean observation time (SD), years | 3.04 | (1.3) | 3.04 | (1.3) |
| Minimum years observed | 1.0 | 1.0 | ||
| Maximum years observed | 5.4 | 5.4 | ||
| Insurance type, n (%) | ||||
| Commercial | 135 | (21.8) | 468 | (25.2) |
| Medicare | 484 | (78.1) | 1,386 | (74.5) |
| Medi-Cal | 0 | (0) | 0 | (0) |
| Dual commercial and Medicare | 1 | (0.2) | 6 | (0.3) |
| Prevalence of comorbid conditions, % (n) | ||||
| Anemia | 7.9 | (49) | 5.5 | (102) |
| Back pain | 18.2 | (113) | 9.7 | (180) |
| Cardiovascular disease | 19.2 | (119) | 18.1 | (336) |
| Cerebrovascular | 5.0 | (31) | 3.8 | (70) |
| Depression and/or anxiety | 17.6 | (109) | 8.3 | (155) |
| Glaucoma | 10.0 | (62) | 9.7 | (181) |
| Diabetes | 28.4 | (176) | 23.1 | (429) |
| Dyslipidemia | 39.0 | (242) | 41.8 | (777) |
| Falls and fractures | 17.1 | (106) | 14.7 | (274) |
| Hypertension | 53.6 | (332) | 44.8 | (833) |
| Joint disorder | 24 | (149) | 13.7 | (255) |
| Hypothyroidism | 12.4 | (77) | 9.5 | (176) |
| Kidney disease | 19.2 | (119) | 20.6 | (383) |
| Obesity | 2.4 | (15) | 1.0 | (19) |
| Urinary tract infection | 25.0 | (155) | 7.9 | (146) |
Notes: Percentages represent the proportion of participants with comorbid conditions in each cohort during the 6-month pre-index observation period.
Chi-square tests and Student’s t-tests were performed to test for statistically significant differences between groups.
Bolded comorbid conditions indicate those with P values < 0.1 and thus adjusted for in all multivariate regression models.
OAB = overactive bladder; SD = standard deviation.
There were significant differences in baseline comorbid conditions between the wet OAB and non-OAB cohorts during the 6-month pre-index observation period. The following comor-bid conditions differed significantly (P < 0.10) between the wet OAB cohort and the non-OAB cohort during the 6-month pre-index observation period and were thus adjusted for in all subsequent multivariate regression models: anemia, back pain, depression/anxiety, diabetes, hypertension, joint disorder, hypothyroidism, obesity, and UTI (Table 1).
Comorbid Conditions
Subsequent to initiating anticholinergic therapy for OAB (post-index), the prevalence of all measured comorbidities was higher in the wet OAB cohort than in the non-OAB control cohort. Comorbidity prevalence was examined using chi-square tests, which found that the wet OAB cohort had significantly (P < 0.05) higher prevalence of all comorbidities assessed except for dyslipidemia, anemia, chronic kidney disease, hypo-thyroidism, and glaucoma (Figure 2).
FIGURE 2.
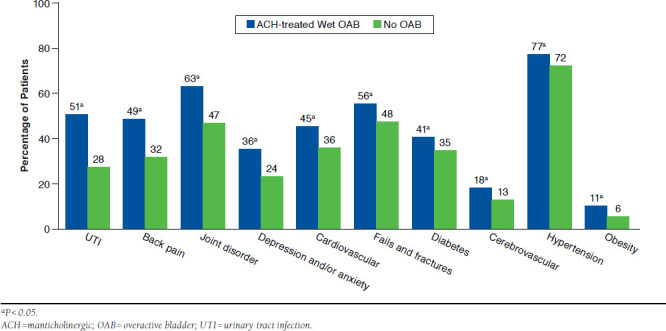
Post-Index Prevalence of Comorbid Conditions for Wet OAB and Non-OAB Cohorts
The comorbidities of interest in this analysis were falls/fractures and depression/anxiety. The prevalence of post-index comorbidities in the wet OAB and non-OAB cohorts, respectively, were 55.7% and 47.5% for falls/fractures (P < 0.001) and 35.7% and 23.6% for depression/anxiety (P < 0.0 01). Results from the multivariate logistic model, which adjusted for baseline differences in age, sex, follow-up time, pre-index values, and baseline comorbid conditions, showed that wet OAB patients were 46% more likely than non-OAB patients to experience falls/fractures (adjusted OR = 1.46, 95% CI = 1.18-1.81, P < 0.001) and were 33% more likely to experience depression/anxiety (adjusted OR = 1.33, 95% CI = 1.04-1.69, P = 0.022; Table 2).
TABLE 2.
Odds Ratio of Falls/Fractures and Depression/Anxiety for Wet OAB Versus Non-OABa
| Occurrence of Falls/Fractures | ||
| Cohort | Adjusted Model OR (95% CI) | P Value |
| No OAB | Reference | - |
| Wet OAB | 1.46 (1.18-1.81) | < 0.001 |
| Occurrence of Depression/Anxiety | ||
| Cohort | Adjusted Model OR (95% CI) | P Value |
| No OAB | Reference | - |
| Wet OAB | 1.33 (1.04-1.69) | 0.022 |
aAnalyzed using multivariate logistic regression model that adjusted for age, sex, follow-up time, pre-index values, and comorbid conditions that differed at baseline.
CI = confidence interval; OAB = overactive bladder; OR = odds ratio
Health Care Resource Utilization
Post-index health care resource utilization rates of all medical service types were higher in the wet OAB cohort than in the non-OAB control cohort. Inter-cohort resource utilization variance was examined using Student’s t-tests, which found the wet OAB cohort had significantly higher (P < 0.05) utilization rates of all medical service types assessed, except for SNF admissions (Table 3).
TABLE 3.
Unadjusted Post-Index Health Care Resource Utilization and Cost for Wet OAB Versus Non-OAB Cohorts
| Post-Index PMPY Utilization and Cost | Wet OAB (n = 620) | No OAB (n = 1,860) | P Valuea |
|---|---|---|---|
| Hospital admissions, n (%) | 304 (49.0) | 700 (37.6) | |
| Hospital admissions (SD) | 0.301 (0.5) | 0.235 (0.4) | 0.001 |
| Hospital cost (SD) | $2,239 (5,121) | $1,719 (5,612) | 0.033 |
| SNF admissions, n (%) | 78 (12.6) | 164 (8.8) | |
| SNF admissions (SD) | 0.054 (0.2) | 0.043 (0.2) | 0.200 |
| SNF cost (SD) | $91 (345) | $77 (428) | 0.432 |
| ER visits, n (%) | 291 (46.9) | 779 (41.9) | |
| ER visits per year (SD) | 1.92 (4.6) | 1.41 (3.5) | 0.003 |
| ER cost (SD) | $330 (1,131) | $193 (621) | 0.004 |
| Outpatient visits, n (%) | 620 (100.0) | 1836 (98.7) | |
| Outpatient visits (SD) | 16.96 (11.0) | 11.25 (8.8) | < 0.001 |
| Outpatient cost (SD) | $2,326 (2,043) | $1,609 (1,885) | < 0.001 |
| Diagnostic tests, n (%) | 617 (99.5) | 1813 (97.5) | |
| Diagnostic tests performed (SD) | 18.61 (13.2) | 14.89 (11.8) | < 0.001 |
| Diagnostic tests cost (SD) | $880 (752) | $648 (667) | < 0.001 |
| Prescriptions filled, n (%) | 620 (100.0) | 1696 (91.2) | |
| Prescriptions filled (SD) | 40.51 (29.5) | 25.34 (23.8) | < 0.001 |
| Pharmacy cost (SD) | $1,697 (2,548) | $1,046 (2,808) | < 0.001 |
| Total health care cost (SD) | $7,562 (7,879) | $5,293 (7840) | < 0.001 |
Note: Values were reported as PMPY means. Costs were reported in 2013 U.S. dollars.
aaMean values were compared using Student’s t-test.
ER = emergency room; OAB = overactive bladder; PMPY = per member per year;
SD = standard deviation; SNF = skilled nursing facility.
Outpatient visits, prescriptions filled, and diagnostic tests performed data were normally distributed and, therefore, analyzed with multiple linear regression models. The multiple linear regression models, which adjusted for baseline differences in age, sex, follow-up time, pre-index values, and comorbid conditions, showed that the wet OAB cohort was significantly associated with increased outpatient visits (P < 0.001), prescriptions filled (P < 0.001), and diagnostic tests performed (P = 0.007; Table 4).
TABLE 4.
Multivariate Utilization and Cost Regression Results for Wet OAB Versus Non-OAB
| Resource Type | Beta Estimate | Standard Error | Wald 95% Confidence Limits | P Valuea | Scaled Deviance | |
|---|---|---|---|---|---|---|
| Health care resource utilization | ||||||
| Hospital admissionsb | 0.18 | 0.07 | 0.04 | 0.33 | 0.012 | 2,179 |
| SNF admissionsb | 0.17 | 0.16 | -0.14 | 0.49 | 0.282 | 809 |
| ER visitsb | 0.07 | 0.11 | -0.15 | 0.28 | 0.550 | 2,063 |
| Outpatient visitsc | 2.50 | 0.35 | 1.81 | 3.18 | < 0.001 | 2,480 |
| Prescriptions filledc | 8.41 | 0.64 | 7.15 | 9.67 | < 0.001 | 2,480 |
| Diagnostic tests performedc | 1.36 | 0.50 | 0.37 | 2.35 | 0.007 | 2,480 |
| Health care costsd | ||||||
| Hospital cost | 0.16 | 0.12 | -0.08 | 0.40 | 0.203 | 3,786 |
| SNF cost | 0.04 | 0.12 | -0.19 | 0.27 | 0.729 | 3,680 |
| ER cost | 0.39 | 0.11 | 0.18 | 0.61 | 0.003 | 3,626 |
| Outpatient cost | 0.27 | 0.04 | 0.19 | 0.35 | < 0.001 | 2,764 |
| Pharmacy cost | 0.72 | 0.06 | 0.60 | 0.85 | < 0.001 | 3,074 |
| Diagnostic test cost | 0.21 | 0.04 | 0.13 | 0.30 | < 0.001 | 2,778 |
| Total health care cost | 0.28 | 0.04 | 0.20 | 0.37 | < 0.001 | 2,795 |
Note: Multivariate model adjustment for age, sex, follow-up time, pre-index values, and comorbid conditions that differed at baseline.
aBold P values < 0.05.
bAnalyzed with negative binomial generalized linear regression model.
cAnalyzed with multiple linear regression model.
dAnalyzed with gamma generalized linear model regression model.
ER = emergency room; OAB = overactive bladder; SNF = skilled nursing facility.
GLMs were developed to analyze associations for resource utilization outcomes with skewed count data. Inpatient admissions, SNF admissions, and ER visits outcomes exhibited over-dispersion as determined by the Cameron and Trivedi test; therefore, these outcomes were evaluated with negative binomial distributed GLMs with log-link functions, which adjusted for baseline differences in age, sex, follow-up time, pre-index values, and comorbid conditions. The negative binomial computes inter-cohort differences as IRR. Results of the adjusted resource utilization GLMs found that wet OAB was associated with 20% increased hospital admissions (adjusted IRR = 1.20, 95% CI = 1.04-1.39, P = 0.012). No significant association was observed between wet OAB and SNF admissions (P = 0.282) or ER visits (P = 0.550; Table 4).
Health Care Costs
Post-index health care costs of all medical service types were higher in the wet OAB cohort than in the non-OAB control cohort. Inter-cohort health care costs were examined using Student’s t-tests and found the wet OAB cohort had significantly higher utilization rates of all medical service types assessed (P < 0.05), except for SNF admissions (P = 0.432). Additionally, when anticholinergic medications were omitted from the analysis, the wet OAB cohort still had significantly higher numbers of prescriptions filled (P < 0.001) and pharmacy costs (P < 0.001) than the non-OAB cohort. Total postindex per member per year (PMPY) health care costs in the wet OAB and non-OAB cohorts, respectively, were $7,562 and $5,292 (P < 0.001; Table 3).
Cost data most closely resembled a gamma distribution as determined by the modified park test; thus, the associations of OAB to health care costs were analyzed with gamma log-link GLM. The cost models compute inter-cohort cost differences as CRs. The results from multivariate gamma-distributed cost models, which adjusted for baseline differences in age, sex, follow-up time, pre-index values, and comorbid conditions, indicated that wet OAB was significantly associated with increased health care costs of all medical service types assessed (P < 0.05), except for inpatient (P = 0.203) and SNF (P = 0.729) costs. The results of GLM for the total health care cost showed that patients in the wet OAB cohort had 33% higher total health care cost PMPY (adjusted CR = 1.33, 95% CI = 1.22-1.45, P < 0.001; Table 4). The adjusted difference (i.e., incremental effect) in mean total health care costs PMPY was $2,821 (P < 0.0 01).
Discussion
The purpose of this study was to evaluate the clinical and economic burden of anticholinergic-treated wet OAB in order to assess unmet therapeutic needs of these patients. It is difficult, and often not possible, to determine disease severity and symptom status using administrative health care claims; however, this study was able to confirm enrolled patients had at least 1 predominantly urge-related UI episode a day by conducting a point-of-contact screening assessment. The OAB patients enrolled in this study reported a mean of 3.5 UI episodes per days.
This study found that after adjusting for differences in baseline comorbidities, anticholinergic-treated wet OAB patients had 46% higher adjusted risk of experiencing falls/fractures (P < 0.001) and 33% higher adjusted risk of experiencing depression/anxiety (P = 0.022) than non-OAB patients. These results were similar with findings of previously published research. Darkow et al. (2005) analyzed the impact of OAB (with or without UI) and associated comorbidities in 11,556 OAB patients (aged ≥ 18 years) and 11,556 controls without OAB.11 Both groups were matched on propensity scores. Researchers found that falls and fractures were more common in OAB patients (25.3% vs. 16.1%), with an adjusted risk of 1.7 (95% CI = 1.6-1.8), and depression was more common (10.5% vs. 4.9%) with OAB individuals being 2.3 times more likely (95% CI = 2.1-2.5) than controls to have depression.11 Cisternas et al. (2009) performed a retrospective Medicare claims analysis for individuals identified as being treated for OAB.12 Researchers found that the OAB group had higher falls/fractures (46% OAB and 34% non-OAB; RR = 1.4, P < 0.001) and depression (21% OAB and 12% non-OAB; RR = 1.8, P < 0.001).12
Wet OAB was significantly associated with increased health care resource utilization rates for hospital admissions, outpatient visits, prescriptions filled, and diagnostic tests performed. Higher pharmacy fills and costs of wet OAB cases may be expected since at least 1 anticholinergic fill was required for study inclusion. However, when anticholinergic medications were omitted from the analysis, the wet OAB cohort still had significantly higher numbers of prescriptions filled pharmacy costs than the non-OAB cohort.
In this study, there was no significant association observed between wet OAB and SNF admissions and costs. This finding was inconsistent with previously published research. Andel et al. (2007) examined risk factors for nursing home placement in Medicare beneficiaries living in Florida.13 The researchers found that incontinence was significantly (P < 0.001) more common in those admitted versus those who stayed in the community. Even in Medicare beneficiaries without dementia, UI (hazard ratio [HR] = 1.30, P = 0.019) was second only to diabetes (HR = 1.39, P = 0.004) in producing an increased risk of nursing home placement.13 The discrepancy between the SNF findings of this study and previously published studies may have been because of underlying differences in sample populations. Additionally, SNF outcomes were insufficiently powered to detect differences owing to small sample size and variable distribution. Possibly because only the SNF admissions that billed patients’ insurance were captured, the proportion of patients with any observed SNF admission was low; only 13% (n = 78) of cases and 9% (n = 164) of controls experienced at least 1 SNF admission during follow-up. Therefore, due to limitations concerning SNF admission and costs, further research examining this association is recommended.
Limitations
Although the major strength of this study was the point-of-contact assessment that allowed for the ability to identify patients with desired UI symptoms, it also introduced potential selection bias. Patients who were wet on the date of anticholin-ergic initiation may have been excluded for reporting less than 1 UI episode at the point of contact. However, < 10% of patients screened were excluded for being dry, indicating that selection bias had minimal impact.
In this study, while the wet OAB group was associated with 20% higher rate of inpatient admissions per year compared with the non-OAB group (P = 0.012), the OAB group had no statistically significant association to average yearly inpatient costs (P = 0.203). This discrepancy may be because of the process in which inpatient costs were estimated. Inpatient costs were calculated using the HCUP California inpatient dataset, which lacked cost estimates for some diagnosis codes. There were 599 unique inpatient diagnosis codes, of which 28 of these codes did not have estimates in HCUP and were omitted (9.0% of inpatient encounters in the dataset were omitted for cases and 10.9% for controls).
Conclusions
This real-world observational study is the first to assess the burden of wet OAB using medical and pharmacy administrative claims data. The results demonstrated that even after initiating anticholinergic therapy, wet OAB patients have substantially greater clinical and economic burden than non-OAB patients. This study found that anticholinergic-treated wet OAB patients had 46% higher adjusted risk of experiencing falls/fractures (P < 0.001) and had 33% higher adjusted risk of experiencing depression/anxiety (P = 0.022) than non-OAB patients. Wet OAB was significantly associated with increased health care resource utilization rates for hospital admissions, outpatient visits, prescriptions filled, and diagnostic tests performed. Total health care cost was 33% higher for wet OAB patients than non-OAB patients after adjustment for covariates, resulting in an incremental cost of $2,821 PMPY.
The findings of this research suggest that wet OAB patients being treated with anticholinergic therapy still have an unmet need as evidenced by the significantly increased economic burden compared with non-OAB controls. Treatment pathways involving alternative treatments, programs to improve patient monitoring, referrals, appropriate throughput of patients within guidelines, and adherence to evidence-based practice parameters may improve disease burden.
ACKNOWLEDGMENTS
The authors thank Lauren Nagy of Evidence Scientific Solutions for providing editorial assistance in preparing the final draft for submission.
Reference
- 1. Haylen BT, de Ridder D, Freeman RM, et al. An International Urogynecological Association (IUGA)/International Continence Society (ICS) joint report on the terminology for female pelvic floor dysfunction. Neurourol Urodyn. 2010;29(1):4-20. Available at: http://onlinelibrary.wiley.com/doi/10.1002/nau.20798/epdf. Accessed December 13, 2015. [DOI] [PubMed] [Google Scholar]
- 2. Stewart WF, Van Rooyen JB, Cundiff GW, et al. Prevalence and burden of overactive bladder in the United States. World J Urol. 2003;20(6):327-36. [DOI] [PubMed] [Google Scholar]
- 3. Brown JS, Vittinghoff E, Wyman JF, et al. Urinary incontinence: does it increase risk for falls and fractures? Study of Osteoporotic Fractures Research Group. J Am Geriatr Soc. 2000;48(7):721-25. [DOI] [PubMed] [Google Scholar]
- 4. Wagner TH, Hu TW, Bentkover J, et al.. Health-related consequences of overactive bladder. Am J Manag Care. 2002;8(19 Suppl):S598-607. [PubMed] [Google Scholar]
- 5. Irwin DE, Milsom I, Kopp Z, Abrams P, Cardozo L. Impact of overactive bladder symptoms on employment, social interactions and emotional well-being in six European countries. BJU Int. 2006;97(1):96-100. Available at: http://onlinelibrary.wiley.com/doi/10.1111/j.1464-410X.2005.05889.x/epdf. Accessed December 13, 2015. [DOI] [PubMed] [Google Scholar]
- 6. Coyne KS, Sexton CC, Irwin DE, Kopp ZS, Kelleher CJ, Milsom I. The impact of overactive bladder, incontinence and other lower urinary tract symptoms on quality of life, work productivity, sexuality and emotional well-being in men and women: results from the EPIC study. BJU Int. 2008;101(11):1388-95. Available at: http://onlinelibrary.wiley.com/doi/10.1111/j.1464-410X.2008.07601.x/epdf. Accessed December 13, 2015. [DOI] [PubMed] [Google Scholar]
- 7. Ganz ML, Smalarz AM, Krupski TL, et al.. Economic costs of overactive bladder in the United States. Urology. 2010;75(3):526-32, 532 e521-518. [DOI] [PubMed] [Google Scholar]
- 8. Yu YF, Nichol MB, Yu AP, Ahn J. Persistence and adherence of medications for chronic overactive bladder/urinary incontinence in the California Medicaid program. Value Health. 2005;8(4):495-505. Available at: http://onlinelibrary.wiley.com/doi/10.1111/j.1524-4733.2005.00041.x/epdf. Accessed December 13, 2015. [DOI] [PubMed] [Google Scholar]
- 9. Brostrøm S, Hallas J. Persistence of antimuscarinic drug use. Eur J Clin Pharmacol. 2009;65(3):309-14. [DOI] [PubMed] [Google Scholar]
- 10. Centers for Medicare & Medicaid Services, Department of Health and Human Services.. 2010. CMS–1338–NC. Medicare Program; Prospective payment systems and consolidated billing for skilled nursing facilities for fiscal year 2011. 75 Federal Register 140 (July 22, 2010), pp. 42866-42942. [Google Scholar]
- 11. Darkow T, Fontes CL, Williamson TE. Costs associated with the management of overactive bladder and related comorbidities. Pharmacotherapy. 2005;25(4):511-19. [DOI] [PubMed] [Google Scholar]
- 12. Cisternas MG, Foreman AJ, Marshall TS, Runken MC, Kobashi KC, Seifeldin R. Estimating the prevalence and economic burden of overactive bladder among Medicare beneficiaries prior to Medicare Part D coverage. Curr Med Res Opin. 2009;25(4):911-19. [DOI] [PubMed] [Google Scholar]
- 13. Andel R, Hyer K, Slack A. Risk factors for nursing home placement in older adults with and without dementia. J Aging Health. 2007;19(2):213-28. [DOI] [PubMed] [Google Scholar]