Abstract
BACKGROUND:
Lipid screening determines eligibility for statins and other cardiovascular risk reduction interventions.
OBJECTIVE:
To examine trends in lipid screening among adults aged ≥20 years in a large, multiethnic, integrated health care delivery system in southern California.
METHODS:
Temporal trends in lipid screening were examined from 2009 to 2015 with an index date of September 30 of each year. Lipid screening was defined as the proportion of eligible members each year who (a) had ever been screened among those aged 20-39 years and (b) had been screened in the previous 6 years for those aged ≥ 40 years. Trends were analyzed by age, gender, and the presence of atherosclerotic cardiovascular disease (ASCVD) or diabetes without ASCVD status.
RESULTS:
More than 2 million individuals were included each year: 5%-6% had ASCVD (includes those with diabetes), 7%-8% had diabetes without ASCVD, and 87% had neither condition. Among the entire population, lipid screening increased from 79.8% in 2009 to 82.6% in 2015 (P < 0.0001). Among those with ASCVD or diabetes, lipid screening was 99% across all years. Among those without ASCVD or DM, screening increased from 76.9% in 2009 to 80.0% in 2015 (P < 0.0001), with higher screening among women compared with men and lower screening among individuals younger than 55 years.
CONCLUSIONS:
Consistently high rates of lipid screening were observed among individuals with ASCVD or diabetes. In individuals without these conditions, screening increased over time. However, there is room to further increase screening rates in adults younger than 55 years.
What is already known about this subject
Lipid screening determines eligibility for statin medications and other cardiovascular risk reduction interventions.
Monitoring trends in lipid screening is important to discovering how shifts in guidelines may have affected screening rates.
What this study adds
The proportion of individuals with lipid screenings increased between 2009 and 2015 in this integrated health care system.
Lipid screening was greater than 90% in high-risk patients with ASCVD or diabetes, although a gap in screening was observed between women and men without these conditions.
There is room to further increase screening rates in adults, especially men younger than 55 years.
Elevated levels of low-density lipoprotein cholesterol (LDL-C) and low levels of high-density lipoprotein cholesterol (HDL-C) are known, significant risk factors for coronary heart disease (CHD).1 Lipid screening is important for identifying high-risk individuals who may benefit from intervention.2-4 Reviews of existing evidence suggest that based on the effectiveness of treatment, reliability of testing, and likelihood of identifying those at increased risk of CHD, screening is effective for middle-aged and older adults and in young adults with additional cardiovascular risk factors.1,5-7
Historical and current recommendations for lipid screening continue to differ in their specifications for addressing lipid-lowering treatment goals, patient preferences for treatment, and cost-effectiveness.8 The 2008 United States Preventive Services Task Force (USPSTF) cholesterol screening guideline recommended 1 baseline lipid screening for younger, lower-risk men (aged 20-35 years) and women (aged 20-45 years) and a minimum screening of every 5 years in higher-risk men 35 years and older and women 45 years and older.9,10 The 2013 American College of Cardiology/American Heart Association (ACC/AHA) Treatment of Blood Cholesterol guideline recommends assessment of traditional atherosclerotic cardiovascular disease (ASCVD) risk factors, including total cholesterol and HDL-C every 4-6 years in adults aged 20-79 years.3 Monitoring trends in lipid screening is important to discovering how shifts in guidelines may have affected lipid screening rates. Therefore, in order to observe the effect of new guidelines on lipid screening rates, secular trends were examined in lipid screening between 2009 and 2015 among adults enrolled in an integrated health care delivery system in southern California.
Methods
Setting and Study Population
This study was conducted among members of Kaiser Permanente Southern California (KPSC), a large, integrated health care delivery system that currently provides care for more than 4.2 million members. The population is diverse and highly representative of the southern California region except for slightly lower representation at the extremes of income and education.11 Data on medical care are captured through structured administrative and clinical databases and electronic health records (EHR). Data from 2009 through 2015 were analyzed for all members aged ≥ 20 years on September 30 (index date) of each study year with continuous membership 12 months before the index date (gap of ≤ 45 days allowed; Figure 1). September 30 was chosen to avoid the transition to International Classification of Diseases, Tenth Revision, Clinical Modification codes on October 1, 2015, and any potential differences in coding.
FIGURE 1.
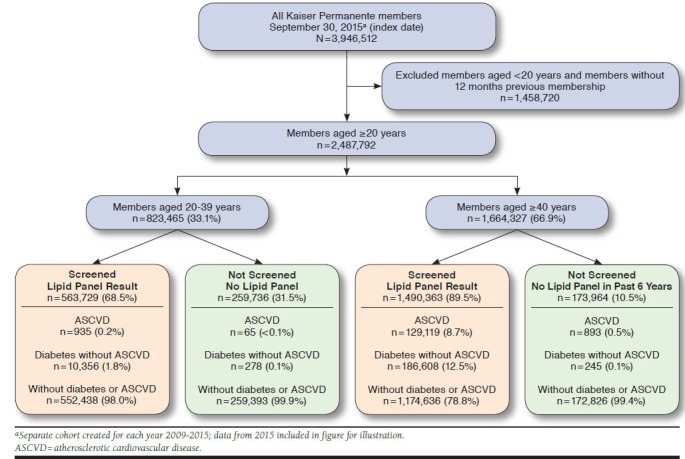
Identification of the Lipid Screening Cohorts, 2015a
Lipid Screening Groups
Patients were hierarchically categorized for each cohort year into 3 groups based on the ACC/AHA guideline: (1) those with ASCVD, (2) those with diabetes but without ASCVD, and (3) those with neither condition. Each year’s cohort was defined independently and hierarchically. Patients could have moved to the ASCVD group in a subsequent year if they had an event, or they could have moved to the group with diabetes if they developed the condition but did not have ASCVD. Clinical ASCVD was defined as acute coronary syndromes, a history of myocardial infarction (MI), stable or unstable angina, coronary or other arterial revascularization, stroke, or peripheral arterial disease to be of atherosclerotic origin based on International Classification of Diseases, Ninth Revision, Clinical Modification (ICD-9-CM) diagnosis and procedure codes in each year. Diabetes was defined as any of the following in the 12 months before the index date in each year: (a) 1 or more primary inpatient discharge diagnoses of ICD-9-CM code 250.x, (b) 2 or more outpatient diagnoses of ICD-9-CM code 250.x occurring on separate dates within 12 months before the index date, or (c) 1 or more dispensed prescriptions for insulin or an oral hypoglycemic agent (excluding use of metformin exclusively without diagnosis of diabetes). Women diagnosed with gestational diabetes within 12 months of the index date were excluded from the definition of diabetes.
Occurrence of Lipid Screening
Lipid screening was defined as the presence of an outpatient laboratory result for LDL-C, total cholesterol, total cholesterol/HDL-C ratio, or a lipid panel and could have occurred as fasting or nonfasting.12 For members aged 20-39 years, lipid screening was examined for each year and defined as the proportion who had ever been screened before the index year. For members aged ≥ 40 years, lipid screening was defined as the proportion who had been screened in the 6 years before the index year.
Patient Characteristics
Patient characteristics including demographics (age, gender, and race/ethnicity), comorbid conditions (Charlson Comorbidity Index and diabetes), statin medication use, body mass index (BMI), health care utilization (ambulatory visits and inpatient encounters), and insurance type (commercial, Medicare, Medicaid, or private pay) were extracted from the EHR and other administrative sources in the 12 months before the index date. The Charlson Comorbidity Index includes MI, peripheral vascular disease, cerebrovascular disease, and diabetes, among other conditions.13
Statistical Analysis
Patient characteristics were calculated as means (standard deviations) or medians and proportions for continuous and categoric variables, respectively, for each year. The proportion screened each year was calculated for the total population and separately for those with ASCVD, those with diabetes without ASCVD, and those without ASCVD or diabetes. Trends over the study period were analyzed by age, gender, and ASCVD and diabetes status. One-sided Cochran-Armitage tests were used to assess temporal trends.
The study protocol was reviewed and approved by the KPSC Institutional Review Board, and a waiver for written informed consent was obtained due to the retrospective nature of the study. Compliance with Health Insurance Portability and Accountability Act regulations was ensured.
Results
More than 2 million adult members aged ≥ 20 years (2,024,326 in 2009 to 2,487,792 in 2015) were included for analysis in each study year (Table 1). Between 2009 and 2015, 5.3%-5.8% of the population had ASCVD, 7.3%-7.9% had diabetes (without ASCVD), and 86.6%-87.0% had neither condition. In the population aged 20-39 years, 0.7%-0.8% had ASCVD, and 5.2%-6.4% had diabetes.
TABLE 1.
Characteristics of All Members and Those with ASCVD and Diabetes or Without Either Condition by Lipid Screening Status, 2009 and 2015
| Condition | Total | ASCVD | Diabetes Without ASCVD | Without ASCVD or Diabetes | ||||||||||||
|---|---|---|---|---|---|---|---|---|---|---|---|---|---|---|---|---|
| Year | 2009 | 2015 | 2009 | 2015 | 2009 | 2015 | 2009 | 2015 | ||||||||
| Total population, N (%) | 2,024,326 (100) | 2,487,792 (100) | 115,768 (5.7) | 131,012 (5.3) | 147,357 (7.3) | 197,487 (7.9) | 1,761,201 (87.0) | 2,159,293 (86.8) | ||||||||
| Age 20-39 years, n (%) | 640,626 (31.6) | 823,465 (33.1) | 905 (0.8) | 1,000 (0.8) | 9,494 (6.4) | 10,634 (5.4) | 630,227 (35.8) | 811,831 (37.6) | ||||||||
| Screened population, n (%) | 1,615,843 (79.8) | 2,054,092 (82.6) | 114,519 (98.9) | 130,054 (99.3) | 146,853 (99.7) | 196,964 (99.7) | 1,354,471 (76.9) | 1,727,074 (80.0) | ||||||||
| Lipid screening test | No | Yes | No | Yes | No | Yes | No | Yes | No | Yes | No | Yes | No | Yes | No | Yes |
| Age, n | ||||||||||||||||
| Mean, years (SD) | 39.3 (14.0) | 51.3 (16.2) | 37.6 (14.4) | 51.6 (17.3) | 65.5 (17.2) | 70.3 (11.8) | 65.4 (17.7) | 71.8 (11.6) | 47.3 (13.8) | 59.3 (12.8) | 42.4 (14.6) | 61.7 (12.9) | 39.2 (13.9) | 48.8 (15.5) | 37.5 (14.3) | 49.0 (16.6) |
| Age group, years, % | ||||||||||||||||
| 20-39 | 54.4 | 25.9 | 59.9 | 27.4 | 5.9 | 0.7 | 6.3 | 0.7 | 31.7 | 6.4 | 53.2 | 5.3 | 54.6 | 30.1 | 60.0 | 32.0 |
| 40-55 | 32.5 | 34.4 | 27.2 | 29.7 | 22.7 | 10.4 | 21.8 | 9.9 | 38.9 | 31.6 | 26.4 | 24.8 | 32.5 | 36.7 | 27.2 | 31.9 |
| 56-65 | 9.0 | 19.9 | 8.7 | 19.5 | 24.7 | 22.7 | 26.0 | 22.3 | 21.2 | 30.5 | 11.5 | 28.9 | 9.0 | 18.5 | 8.7 | 18.5 |
| 66-75 | 2.4 | 11.9 | 2.9 | 14.6 | 15.4 | 30.5 | 15.4 | 30.7 | 6.0 | 20.8 | 5.5 | 27.0 | 2.4 | 9.3 | 2.9 | 11.8 |
| ≥ 76 | 1.6 | 7.9 | 1.3 | 8.8 | 31.2 | 35.6 | 30.5 | 36.3 | 2.2 | 10.7 | 3.4 | 14.0 | 1.5 | 5.3 | 1.2 | 5.9 |
| Gender, % | ||||||||||||||||
| Female | 43.4 | 55.4 | 43.4 | 55.0 | 39.2 | 39.5 | 38.3 | 39.2 | 49.0 | 50.3 | 69.6 | 51.3 | 43.4 | 57.3 | 43.4 | 56.6 |
| Male | 56.6 | 44.6 | 56.6 | 45.0 | 60.8 | 60.5 | 61.7 | 60.8 | 51.0 | 49.7 | 30.4 | 48.7 | 56.6 | 42.7 | 56.6 | 43.4 |
| Race/ethnicity, % | ||||||||||||||||
| White, non-Hispanic | 31.3 | 39.8 | 31.5 | 38.0 | 50.0 | 59.7 | 50.6 | 59.3 | 26.2 | 32.4 | 25.2 | 29.6 | 31.3 | 39.0 | 31.5 | 37.7 |
| Black, non-Hispanic | 7.3 | 10.2 | 6.6 | 9.5 | 14.7 | 11.4 | 14.4 | 11.4 | 10.9 | 13.1 | 9.6 | 12.1 | 7.3 | 9.8 | 6.5 | 9.1 |
| Asian or Pacific Islander | 7.5 | 10.2 | 7.8 | 11.4 | 5.7 | 7.5 | 5.4 | 7.7 | 11.7 | 11.8 | 12.4 | 13.2 | 7.5 | 10.3 | 7.8 | 11.4 |
| Hispanic | 31.2 | 32.7 | 32.1 | 36.5 | 15.9 | 19.5 | 16.9 | 19.9 | 41.1 | 38.6 | 45.5 | 42.2 | 31.3 | 33.1 | 32.1 | 36.9 |
| Multiple/other/unknown | 22.6 | 7.0 | 22.0 | 4.5 | 13.7 | 2.0 | 12.7 | 1.7 | 10.1 | 4.2 | 7.3 | 2.9 | 22.6 | 7.7 | 22.1 | 4.9 |
| Ambulatory visits, %a | ||||||||||||||||
| 0 | 48.5 | 10.4 | 50.6 | 12.1 | 50.0 | 2.8 | 49.1 | 2.8 | 23.0 | 1.7 | 8.8 | 1.7 | 48.5 | 12.0 | 50.6 | 14.0 |
| 1-5 | 39.2 | 47.9 | 37.8 | 48.0 | 30.6 | 24.2 | 30.7 | 24.6 | 38.7 | 31.9 | 23.7 | 32.0 | 39.2 | 51.7 | 37.9 | 51.6 |
| ≥ 6 | 12.3 | 41.7 | 11.6 | 39.8 | 19.5 | 73.0 | 20.3 | 72.6 | 38.3 | 66.4 | 67.5 | 66.3 | 12.2 | 36.4 | 11.5 | 34.3 |
| Hospitalization, %a | ||||||||||||||||
| 0 | 95.6 | 91.5 | 96.3 | 92.8 | 78.8 | 69.7 | 80.2 | 73.3 | 71.2 | 88.3 | 51.6 | 89.2 | 95.7 | 93.7 | 96.3 | 94.7 |
| 1 | 2.8 | 5.8 | 3.3 | 5.4 | 13.1 | 17.0 | 13.0 | 15.6 | 16.1 | 8.4 | 42.1 | 7.9 | 2.8 | 4.6 | 3.2 | 4.3 |
| ≥ 2 | 1.5 | 2.7 | 0.5 | 1.8 | 8.2 | 13.3 | 6.8 | 11.1 | 12.7 | 3.4 | 6.3 | 2.9 | 1.5 | 1.8 | 0.5 | 1.0 |
| Charlson Comorbidity Index score, %a | ||||||||||||||||
| 0 | 94.6 | 69.2 | 94.6 | 65.9 | 71.4 | 19.8 | 68.2 | 14.6 | 38.5 | 3.4 | 49.5 | 3.7 | 94.7 | 80.5 | 94.7 | 76.8 |
| 1 | 4.4 | 15.1 | 4.5 | 16.2 | 12.8 | 19.3 | 15.6 | 17.2 | 47.2 | 40.7 | 34.6 | 35.3 | 4.3 | 12.0 | 4.4 | 13.9 |
| 2 | 0.7 | 7.0 | 0.6 | 7.7 | 7.3 | 16.1 | 8.4 | 16.2 | 10.1 | 23.4 | 10.7 | 24.7 | 0.6 | 4.5 | 0.5 | 5.1 |
| ≥ 3 | 0.4 | 8.6 | 0.3 | 10.2 | 8.5 | 44.8 | 7.9 | 52.0 | 4.2 | 32.6 | 5.2 | 36.3 | 0.4 | 2.9 | 0.3 | 4.1 |
| Health plan type, %a | ||||||||||||||||
| Commercial | 91.1 | 76.3 | 88.8 | 71.1 | 62.1 | 37.5 | 59.0 | 30.9 | 89.5 | 68.1 | 82.4 | 56.8 | 91.2 | 80.5 | 88.9 | 75.7 |
| Medicaid | 0.8 | 1.0 | 2.9 | 3.1 | 0.7 | 0.7 | 2.4 | 1.3 | 1.4 | 1.2 | 5.9 | 3.0 | 0.8 | 1.0 | 2.9 | 3.3 |
| Medicare | 3.2 | 17.9 | 3.4 | 21.4 | 34.3 | 60.1 | 35.8 | 66.2 | 6.2 | 28.5 | 8.0 | 37.8 | 3.1 | 13.2 | 3.3 | 16.2 |
| Private pay | 4.8 | 4.8 | 4.9 | 4.4 | 2.7 | 1.7 | 2.5 | 1.6 | 3.0 | 2.2 | 3.6 | 2.4 | 4.8 | 5.3 | 4.9 | 4.8 |
| Statin use, %a | 0.2 | 26.1 | 0.2 | 27.5 | 10.2 | 77.4 | 9.6 | 79.2 | 15.5 | 75.0 | 9.9 | 76.6 | 0.2 | 16.4 | 0.2 | 18.0 |
| Diabetes mellitus, %a | 0.1 | 11.4 | 0.1 | 11.6 | 0.8 | 32.5 | 1.5 | 34.2 | 100.0 | 100.0 | 100.0 | 100.0 | 0.0 | 0.0 | 0.0 | 0.0 |
| BMI (kg/m2)a | ||||||||||||||||
| Mean (SD) | 27.8 (5.9) | 29.1 (6.4) | 27.6 (6.0) | 29.1 (6.4) | 27.4 (6.3) | 29.1 (6.1) | 27.9 (5.9) | 29.0 (6.1) | 32.2 (7.0) | 32.1 (7.1) | 32.2 (6.9) | 31.9 (7.0) | 27.8 (5.9) | 28.7 (6.2) | 27.6 (6.0) | 28.8 (6.3) |
aMeasurement for 12 months before index date.
ASCVD = atherosclerotic cardiovascular disease; BMI = body mass index; SD = standard deviation.
Characteristics of the population overall and those with ASCVD, diabetes without ASCVD, or neither condition, stratified by lipid screening status for the years 2009 and 2015, are shown in Table 1. In general, patients with ASCVD tended to be older, were more likely to be non-Hispanic white, and were more likely to have Medicare insurance across all years compared with patients with diabetes and patients without ASCVD or diabetes. Patients with diabetes had the highest BMI across all years and were more likely to be Hispanic. Among those who had been screened, 77%-79% with ASCVD, 75%-77% with diabetes, and 16%-18% with neither condition also had a statin prescription during the year in which screening occurred. Patients who were not screened compared with those who were screened in the total population were younger, more likely to be male, more likely to have fewer health care encounters and a lower Charlson Comorbidity Index score across the years, more likely to have commercial insurance, and less likely to have a statin prescription or diabetes. Similar findings were observed for patients with ASCVD, diabetes, and neither condition, except in 2015, where patients with diabetes who were not screened were more likely to be women.
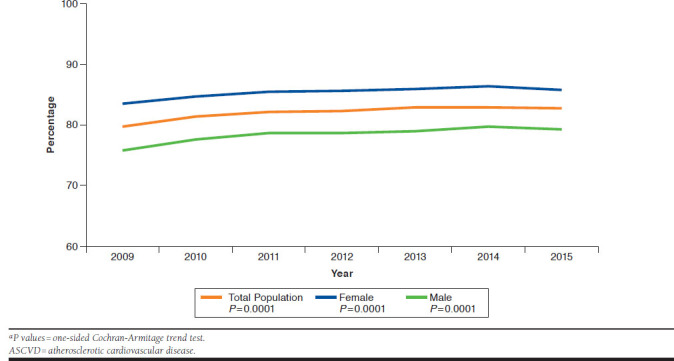
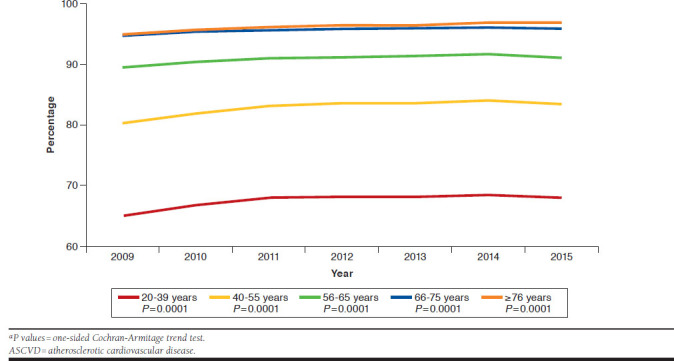
Figures 2-4 show trends in lipid screening among patients with ASCVD, patients with diabetes without ASCVD, and among those with neither condition by age. Lipid screening in the total population increased from 79.8% in 2009 to 82.6% in 2015 (P < 0.0001) and was higher among women compared with men (Appendix A, available in online article). Lipid screening occurred throughout the study period in approximately 99% of patients with ASCVD and with diabetes (without ASCVD) and was similar among men and women. Among those without ASCVD or diabetes, lipid screening was lower but increased from 76.9% in 2009 to 80.0% in 2015 (P < 0.0001). The disparity in lipid screening observed between women and men across the years in the total population was due to those without ASCVD or diabetes; screening among men without ASCVD or diabetes increased from 71.5% in 2009 to 75.4% in 2015 (P < 0.0001) and among women screening increased from 81.5% in 2009 to 83.9% in 2015 (P < 0.0001). Figures 2-4 and Appendix B (available in online article) show differences across age groups that were also found in all populations. Young adults (aged 20-39 years) in the total population and among those without ASCVD or diabetes had the lowest prevalence of lipid screening (65%-68%) across all years. Lower prevalence of lipid screening was also observed in those aged 40-55 years.
FIGURE 2.
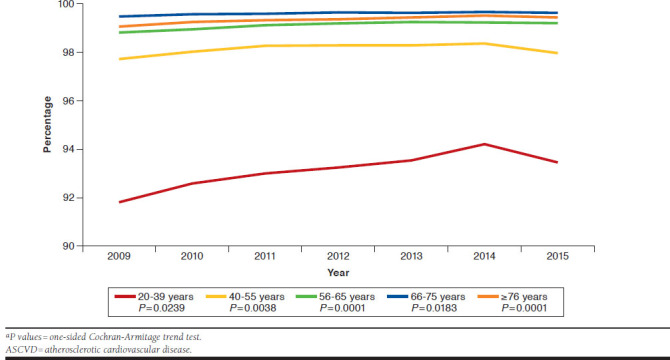
Lipid Screening Among Adults with ASCVD by Age Group, 2009-2015a
FIGURE 4.
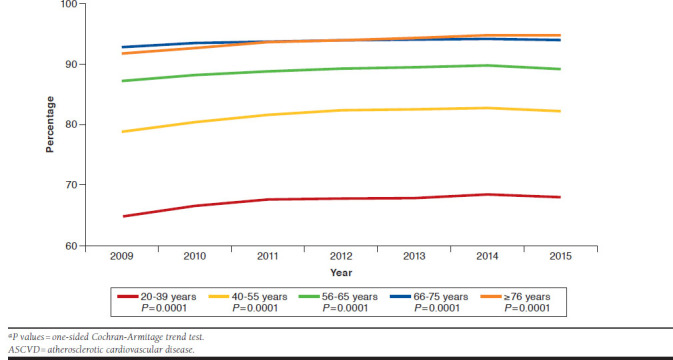
Lipid Screening Among Adults Without ASCVD or Diabetes by Age Group, 2009-2015a
FIGURE 3.
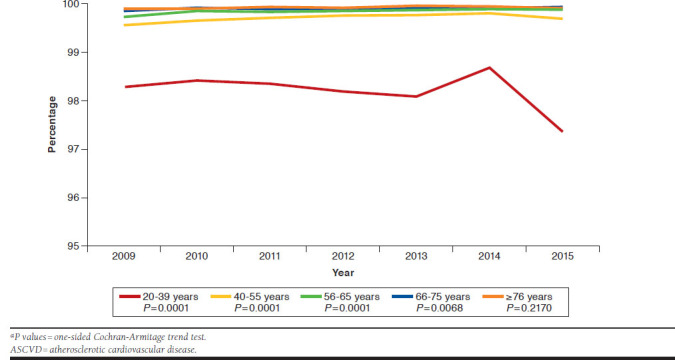
Lipid Screening Among Adults with Diabetes but Without ASCVD by Age Group, 2009-2015a
Discussion
In this integrated, health care delivery system, nearly universal lipid screening was observed among those with ASCVD or diabetes (99%) between 2009 and 2015. High lipid screening (more than 80%) was also observed throughout the study period among those without ASCVD or diabetes. Screening was similar among men and women with ASCVD or diabetes; however, a gap in screening was observed between women and men without either condition, with fewer men being screened. Further, adults younger than 40 years had the lowest rates of screening, which is not surprising given lower health care utilization and misaligned national guidelines on cholesterol screening in this group. Baseline screening and early detection in younger people may play an important role in identifying those at risk for dyslipidemia, including familial hypercholesterolemia. Further, as the prevalence of type 2 diabetes, obesity, dyslipidemia, and hypertension continue to increase in adolescents and young adults, it may become critical to begin lipid screening and monitoring among these age groups.8,14
There is a paucity of data on the prevalence of lipid screening. A 2012 report by the Centers for Disease Control and Prevention examined 2005-2008 National Health and Nutrition Examination Survey data on lipid screening according to the USPSTF guideline indicating that 88.7% of U.S. adults aged ≥ 20 years were eligible for lipid screening and that 68.4% of those eligible for screening self-reported having lipid screening during the previous 5 years.15 More than 94% of adult men were eligible for screening, and two thirds (66.6%) reported having their cholesterol checked within the previous 5 years, while 82.5% of adult women were eligible for screening, and 74.4% reported having their cholesterol checked in the previous 5 years.15 Fang et al (2012) reported data from the 2005-2009 Behavioral Risk Factor Surveillance System (BRFSS) and found that lipid screening increased from 72.7% in 2005 to 76% in 2009 (men 74.5% and women 77.6%).16 As with the present study, these nationally representative studies found higher lipid screening among women compared with men. Using data from 2009 (for similar time comparison), screening in the present study occurred in more than 99% of men and women with ASCVD or diabetes and in about 72% of men and 81% of women without either condition. The high screening rates in the present study may be related to a strong emphasis on preventative care, follow-up, and continuing care in this integrated health system.
The introduction of the 2013 ACC/AHA guideline did not result in a marked increase in screening in this study population. Lipid screening increased or started high and remained high among all members. With nearly universal screening among those with ASCVD or diabetes, it would be difficult to increase the screening rates substantially. In contrast, for those without ASCVD or diabetes and younger than 55 years, additional interventions may be necessary to further improve lipid screening. Jacobson et al (2015) reported that elevated serum cholesterol in early adulthood predicted an increased incidence of coronary heart disease in middle age.6 Thus, reducing cholesterol levels earlier in life may be beneficial for altering downstream or lifetime risk for developing ASCVD. Further, adults with any other ASCVD risk factors may well consider lifetime risk in guiding treatment decisions.6
Recently implemented changes are improving lipid screening rates among those without ASCVD or diabetes in this integrated health care system. New clinical decision support and workflows facilitate lipid panel screening among members who are due for screening but have not yet had it done. KPSC providers and staff are hearing the message to “screen the unscreened, to facilitate treatment of the untreated” (R. D. Scott, personal communication, August 13, 2017). It is anticipated that this additional screening will identify more candidates for cholesterol treatment, which may facilitate successful treatment and reduction of CVD morbidity and mortality.
Limitations
This study has several limitations. First, data were limited to a single health plan based in southern California, so study findings may not be generalizable to other populations, such as uninsured populations or other geographies with different demographic composition. However, the use of EHR and claims data may carry advantages over self-reported lipid screening data (e.g., they do not rely on patient recall). Second, no direct contact was made with patients or health care providers to determine the reason for screening or not screening; therefore, specific barriers may have existed to lipid screening in these populations that remain unknown. Third, some patients may have been misclassified as not being screened if they had been screened before becoming members at KPSC or were screened outside of the system, such as at a community health fair. However, given the high rates of screening in the population, it is unlikely that these situations would apply to many people. Relatively small changes in screening detected in large sample sizes, such as those found in this study, lead to significant P values. However, in this system, the absolute number of people represented by the small overall percentage change over time was about 872,000 individuals, which appears to be a clinically meaningful increase. The primary advantages of this study are that it was conducted in a large, racially and ethnically diverse population in a real-world clinical setting using EHR and claims data.
Conclusions
Very high lipid screening rates were observed in this insured population, especially among those with ASCVD or diabetes without ASCVD. In adults without these conditions, screening increased over time. However, there is room to further increase screening rates, especially in adults younger than 55 years.
APPENDIX A. Lipid Screening Among All Adults by Gender, 2009-2015a
APPENDIX B. Lipid Screening Among All Adults by Age Group, 2009-2015a
REFERENCES
- 1.Pignone MP, Phillips CJ, Atkins D, Teutsch SM, Mulrow CD, Lohr KN. Screening and treating adults for lipid disorders. Am J Prev Med. 2001;20(3):77-89. [DOI] [PubMed] [Google Scholar]
- 2.Expert Panel on Detection, Evaluation, and Treatment of High Blood Cholesterol in Adults . Executive summary of the third report of the National Cholesterol Education Program (NCEP) Expert Panel on Detection, Evaluation, and Treatment of High Blood Cholesterol in Adults (Adult Treatment Panel III). JAMA. 2001;285(19):2486-97. [DOI] [PubMed] [Google Scholar]
- 3.Stone NJ, Robinson JG, Lichtenstein AH, et al. 2013 ACC/AHA guideline on the treatment of blood cholesterol to reduce atherosclerotic cardiovascular risk in adults: a report of the American College of Cardiology/American Heart Association Task Force on Practice Guidelines. J Am Coll Cardiol. 2014;63(25 Pt B):2889-934. [DOI] [PubMed] [Google Scholar]
- 4.Berg AO. Screening adults for lipid disorders. Am J Prev Med. 2001;20(3):73-76. [PubMed] [Google Scholar]
- 5.Tran JN, Kao TC, Caglar T, et al. Impact of the 2013 Cholesterol Guideline on Patterns of Lipid-Lowering Treatment in Patients with Atherosclerotic Cardiovascular Disease or Diabetes After 1 Year. J Manag Care Spec Pharm. 2016;22(8):901-08. Available at: https://www.jmcp.org/doi/10.18553/jmcp.2016.22.8.901. [DOI] [PMC free article] [PubMed] [Google Scholar]
- 6.Jacobson TA, Ito MK, Maki KC, et al. National lipid association recommendations for patient-centered mangement of dyslipidemia: part 1—full report. J Clin Lipidol. 2015;9(2):129-69. [DOI] [PubMed] [Google Scholar]
- 7.Adhyaru BB, Jacobson TA.. New cholesterol guidelines for the management of atherosclerotic cardiovascular disease risk: a comparison of the 2013 American College of Cardiology/American Heart Association cholesterol guidelines with the 2014 National Lipid Association recommendations for patient-centered management of dyslipidemia. Cardiol Clin. 2015;33(2):181-96. [DOI] [PubMed] [Google Scholar]
- 8.Jellinger PS, Handelsman Y, Rosenblit PD, et al. American Association of Clinical Endocrinologists and American College of Endocrinology Guidelines for Management of Dyslipidemia and Prevention of Cardiovascular Disease. Endocr Pract. 2017;23(Suppl 2):1-87. [DOI] [PubMed] [Google Scholar]
- 9.Goff DC Jr, Lloyd-Jones DM, Bennett G, et al. 2013 ACC/AHA guideline on the assessment of cardiovascular risk: a report of the American College of Cardiology/American Heart Association Task Force on Practice Guidelines. J Am Coll Cardiol. 2014;63(25 Pt B):2935-59. [DOI] [PMC free article] [PubMed] [Google Scholar]
- 10.Helfand M, Carson S.. Screening for lipid disorders in adults: selective update of 2001 U.S. Preventive Services Task Force Review. Evidence Synthesis No. 49. AHRQ Publication no. 08-05114-EF-1. Agency for Healthcare Research and Quality. Rockville, MD. April 2008. Available at: https://www.ncbi.nlm.nih.gov/books/NBK33494/. Accessed July 10, 2018. [PubMed] [Google Scholar]
- 11.Koebnick C, Langer-Gould AM, Gould MK, et al. Sociodemographic characteristics of members of a large, integrated health care system: comparison with U.S. Census Bureau data. Perm J. 2012;16(3):37-41. [DOI] [PMC free article] [PubMed] [Google Scholar]
- 12.Driver SL, Martin SS, Gluckman TJ, Clary JM, Blumenthal RS, Stone NJ.. Fasting or nonfasting lipid measurements: it depends on the question. J Am Coll Cardiol. 2016;67(10):1227-34. [DOI] [PubMed] [Google Scholar]
- 13.Deyo RA, Cherkin DC, Ciol MA.. Adapting a clinical comorbidity index for use with ICD-9-CM administrative databases. J Clin Epidemiol. 1992;45(6):613-19. [DOI] [PubMed] [Google Scholar]
- 14.Margolis KL, Greenspan LC, Trower NK, et al. Lipid screening in children and adolescents in community practice: 2007 to 2010. Circ Cardiovasc Qual Outcomes. 2014;7(5):718-26. [DOI] [PMC free article] [PubMed] [Google Scholar]
- 15.Gillespie CD, Keenan NL, Miner JB, Hong Y.. Screening for lipid disorders among adults—National Health and Nutrition Examination Survey, United States, 2005-2008. MMWR Suppl. 2012;61(2):26-31. [PubMed] [Google Scholar]
- 16.Fang J, Ayala C, Loustalot F, Dai S.. Prevalence of cholesterol screening and high blood cholesterol among adults—United States, 2005, 2007, and 2009. MMWR Morb Mortal Wkly Rep. 2012;61:697-702. [PubMed] [Google Scholar]


