

Abstract
BACKGROUND:
Systemic corticosteroids are a leading cause of drug-related complications, yet little has been done to quantify the dose-response relationship between systemic corticosteroid exposure and complications in patients with severe asthma.
OBJECTIVES:
To (a) evaluate the risk of developing systemic corticosteroid-related complications by corticosteroid exposure in severe asthma and (b) quantify the associated health care resource utilization and costs.
METHODS:
This is a retrospective study using administrative claims data from a large commercial database between 2003 and 2014. Multivariate generalized estimating equation models were used to compare corticosteroid-related complications in patients continuously exposed to at least 5 mg of prednisone or equivalent for ≥ 6 months with a 1:1 ratio of propensity score-matched patients with asthma who did not use corticosteroids.
RESULTS:
A total of 12,697 corticosteroid users and as many matched nonusers were identified. The odds of developing associated complications increased significantly in a dose-dependent manner with systemic corticosteroid exposure: odds ratios were 2.50, 2.95, and 3.32 (P values <0.05) for low (defined as < 5 mg/day), medium (≥ 5-10 mg/day), and high (>10 mg/day) exposure, respectively, relative to no exposure. Health care resource utilization increased significantly with levels of systemic corticosteroid exposure. Hence, incidence rate ratios for inpatient visits with low, medium, and high exposure relative to none were estimated to be 1.86, 2.40, and 3.37, respectively (P < 0.05).
CONCLUSIONS:
A significant dose-response relationship was found between the long-term use of systemic corticosteroids and the risk of developing systemic corticosteroid-related complications in patients with severe asthma, resulting in increased burden and costs on the health care system that intensified with systemic corticosteroid exposure.
What is already known about this subject
Long-term use of systemic corticosteroids is a leading cause of drug-related complications.
Asthma patients on maintenance corticosteroids have higher health care costs and notably higher nonmedication and nonasthma-related medication costs.
What this study adds
This study shows that patients with severe asthma had a significantly higher risk of developing systemic corticosteroid-related complications compared with those not exposed to systemic corticosteroids.
The identified risk significantly increased with systemic corticosteroid exposure, resulting in an incremental burden on health care resources, although the benefit of using systemic corticosteroid for asthma control was not assessed in the current study.
Systemic corticosteroids (SCSs) are widely used as frontline treatment in a variety of chronic inflammatory and autoimmune diseases, such as rheumatoid arthritis, systemic lupus erythematosus, or Crohn’s disease because of their potent anti-inflammatory and immunosuppressive properties.1-3 They are also recommended for treatment of severe asthma (evidence level D) when other treatments have failed to control the disease.4 However, long-term use of corticosteroids is associated with short-and long-term complications such as fractures, susceptibility to infections, obesity, stroke, cataract, and skin thinning.5 According to data from the Healthcare Cost and Utilization Project, corticosteroids were the most common cause of drug-related complications in 2004, accounting for 10% of all drug-related complications and 141,000 hospital stays in the United States.6 However, as reported in a recent literature review, evidence for the risks and costs associated with SCS therapy is sparse and inconsistent, particularly in patients with asthma.5,7 Very few studies have considered the cumulative dose-response relationship between SCSs and their related complications, and no study has measured the association between the magnitude of SCS exposure and health care resource utilization.
In this study, we investigated the risk of developing SCS-related complications for different degrees of SCS exposure compared with no SCS exposure and quantified the associated health care resource utilization and costs in severe asthma patients from a large U.S. commercially insured population.
Methods
Data Sources
The Truven Health MarketScan Research Databases contain claims from > 300 contributing employers and 25 contributing health plans across all regions of the United States. The present study used a subset of asthma patients from 2 core Truven databases: the Commercial Claims and Encounters database (2003-2014) and the Medicare Supplemental and Coordination of Benefits database (2006-2013). These databases include information on enrollment history, patient demographic characteristics (e.g., date of birth, region, and gender), claims for medical and pharmacy services, and complete payment information. For the purpose of this study, the total gross payment, including covered payer costs and patients’ copays and deductables, was used. The databases were de-identified and complied with the Health Insurance Portability and Accountability Act of 1996 to preserve patient anonymity and confidentiality.
Study Design and Patient Groups
A retrospective, longitudinal, open-cohort study was conducted using de-identified claims from the Truven Health MarketScan Research Databases. Eligible patients were aged ≥ 12 years and had ≥ 2 administrative charges associated with a diagnosis for asthma (International Classification of Diseases, Ninth Revision, Clinical Modification [ICD-9-CM] code 493.xx). SCS users were required to have ≥ 6 months of continuous chronic SCS use (identified by claims with daily doses of at least 5 mg prednisone equivalent with no gap of ≥ 14 days between 2 SCS claims. Doses of 0.6 mg betamethasone, 0.375 mg budesonide, 25 mg cortisone, 0.75 mg dexamethasone, 20 mg hydrocortisone, 4 mg methylprednisolone, 5 mg prednisolone, and 4 mg triamcinolone were considered equivalent to 5 mg prednisone).8,9 These first 6 months constituted the baseline period, and the index date was defined as the first day with a daily dose of ≥ 5 mg prednisone equivalent following this period. Among asthma patients never exposed to SCS, those with ≥ 1 prescription for an asthma medication other than SCS were eligible for the control group (SCS nonusers). The index date was defined as the initiation of this medication. All patients were required to be continuously covered by their health plans for ≥ 6 months (baseline period) before their index dates. The follow-up period spanned from the index date to the earliest of disenrollment from health plan or data cutoff. Patients with conditions other than asthma that are commonly treated with SCS were excluded from the study (i.e., cancer of the respiratory and intrathoracic system, rheumatoid arthritis, systemic lupus erythematosus, Crohn’s disease, and multiple sclerosis). Patients with a dose per claim higher than the 99th percentile were excluded to avoid the effects of outliers. Figure 1 summarizes the patient selection process.
FIGURE 1.
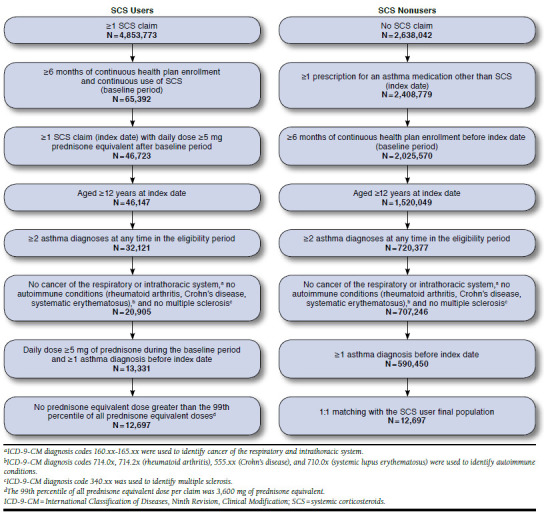
Sample Selection Flowcharts
Data Collection
To appropriately account for the fact that a patient’s asthma severity and SCS exposure may change over time, follow-up periods were divided into quarterly time intervals over which patient level of SCS exposure was categorized according to the cumulative SCS dose intensity (i.e., no exposure; low exposure < 5 mg/day; medium exposure ≥ 5-10 mg/day; and high exposure > 10 mg/day). These quarters were also used to assess the occurrence of SCS-related complications, complication-related health care resource utilization, and complication-related health care costs.
Outcomes
The study outcomes were the risk of developing acute and chronic SCS-related complications and associated health care resource utilization and costs. Acute complications included infections and gastrointestinal complications, whereas chronic complications included cardiovascular, metabolic, bone- and muscle-related, psychiatric, ocular, skin-related, adrenal, and other (bladder cancer, epistaxis, and non-Hodgkin’s lymphoma) conditions (Appendix A, available in online article). The outcomes were calculated over the follow-up period on a quarterly basis, and health care costs were further annualized. Health care resource utilization and costs because of SCS-related complications, grouped into pharmacy dispensings, outpatient visits, emergency room visits, hospitalizations, and other visits, were calculated using (a) medical claims with a diagnosis (ICD-9-CM codes) for SCS-related complications (Appendix A) or (b) pharmacy claims for medications used to treat SCS-related complications (Appendix B, available in online article). Costs were adjusted to 2014 U.S. dollars using the medical care component of the Consumer Price Index.10
Statistical Analysis
Descriptive statistics were generated to summarize the patient baseline characteristics at the index date. Baseline characteristics included age, gender, region, calendar year of index date, pre-existing conditions that may influence the occurrence of SCS-related complications (i.e., history of falls, fractures, or diagnosis of osteoporosis; diagnosis of cognitive impairment or depression; diagnosis of epilepsy, cerebrovascular disease, or Parkinson’s disease; diagnosis of diabetes mellitus; and diagnosis of chronic cardiovascular conditions), history of SCS-related complications, Charlson Comorbidity Index (CCI),11 and allcause and asthma-related health care costs. Frequency counts and percentages were used to summarize categorical variables, while means and standard deviations were used for continuous variables.
Standardized differences, which are the commonly accepted metrics to evaluate balance in propensity score matching,12 were used to compare the baseline characteristics between SCS users and SCS nonusers. Baseline characteristics with standardized differences below 10% were considered well balanced, as commonly found in the literature.12 SCS users and SCS nonusers were matched exactly with a ratio of 1:1 based on the propensity score. The propensity score modeled the probability of SCS use given demographic (age, gender, region, and year of index date) and clinical (CCI and pre-existing conditions) covariates, as well as baseline asthma-related health care costs.
The association between SCS exposure and outcomes was estimated through multivariate generalized estimating equation (GEE) models. This approach was chosen to account for the longitudinal and correlated nature of repeated quarterly data for the same patient on SCS exposure and outcomes and for the potential progression of confounders over time. The GEE models further controlled for key baseline characteristics (gender, age, region, total health care costs, whether the patient had at least 1 emergency room or inpatient visit)–to account for potential differences in the characteristics of patients with different degrees of SCS exposure—and time-dependent variables (quarter of observation, CCI, and cost of concomitant medications).
Odds ratios (ORs), estimated with a GEE model using a binomial distribution with logit link function and exchangeable correlation structure, were used to assess the risk of developing SCS-related complications for patients with low, medium, and high SCS exposure relative to patients without exposure to SCS. The GEE model used to estimate the incidence rate ratios of health care resource utilization because of SCS-related complications was based on a Poisson distribution with independent correlation structure. Adjusted cost differences between patients with low, medium, and high SCS exposure and SCS nonusers were assessed with a GEE model using a normal distribution with exchangeable correlation structure. Nonparametric bootstrap procedures with 999 replications were used to estimate 95% confidence intervals (CIs) and P values. In addition to the aforementioned key baseline characteristics and time-dependent variables, the GEE models controlled for the baseline CCI, the year of index date, and the presence of an SCS-related complication of interest or pre-existing conditions at baseline, where applicable (see Figures 2-4 for details regarding the covariates used in each GEE model). All outcomes were assessed for linear trends in continuous SCS exposure.
FIGURE 2.
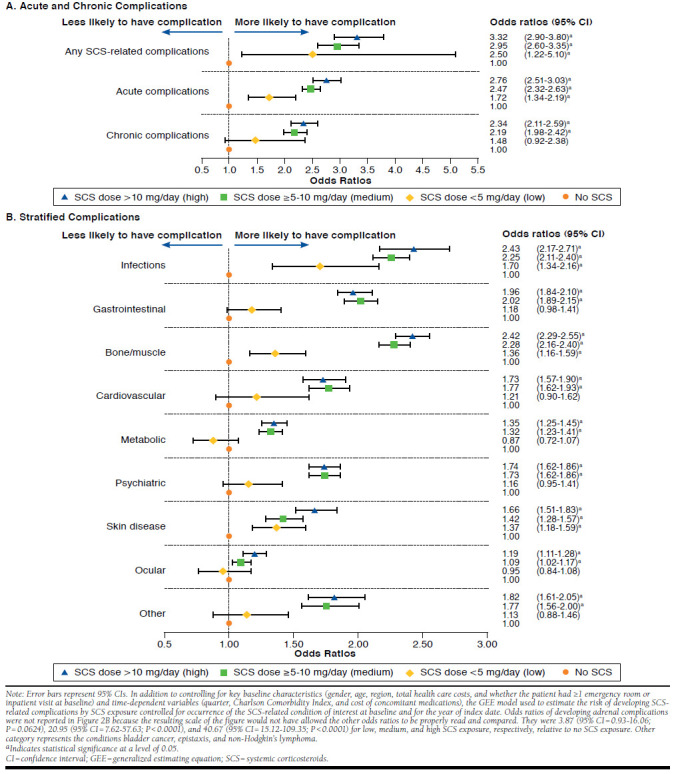
Risk of Developing SCS-Related Complications by SCS Exposure
FIGURE 4.
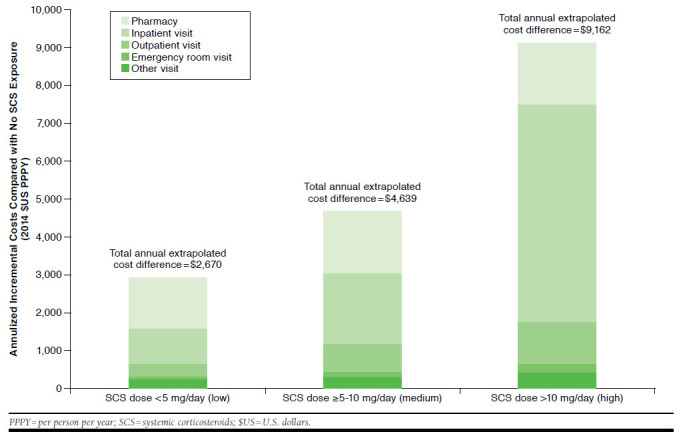
Annualized Incremental Costs of SCS-Related Complications by SCS Exposure Compared with No SCS Exposure
All analyses were conducted using SAS software version 9.3 of the SAS System for Windows (SAS Institute, Cary, NC). Statistical significance was declared at a 2-sided test at α-level of 0.05 or less.
Results
Baseline Characteristics
The initial unmatched asthma population included 12,697 SCS users and 590,450 SCS nonusers (Figure 1), and both groups differed significantly on most baseline characteristics (Table 1). The final propensity score-matched asthma population, which included all SCS users and an equal number of SCS nonusers, was more homogenous, since the standardized differences of the matching covariates were all smaller than 10%, except for asthma-related health care costs. SCS users and SCS nonusers were aged on average (median) 62.4 (61.9) and 62.6 (62.9) years, respectively, and both groups included 58.8% female patients. Mean (median) CCI was 1.9 (1.0) and 1.8 (1.0) for SCS users and nonusers, respectively.
TABLE 1.
Demographic and Clinical Baseline Characteristics at Index Date for Unmatched and Matched Populations
| Unmatched Populations | Matched Populations | |||||
|---|---|---|---|---|---|---|
| SCS Users (N = 12,697) | SCS Nonusers (N = 590,450) | Std. Diff.(%) | SCS Users (N = 12,697) | SCS Nonusers (N = 12,697) | Std. Diff.(%) | |
| Age at index date, mean ± SD [median], years | 62.4 ± 15.2 [61.9] | 37.7 ± 19.1 [36.5] | 143.24 | 62.4 ± 15.2 [61.9] | 62.6 ± 15.1 [62.9] | 1.48 |
| Age categories, years, n (%) | ||||||
| 12-17 | 114 (0.9) | 130,956 (22.2) | 66.61 | 114 (0.9) | 110 (0.9) | 0.34 |
| 18-34 | 451 (3.6) | 151,282 (25.6) | 62.52 | 451 (3.6) | 388 (3.1) | 2.78 |
| 35-44 | 900 (7.1) | 90,105 (15.3) | 25.94 | 900 (7.1) | 786 (6.2) | 3.61 |
| 45-54 | 2,218 (17.5) | 92,035 (15.6) | 5.07 | 2,218 (17.5) | 2,116 (16.7) | 2.14 |
| 55-64 | 3,851 (30.3) | 83,577 (14.2) | 38.89 | 3,851 (30.3) | 3,851 (30.3) | 0.00 |
| ≥ 65 | 5,163 (40.7) | 42,495 (7.2) | 78.44 | 5,163 (40.7) | 5,446 (42.9) | 4.52 |
| Female, n (%) | 7,471 (58.8) | 337,397 (57.1) | 3.44 | 7,471 (58.8) | 7,465 (58.8) | 0.10 |
| Region, n (%) | ||||||
| North Central | 3,999 (31.5) | 134,223 (22.7) | 19.71 | 3,999 (31.5) | 3,986 (31.4) | 0.22 |
| South | 3,990 (31.4) | 154,063 (26.1) | 11.78 | 3,990 (31.4) | 4,086 (32.2) | 1.62 |
| Northeast | 2,345 (18.5) | 139,604 (23.6) | 12.69 | 2,345 (18.5) | 2,361 (18.6) | 0.32 |
| West | 2,177 (17.1) | 149,590 (25.3) | 20.02 | 2,177 (17.1) | 2,084 (16.4) | 1.96 |
| Unknown | 186 (1.5) | 12,970 (2.2) | 5.46 | 186 (1.5) | 180 (1.4) | 0.40 |
| Follow-up period duration, mean ± SD [median], years | 2.0 ± 1.9 [1.5] | 1.2 ± 0.9 [1.1] | 55.63 | 2.0 ± 1.9 [1.5] | 1.1 ± 0.9 [1.1] | 60.51 |
| Year of index date, n (%) | ||||||
| 2003-2004 | 652 (5.1) | 27,533 (4.7) | 2.19 | 652 (5.1) | 660 (5.2) | 0.28 |
| 2005-2006 | 1,250 (9.8) | 41,572 (7.0) | 10.09 | 1,250 (9.8) | 1,265 (10.0) | 0.40 |
| 2007-2008 | 2,168 (17.1) | 74,401 (12.6) | 12.59 | 2,168 (17.1) | 2,212 (17.4) | 0.92 |
| 2009-2010 | 3,031 (23.9) | 119,421 (20.2) | 8.80 | 3,031 (23.9) | 3,143 (24.8) | 2.06 |
| 2011-2012 | 3,748 (29.5) | 197,601 (33.5) | 8.50 | 3,748 (29.5) | 3,639 (28.7) | 1.89 |
| 2013-2014 | 1,848 (14.6) | 129,922 (22.0) | 19.27 | 1,848 (14.6) | 1,778 (14.0) | 1.58 |
| Pre-existing conditions, n (%) | ||||||
| Diagnosis of chronic cardiovascular conditions | 6,916 (54.5) | 132,057 (22.4) | 66.00 | 6,916 (54.5) | 7,106 (56.0) | 3.01 |
| Diagnosis of diabetes mellitus | 3,044 (24.0) | 37,930 (6.4) | 48.88 | 3,044 (24.0) | 3,186 (25.1) | 2.60 |
| Diagnosis of cognitive impairment or depression | 1,646 (13.0) | 53,041 (9.0) | 12.74 | 1,646 (13.0) | 1,670 (13.2) | 0.56 |
| History of falls, fractures, or diagnosis of osteoporosis | 1,561 (12.3) | 18,001 (3.0) | 34.74 | 1,561 (12.3) | 1,505 (11.9) | 1.35 |
| Diagnosis of epilepsy, cerebrovascular disease, or Parkinson's disease | 873 (6.9) | 9,813 (1.7) | 25.79 | 873 (6.9) | 852 (6.7) | 0.66 |
| ≥ 1 SCS-related complication, n (%) | 12,454 (98.1) | 413,066 (70.0) | 76.77 | 12,454 (98.1) | 11,615 (91.5) | 29.71 |
| ≥ 1 acute SCS-related complication, n (%) | 11,178 (88.0) | 276,758 (46.9) | 87.86 | 11,178 (88.0) | 8,094 (63.7) | 56.79 |
| Infections | 10,296 (81.1) | 238,450 (40.4) | 83.36 | 10,296 (81.1) | 6,815 (53.7) | 58.48 |
| Gastrointestinal | 6,584 (51.9) | 87,213 (14.8) | 78.68 | 6,584 (51.9) | 3,841 (30.3) | 43.92 |
| ≥ 1 chronic SCS-related complication, n (%) | 11,960 (94.2) | 321,067 (54.4) | 91.11 | 11,960 (94.2) | 10,971 (86.4) | 26.32 |
| Cardiovascular | 9,192 (72.4) | 136,261 (23.1) | 98.74 | 9,192 (72.4) | 7,748 (61.0) | 24.13 |
| Bone- and muscle-related | 7,905 (62.3) | 139,356 (23.6) | 78.10 | 7,905 (62.3) | 5,397 (42.5) | 39.55 |
| Psychiatric | 7,143 (56.3) | 139,731 (23.7) | 66.54 | 7,143 (56.3) | 4,859 (38.3) | 36.03 |
| Metabolic | 6,921 (54.5) | 128,089 (21.7) | 67.57 | 6,921 (54.5) | 6,883 (54.2) | 0.60 |
| Ocular | 2,003 (15.8) | 22,971 (3.9) | 39.91 | 2,003 (15.8) | 1,841 (14.5) | 3.56 |
| Skin diseases | 614 (4.8) | 14,364 (2.4) | 12.84 | 614 (4.8) | 442 (3.5) | 6.79 |
| Adrenal | 91 (0.7) | 56 (0.0) | 11.76 | 91 (0.7) | 1 (0.0) | 11.80 |
| Other | 950 (7.5) | 6,216 (1.1) | 31.81 | 950 (7.5) | 531 (4.2) | 14.08 |
| Health care costs, mean ± SD [median], 2014 $US | ||||||
| All-cause health care costs | 19,961 ± 38,109 [9,333] | 3,820 ± 13,417 [1,289] | 56.50 | 19,961 ± 38,109 [9,333] | 12,418 ± 31,575 [3,744] | 21.56 |
| Asthma-related total health care costs | 3,348 ± 8,058 [1,532] | 736 ± 2,865 [213] | 43.20 | 3,348 ± 8,058 [1,532] | 2,423 ± 9,341 [523] | 10.61 |
| CCI, mean ± SD [median] | 1.9 ± 1.6 [1.0] | 0.8 ± 0.9 [1.0] | 87.29 | 1.9 ± 1.6 [1.0] | 1.8 ± 1.8 [1.0] | 0.83 |
CCI = Charlson Comorbidity Index; SCS = systemic corticosteroids; SD = standard deviation; Std. Diff. = standardized difference; $US = U.S. dollars.
Risks of Developing SCS-Related Complications
Compared with SCS nonusers, SCS users were significantly more likely to develop any SCS-related complication, and this likelihood increased with SCS exposure: ORs were 2.50 (95% CI = 1.22-5.10), 2.95 (95% CI = 2.60-3.35), and 3.32 (95% CI = 2.90-3.80) for low, medium, and high SCS exposure, respectively, compared with no exposure (Figure 2A). A significant linear relationship between increasing SCS exposure and increasing risk of developing SCS-related complications was also observed based on continuous SCS doses (P < 0.0001). Similar results were observed for the risks of developing acute and chronic complications, although the OR for chronic complications was not significant for low SCS exposure. The odds of developing infections (e.g., fungal and herpes zoster); bone/muscle-related complications (e.g., avascular necrosis and fractures); and skin diseases (e.g., bruising and striae) increased by at least 36%, 42%, and 66% for low, medium, and high SCS exposure, respectively, compared with no exposure. For medium and high SCS exposure compared with no SCS exposure, the odds for cardiovascular complications (e.g., hypertension and myocardial infarction) and psychiatric complications (e.g., depression and sleep disturbances) increased by at least 73%, whereas they increased by at least 96% for gastrointestinal complications (e.g., ulcers and gastritis with hemorrhage) and 32% for metabolic complications (e.g., obesity and dyslipidemia; Figure 2B).
Health Care Resource Utilization Because of SCS-Related Complications
Exposure to SCSs was associated with significant increases in health care resource utilization because of SCS-related complications, and these increases were more pronounced with higher degrees of SCS exposure (Figure 3). In fact, significant linear trends were observed between increasing SCS exposure, as a continuous variable, and increasing resource utilization of all types (P < 0.0001). This was also reflected in inpatient visits (incidence rate ratios for low, medium, and high SCS exposure relative to no exposure: 1.86 [95% CI = 1.70-2.04], 2.40 [95% CI = 2.26-2.56], and 3.37 [95% CI = 3.18-3.59]) and emergency room visits (incidence rate ratios for low, medium, and high SCS exposure relative to no exposure: 1.57 [95% CI = 1.39-1.78], 1.78 [95% CI = 1.65-1.92], and 2.17 [95% CI = 2.00-2.35]).
FIGURE 3.
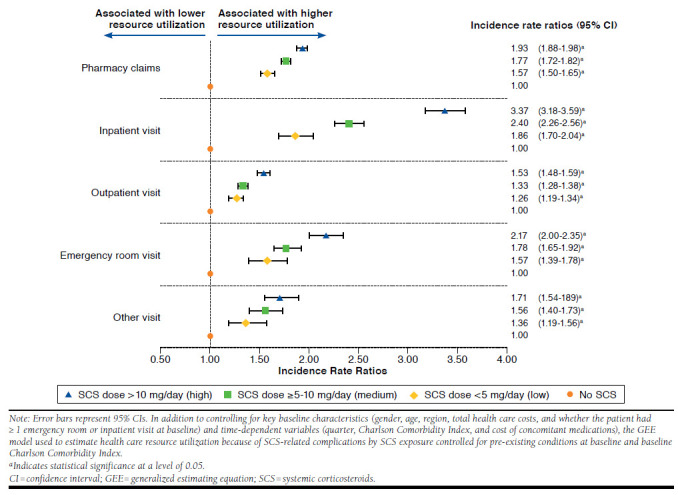
Health Care Resource Utilization Because of SCS-Related Complications by SCS Exposure Compared with No SCS Exposure
Health Care Costs of SCS-Related Complications
Table 2 presents the quarterly health care costs of SCS-related complications estimated by SCS exposure and quarter, and the annualized cost differences between SCS users and SCS nonusers are reported in Figure 4. A significant trend of increasing costs with increasing SCS exposure based on continuous SCS doses was observed (P < 0.0001), and annual health care costs of SCS-related complications were estimated to be $2,670, $4,639, and $9,162 higher for patients with low, medium, and high SCS exposure, respectively, than for SCS nonusers. These cost differences were mainly driven by incremental pharmacy costs and inpatient visit costs.
TABLE 2.
Association Between Health Care Costs Because of SCS-Related Complications and SCS Exposure
| Health Care Costs (2014 $US) | Unadjusted Costs Mean ± SD [median] | Unadjusted Cost Difference Relative toNo SCS | Adjusted Cost Difference Relative to No SCS Exposurea | |
|---|---|---|---|---|
| Meanb (95% CI) | P Value | |||
| Pharmacy and medical costs | ||||
| No SCS | 1,754 ± 10,749 [265] | |||
| SCS dose: < 5 mg/day (low) | 3,033 ± 16,406 [576] | 1,279 | 667 (257-937) | 0.0020 |
| SCS dose: ≥ 5-10 mg/day (medium) | 3,284 ± 12,287 [715] | 1,531 | 1,160 (1,038-1,427) | < 0.0001 |
| SCS dose: > 10 mg/day (high) | 4,702 ± 19,382 [872] | 2,948 | 2,291 (2,044-2,532) | < 0.0001 |
| Pharmacy costs | ||||
| No SCS | 412 ± 1,041 [82] | |||
| SCS dose: < 5 mg/day (low) | 709 ± 1,538 [257] | 297 | 342 (302-397) | < 0.0001 |
| SCS dose: ≥ 5-10 mg/day (medium) | 850 ± 1,907 [350] | 438 | 422 (393-460) | < 0.0001 |
| SCS dose: > 10 mg/day (high) | 956 ± 2,032 [403] | 544 | 416 (382-447) | < 0.0001 |
| All medical costs | ||||
| No SCS | 1,342 ± 10,672 [21] | |||
| SCS dose: < 5 mg/day (low) | 2,324 ± 16,216 [95] | 982 | 390 (-33-629) | 0.0721 |
| SCS dose: ≥ 5-10 mg/day (medium) | 2,434 ± 12,047 [113] | 1,092 | >760 (629-1,013) | < 0.0001 |
| SCS dose: > 10 mg/day (high) | 3,746 ± 19,178 [150] | 2,404 | 1,872 (1,633-2,096) | < 0.0001 |
| Inpatient visit costs | ||||
| No SCS | 813 ± 10,104 [0] | |||
| SCS dose: < 5 mg/day (low) | 1,511 ± 15,648 [0] | 698 | 233 (-143-467) | 0.2162 |
| SCS dose: ≥ 5-10 mg/day (medium) | 1,570 ± 11,062 [0] | 757 | 467 (331-683) | < 0.0001 |
| SCS dose: > 10 mg/day (high) | 2,688 ± 18,474 [0] | 1,875 | 1,433 (1,212-1,635) | < 0.0001 |
| Outpatient visit costs | ||||
| No SCS | 337 ± 2,035 [0] | |||
| SCS dose: < 5 mg/day (low) | 478 ± 2,343 [63] | 141 | 82 (12-142) | 0.0300 |
| SCS dose: ≥ 5-10 mg/day (medium) | 536 ± 2,989 [74] | 199 | 182 (150-230) | < 0.0001 |
| SCS dose: > 10 mg/day (high) | 686 ± 3,297 [90] | 348 | 282 (244-325) | < 0.0001 |
| Emergency room visit costs | ||||
| No SCS | 59 ± 739 [0] | |||
| SCS dose: < 5 mg/day (low) | 102 ± 810 [0] | 44 | 24 (11-45) | < 0.0001 |
| SCS dose: ≥ 5-10 mg/day (medium) | 97 ± 712 [0] | 38 | 30 (24-44) | < 0.0001 |
| SCS dose: > 10 mg/day (high) | 135 ± 1,084 [0] | 76 | 61 (49-72) | < 0.0001 |
| Other visit costs | ||||
| No SCS | 133 ± 1,337 [0] | |||
| SCS dose: < 5 mg/day (low) | 232 ± 2,147 [0] | 99 | 55 (6-93) | 0.0240 |
| SCS dose: ≥ 5-10 mg/day (medium) | 232 ± 1,937 [0] | 99 | 75 (52-103) | < 0.0001 |
| SCS dose: > 10 mg/day (high) | 238 ± 1,809 [0] | 105 | 95 (78-122) | < 0.0001 |
a In addition to controlling for key baseline characteristics (gender, age, region, total health care costs, whether the patient had ≥1 emergency room or inpatient visit at baseline) and time-dependent variables (quarter, Charlson Comorbidity Index, and cost of concomitant medications), the GEE model used to estimate health care costs of SCS-related complications by SCS exposure controlled for the year of index date, baseline Charlson Comorbidity Index, and pre-existing conditions at baseline.
b Estimates in bold are significant (P < 0.05).
Cl = confidence interval; GEE = generalized estimating equation; SCS = systemic corticosteroid; SD = standard deviation.
Discussion
In this large retrospective open-cohort study of severe asthma patients, we found a significant dose-response relationship between degrees of SCS cumulative dose intensity and the risk of developing SCS-related complications. As expected, the magnitude of the dose-response relationship differed across categories of complications.
Previous asthma studies focusing on SCS-related complications were found either to be conducted on small sample sizes, to be of short duration in SCS exposure or in follow-up, or to examine a limited number of complications.5,13,14 Nevertheless, many previous studies found a dose and time relationship for serious long-term corticosteroid-related complications.13,15-18 In particular, fractures were often studied in the literature.19-23 The present study found that patients with low, medium, and high SCS exposure had a 1.36-fold, 2.28-fold, and 2.42-fold risk, respectively, of developing bone- and muscle-related complications, such as fractures, relative to patients without exposure to SCSs. De Vries et al. (2007) reported a significantly increased risk of developing fractures among obstructive airway disease patients exposed to an SCS compared with those who were never exposed to an SCS.19 Depending on the type of fracture, they estimated a relative risk varying from 1.37 to 5.65 for patients with a cumulative dose of SCS between 1 gm and 5 gm, and from 3.00 to 10.61 for patients with a cumulative dose > 5 gm.19
In their report, O’Neill et al. (2015) estimated the direct health care treatment costs from a National Health Service perspective using data from the British Thoracic Society Difficult Asthma Registry (n = 596) and examined factors that explain variations in costs.14 They found that costs for patients on maintenance oral corticosteroids were 43% higher than for those not receiving maintenance oral corticosteroids. For those patients on maintenance steroids, asthma-related medications were more expensive, but notably, their nonmedication costs and those for nonasthma-related medications were significantly higher. Interestingly, nonasthma medication included proton pump inhibitors and bisphosphonates, which are examples of therapies used to manage side effects of oral corticosteroid-induced morbidity. Recurrent exacerbations were also a significant driver of costs; costs for patients with > 2 exacerbations requiring oral corticosteroids were approximately 31% higher than for patients with < 2 courses of rescue oral corticosteroids.
In the current study, higher cumulative doses of SCS significantly increased all types of SCS-related health care resource utilization with a significant dose-response relationship. Patients with low, medium, and high SCS exposure were estimated to have $2,670, $4,639, and $9,162, respectively, annual incremental costs attributable to SCS-related complications relative to those without SCS exposure. These are comparable with the annual mean treatment costs among severe refractory asthma patients reported by O’Neill et al. (£2,912–£4,217) after conversion to U.S. dollars.14 These results regarding health care utilization and costs are important for health care policy makers and payers, since they suggest that chronic SCS use, particularly at a high dose, imposes a large burden on health care systems. The report by Sarnes et al. (2011), which evaluated the burden of complications associated with corticosteroid use across different diseases, provided a similar conclusion.5 The authors estimated that reducing daily doses of oral and parenteral corticosteroids may result in a cost reduction of $1.76 million per 10,000 persons by avoiding 96 fractures per 10,000 persons. This finding is in line with our results, since we estimated that a reduction from high to medium exposure and from medium to low exposure may result in a cost reduction of $968,579 and $3.93 million per 10,000 persons, respectively, by avoiding bone- and muscle-related complications.
There is an ongoing debate on the toxicity and safety of SCS use at daily doses ≤ 10 mg prednisone equivalent, in particular in the treatment of chronic diseases such as rheumatoid arthritis.24-26 Of note, patients with rheumatoid arthritis rarely receive any other source of exogenous corticosteroid, whereas patients with severe asthma generally additionally receive daily doses of moderate- to high-dose inhaled corticosteroids. Although several large retrospective studies have shown that long-term corticosteroid use, even at daily doses < 5 mg prednisone equivalent, is a significant independent predictor of SCS-related complications,16,20,27 no clinical trial in a rheumatoid arthritis setting has found statistically significant evidence of this relationship in low-dose SCS.26 However, in the current study, we found that low exposure significantly increased the risk of developing 3 types of SCS-related complications compared with no SCS exposure (i.e., bone- and muscle-related complications, skin diseases, and infections). Furthermore, the present study found a significant increase in health care resource use and costs associated with SCS-related complications compared with no SCS use for SCS doses < 5 mg. One explanation is that this significant increase in the health care resource utilization and cost burden could stem from follow-up visits or treatments for SCS-related complication episodes that may have happened before the low SCS exposure period, since all SCS users were continuously exposed to doses ≥ 5 mg prednisone equivalent during at least 6 months before their index dates. These results may indicate a lasting impact of SCS-related complications on health care resource utilization and costs associated with doses of SCS ≥5 mg, thereby supporting the need to develop corticosteroid-sparing therapies.
Limitations
There are limitations in this study that are commonly associated with the use of administrative claims data, including coding errors and reliance on ICD-9-CM codes to identify SCS-related complications that might not have reflected confirmed clinical diagnoses. Moreover, it was assumed that a prescription claim for SCS indicated use of SCS. However, patients might not have adhered to the SCS treatment regimen as prescribed. Additionally, pharmacy costs because of SCS-related complications were identified using the claims for medications used to treat each category of SCS-related complications. But, these medications could have been used for reasons other than treating complications because of SCS use. For example, antidepressants such as selective serotonin reuptake inhibitors, which were used to identify psychiatric SCS-related complications in the database, can sometimes be used to treat menopausal symptoms instead of depression.26,28 Similarly, we identified complications and health care resource utilization using claims with a diagnosis of SCS-related complications. It is possible that these services were associated with other conditions. For example, although gastrointestinal conditions have been reported in the literature as potential complications of SCS use, some gastrointestinal disorders considered in the current study may not be associated with SCS use. The same limitation may apply to the psychiatric disorders assessed in this study. Also, it is possible that some of the differences estimated between the 2 groups may be partly attributable to asthma severity. Unfortunately, health care claims do not provide detailed clinical information related to asthma severity to control for potential confounding that may remain between the 2 groups.
This study was also subject to limitations related to the study design. Inhaled corticosteroids were not included in the list of SCSs, consistent with previous literature excluding inhaled corticosteroids from a systematic literature review of corticosteroid-associated adverse event costs, based on the assumption that they would lack significant systemic absorption.5 Therefore, it is possible that SCS exposure was underestimated in the current study. Furthermore, patients with SCS-related complications before SCS initiation were not excluded. Consequently, the diagnosis of a complication occurring during the follow-up period may actually have referred to a follow-up visit for a condition that had developed before the use of an SCS. Finally, the study compared observable SCS-related complications associated with resource use and costs between SCS users and nonusers; however, the potential benefit of corticosteroids in terms of asthma control and related morbidity was not assessed.
Conclusions
We found that among a large U.S. commercially insured population, patients with severe asthma who had been treated for at least 6 months with a daily dose of at least 5 mg of prednisone had a significantly higher risk of developing SCS-related complications compared with those not exposed to SCSs and that this risk significantly increased with SCS exposure. We also found a significant incremental burden on health care resources and costs associated with SCS-related complications for SCS users compared with SCS nonusers and that this effect was significant even at daily doses < 5 mg prednisone equivalent.
ACKNOWLEDGMENTS
Editorial support in the form of outline development was provided by Emma McConnell at Gardiner-Caldwell Communications (Macclesfield, UK) and was funded by GlaxoSmithKline.
APPENDIX A. ICD-9-CM Codes for SCS-Related Complications
| Category | Condition | ICD-9 Code | Description |
|---|---|---|---|
| Gastrointestinal | Nausea/vomiting | 787.0x | Nausea and vomiting |
| 536.2x | Persistent vomiting | ||
| 569.87 | Vomiting of fecal matter | ||
| Gastrointestinal bleeds/ulcers | 456.0x | Esophageal varices with bleeding | |
| 456.2 | Esophageal varices in diseases classified elsewhere | ||
| 530.2x | Ulcer of esophagus with bleeding | ||
| 530.4x | Perforation of esophagus | ||
| 530.82 | Other specified disorders of esophagus with esophageal hemorrhage | ||
| 531.xx-534.xx | Gastric, duodenal, peptic, gastrojejunal ulcers | ||
| 535.01 | Acute gastritis with hemorrhage | ||
| 535.11 | Atrophic gastritis with hemorrhage | ||
| 535.21 | Gastric mucosal hypertrophy with hemorrhage | ||
| 535.31 | Alcoholic gastritis with hemorrhage | ||
| 535.41 | Other specified gastritis with hemorrhage | ||
| 535.51 | Unspecified gastritis and gastroduodenitis with hemorrhage | ||
| 535.61 | Duodenitis with hemorrhage | ||
| 535.71 | Eosinophilic gastritis with hemorrhage | ||
| 537.83 | Angiodysplasia of stomach and duodenum with hemorrhage | ||
| 537.84 | Dieulafoy lesion (hemorrhagic) of stomach and duodenum | ||
| 538.xx | Gastrointestinal mucositis (ulcerative) | ||
| 556.xx | Ulcerative enterocolitis | ||
| 557.0x | Acute vascular insufficiency of intestine | ||
| 562.02 | Diverticulosis of small intestine with hemorrhage | ||
| 562.12 | Diverticulosis of colon with hemorrhage | ||
| 562.13 | Diverticulitis of colon with hemorrhage | ||
| 569.82 | Ulceration of intestine | ||
| 569.83 | Perforation of intestine | ||
| 569.85 | Angiodysplasia of intestine with hemorrhage | ||
| 569.86 | Dieulafoy lesion (hemorrhagic) of intestine | ||
| 578.xx | Gastrointestinal hemorrhage | ||
| Dyspepsia | 536.8 | Dyspepsia and other specified disorders of function of stomach | |
| Infections | Fungal infections | 110.xx | Dermatophytosis |
| 111. xx | Dermatomycosis other and unspecified | ||
| 112.xx | Candidiasis | ||
| 117.xx | Other mycoses | ||
| 118.xx | Opportunistic mycoses | ||
| 202.1x | Mycosis fungoides | ||
| 370.05 | Mycotic corneal ulcer | ||
| 484.7x | Pneumonia in other systemic mycose | ||
| V75.4 | Screening examination for mycotic infections | ||
| Pneumonia | 3.22 | Salmonella pneumonia | |
| 011.6x | Tuberculous pneumonia | ||
| 020.5x | Pneumonic plague, unspecified | ||
| 055.1x | Postmeasles pneumonia | ||
| 073.0x | Ornithosis with pneumonia | ||
| 112.4x | Candidiasis of lung | ||
| 115.15 | Infection by Histoplasma duboisii, pneumonia | ||
| 115.95 | Histoplasmosis, unspecified, pneumonia | ||
| 136.3x | Pneumocystosis | ||
| 480.xx | Viral pneumonia | ||
| 481.xx | Pneumococcal pneumonia [Streptococcus pneumoniae pneumonia] | ||
| 482.xx | Other bacterial pneumonia | ||
| 483.xx | Pneumonia due to other specified organism | ||
| 484.xx | Pneumonia in infectious diseases classified elsewhere | ||
| 485.xx | Bronchopneumonia, organism unspecified | ||
| Infections | Pneumonia | 486.xx | Pneumonia, organism unspecified |
| 487.0x | Influenza with pneumonia | ||
| 488.01 | Influenza due to identified avian influenza virus with pneumonia | ||
| 488.11 | Influenza due to identified 2009 h1n1 influenza virus with pneumonia | ||
| 514.xx | Pulmonary congestion and hypostasis | ||
| 517.1x | Rheumatic pneumonia | ||
| 518.3x | Pulmonary eosinophilia | ||
| V12.61 | Personal history of pneumonia (recurrent) | ||
| V73.9 | Screening examination for unspecified viral and chlamydial disease | ||
| Sepsis | 038.xx | Septicemia | |
| 670.2x | Puerperal sepsis | ||
| 995.91 | Sepsis | ||
| 995.92 | Severe sepsis | ||
| Tuberculosis | 010.xx-018.xx | Tuberculosis | |
| 795.5x | Nonspecific reaction to test for tuberculosis | ||
| V01.1 | Contact with or exposure to tuberculosis | ||
| V03.2 | Need for prophylactic vaccination and inoculation against tuberculosis | ||
| V71.2 | Observation for suspected tuberculosis | ||
| V74.1 | Screening examination for pulmonary tuberculosis | ||
| Urinary tract infection | 599.0x | Chronic pyelonephritis | |
| 997.5x | Urinary complications, not elsewhere classified | ||
| Varicella infection | 052.xx | Chickenpox | |
| 053.xx | Herpes zoster | ||
| V05.4 | Need for prophylactic vaccination and inoculation against varicella | ||
| V01.71 | Contact with or exposure to varicella | ||
| Bursitis | 095.7x | Syphilis of synovium, tendon, and bursa | |
| 98.52 | Gonococcal bursitis | ||
| 726.19 | Other specified disorders of bursae and tendons in shoulder region | ||
| 727.3x | Other bursitis | ||
| Adrenal | Cushing’s syndrome | 255.0x | Cushing’s syndrome |
| Skin conditions | Bruising | 920.xx-924.xx | Contusions with intact skin surface |
| Impaired wound healing | 998.83 | Non-healing surgical wound | |
| 782.9 | Other symptoms involving skin and integumentary tissues | ||
| Striae | 701.3 | Striae atrophicae | |
| Skin thinning | 701.8x | Other specified hypertrophic and atrophic conditions of skin | |
| 701.9x | Unspecified hypertrophic and atrophic conditions of skin | ||
| Bone- and muscle-related | Avascular necrosis | 733.4x | Aseptic necrosis of bone |
| Muscle weakness | 728.87 | Muscle weakness (generalized) | |
| Osteoporosis | 733.0x | Osteoporosis | |
| Back pain | 724.2x | Lumbago | |
| 724.5x | Backache, unspecified | ||
| 724.3 | Sciatica | ||
| Fractures | 733.1x | Pathologic fracture | |
| 733.93 | Stress fracture of tibia or fibula | ||
| 733.94 | Stress fracture of the metatarsals | ||
| 733.95 | Stress fracture of other bone | ||
| 733.96 | Stress fracture of femoral neck | ||
| 733.97 | Stress fracture of shaft of femur | ||
| 733.98 | Stress fracture of pelvis | ||
| 800.xx-804.xx | Fracture of skull | ||
| 805.xx-809.xx | Fracture of spine and trunk | ||
| 810.xx-819.xx | Fracture of upper limb | ||
| 820.xx-829.xx | Fracture of lower limb | ||
| Cardiovascular | Atrial fibrillation/flutter | 427.3x | Atrial fibrillation and flutter |
| Hypertension | 401.xx-405.xx | Hypertensive heart disease | |
| Myocardial infarction | 410.xx | Acute myocardial infarction | |
| 412.xx | Old myocardial infarction | ||
| Other | Bladder cancer | 188.xx | Malignant neoplasm of bladder |
| Epistaxis | 784.7 | Epistaxis | |
| Non-Hodgkin’s lymphoma | 202.8x | Other malignant lymphomas | |
| Metabolic | Hyperglycemia | 790.29 | Other abnormal glucose |
| Dyslipidemia | 272.4x | Other and unspecified hyperlipidemia | |
| Obesity | 278.xx | Overweight, obesity, and other hyperalimentation | |
| V77.8 | Screening for obesity | ||
| V85.3 | Body mass index between 30-39, adult | ||
| V85.4 | Body mass index 40 and over, adult | ||
| Diabetes mellitus | 249.xx | Secondary diabetes mellitus | |
| 250.xx | Diabetes mellitus | ||
| Metabolic syndrome | 277.7x | Dysmetabolic syndrome | |
| V77.99 | Screening for other and unspecified endocrine, nutritional, metabolic, and immunity disorders | ||
| Ocular | Cataracts | 366.xx | Cataract |
| Glaucoma | 365.xx | Glaucoma | |
| Psychiatric | Bipolar disorder | 296.0x | Bipolar I disorder, single manic episode |
| 296.4x | Bipolar I disorder, most recent episode (or current) manic | ||
| 296.5x | Bipolar I disorder, most recent episode (or current) depressed | ||
| 296.6x | Bipolar I disorder, most recent episode (or current) mixed | ||
| 296.7x | Bipolar I disorder, most recent episode (or current) unspecified | ||
| 296.8 | Bipolar disorder, unspecified | ||
| 296.89 | Other bipolar disorders | ||
| Depression | 292.84 | Drug-induced mood disorder | |
| 296.2x | Major depressive disorder single episode | ||
| 296.3x | Major depressive affective disorder, recurrent episode, unspecified | ||
| 298.0x | Depressive type psychosis | ||
| 300.0x | Anxiety states | ||
| 301.12 | Chronic depressive personality disorder | ||
| 309.28 | Adjustment disorder with mixed anxiety and depressed mood | ||
| 311.xx | Depressive disorder, not elsewhere classified | ||
| Sleep disturbances | 780.5x | Sleep disturbances | |
| 307.4x | Specific disorders of sleep of nonorganic origin | ||
| Steroid psychosis | 292.1x | Drug-induced psychotic disorders | |
| 292.89 | Other specified drug-induced mental disorders | ||
| 292.9x | Unspecified drug-induced mental disorder |
ICD-9-CM = International Classification of Diseases, Ninth Revision, Clinical Modification; SCS = systemic corticosteroids.
APPENDIX B. GPI Codes to Identify Medications Used for SCS-Related Complications
| Condition | GPI Code | Description |
|---|---|---|
| Gastrointestinal disorders (nausea/vomiting, GI ulcers/bleeds, dyspepsia) | 50xx | Antiemetics |
| 49xx | Ulcer drugs | |
| 3017xx | Somatostatic agents | |
| 48xx | Antacids | |
| Infections (fungal infections, pneumonia, sepsis, tuberculosis, varicella infection, urinary tract infection) | 01xx | Penicillins |
| 02xx | Cephalosporins | |
| 03xx | Macrolides | |
| 04xx | Tetracyclines | |
| 05xx | Fluoroquinolones | |
| 07xx | Aminoglycosides | |
| 08xx | Sulfonamides | |
| 09xx | Antimycobacterial agents | |
| 11xx | Antifungals | |
| 12xx | Antivarials | |
| 13xx | Antimalarials | |
| 14xx | Amebecides | |
| 15xx | Antihelmintics | |
| 16xx | Anti-infective agents - miscellaneous | |
| 18xx | Toxoids | |
| 19xx | Passive immunizing agents | |
| 53xx | Urinary antiinfectives | |
| 54xx | Urinary antispasmodics | |
| 5510xx | Vaginal antiinfectives | |
| 8610xx | Ophthalmic antiinfectives | |
| 8810xx | Antiinfectives-throat | |
| 9010xx | Antibiotics-topical | |
| 9015xx | Antifungals-topical | |
| 9035xx | Antivirals-topical | |
| 92xx | Antiseptics and disinfectants | |
| 9810xx | Antimicrobial agents | |
| Adrenal (Cushing’s syndrome) | - | N/A |
| Skin conditions (acne) | - | N/A |
| Bone- and muscle-related (bursitis, fractures, osteoporosis, avascular necrosis, muscle weakness, back pain) | 3004xx | Bisphosponates |
| 64xx | Analgesics-non-narcotic | |
| 65xx | Analgesics-opioid | |
| 66xx | Analgesics-anti-inflammatory | |
| 7910xx | Calcium | |
| Cardiovascular (atrial fibrillation/flutter, myocardial infarction, hypertension) | 32xx | Antianginal agents |
| 33xx | Beta blockers | |
| 34xx | Calcium channel blockers | |
| 35xx | Antiarrythmics | |
| 36xx | Antihypertensives | |
| 37xx | Diuretics | |
| Other (bladder cancer, non-Hodgkin’s lymphoma, epistaxis) | 21xx | Antineoplastic agents |
| 3009xx | GnRH/LHRH antagonists | |
| 9037xx | Antineoplastic topical agents | |
| Ocular (cataract, glaucoma) | 8625xx | Ophthalmic agents |
| Metabolic (hyperglycemia, obesity, diabetes, metabolic syndrome, hyerlipidemia) | 39xx | Antihyperlipidemics |
| 27xx | Antidiabetics | |
| 6125xx | Anti-obesity agents | |
| Psychiatric (bipolar disorder, depression, sleep disturbances, steroid psychosis) | 57xx | Antianxiety agents |
| 58xx | Antidepressants | |
| 59xx | Antipsychotic/antimanic agents | |
| 60xx | Hypnotics | |
| 6200xx | Psychotherapeutic and neurological agents - miscellaneous | |
| 6256xx | Restless leg syndrome agents |
GI = gastrointestinal; GnRH = gonadotropin-releasing hormone; GPI = Generic Product Identifier; LHRH = luteinizing hormone-releasing hormone; N/A = not applicable; SCS = systemic corticosteroids.
References
- 1.Guidelines for referral and management of systemic lupus erythematosus in adults. American College of Rheumatology Ad Hoc Committee on Systemic Lupus Erythematosus Guidelines. Arthritis Rheum. 1999;42(9): 1785-96. [DOI] [PubMed] [Google Scholar]
- 2.Singh JA, Furst DE, Bharat A, et al. 2012 update of the 2008 American College of Rheumatology recommendations for the use of disease-modifying antirheumatic drugs and biologic agents in the treatment of rheumatoid arthritis. Arthritis Care Res (Hoboken). 2012;64(5):625-39. Available at: http://onlinelibrary.wiley.com/doi/10.1002/acr.21641/abstract;jsessionid=EFBFBD8325BA82E09B2FFA4EC152D139.f03t04. Accessed May 24, 2016. [DOI] [PMC free article] [PubMed] [Google Scholar]
- 3.Irving PM, Gearry RB, Sparrow MP, Gibson PR.. Review article: appropriate use of corticosteroids in Crohn’s disease. Aliment Pharmacol Ther. 2007;26(3):313-29. [DOI] [PubMed] [Google Scholar]
- 4.Global Initiative for Asthma. Global strategy for asthma management and prevention. 2016. Available at: http://ginasthma.org/gina-reports/. Accessed June 8, 2016.
- 5.Sarnes E, Crofford L, Watson M, Dennis G, Kan H, Bass D.. Incidence and US costs of corticosteroid-associated adverse events: a systematic literature review. Clin Ther. 2011;33(10):1413-32. [DOI] [PubMed] [Google Scholar]
- 6.Elixhauser A, Owens P.. Adverse drug events in U.S. hospitals, 2004. HCUP Statistical Brief #29. April 2007. Agency for Healthcare Research and Quality, Rockville, MD. Available at: http://www.hcup-us.ahrq.gov/reports/statbriefs/sb29.pdf. Accessed May 24, 2016. [PubMed]
- 7.Hoes JN, Jacobs JW, Verstappen SM, Bijlsma JW, van der Heijden GJ.. Adverse events of low- to medium-dose oral glucocorticoids in inflammatory diseases: a meta-analysis. Ann Rheum Dis. 2009;68(12):1833-38. [DOI] [PubMed] [Google Scholar]
- 8.Steven KH. Adrenal cortical steroids. In Flynn M, Hebel SK, eds. Drug Facts and Comparisons. 51st ed. St Louis, MO: Facts & Comparisons; 1997:122-28. [Google Scholar]
- 9.Manns MP, Woynarowski M, Kreisel W, et al. ; European AIH-BUC-Study Group. Budesonide induces remission more effectively than prednisone in a controlled trial of patients with autoimmune hepatitis. Gastroenterology. 2010;139(4):1198-206. [DOI] [PubMed] [Google Scholar]
- 10.U.S. Bureau of Labor Statistics. Consumer Price Index. Updated May 9, 2016. Available at: http://www.bls.gov/cpi/cpi_dr.htm. Accessed June 8, 2016.
- 11.Charlson ME, Pompei P, Ales KL, MacKenzie CR.. A new method of classifying prognostic comorbidity in longitudinal studies: development and validation. J Chronic Dis. 1987;40(5):373-83. [DOI] [PubMed] [Google Scholar]
- 12.Austin PC. Balance diagnostics for comparing the distribution of baseline covariates between treatment groups in propensity-score matched samples. Stat Med. 2009;28(25):3083-107. Available at: http://www.ncbi.nlm.nih.gov/pmc/articles/PMC3472075/. Accessed May 24, 2016. [DOI] [PMC free article] [PubMed] [Google Scholar]
- 13.Manson SC, Brown RE, Cerulli A, Vidaurre CF.. The cumulative burden of oral corticosteroid side effects and the economic implications of steroid use. Respir Med. 2009;103(7):975-94. Available at: http://www.resmedjourn-al.com/article/S0954-6111(09)00003-1/abstract. Accessed May 24, 2016. [DOI] [PubMed] [Google Scholar]
- 14.O’Neill S, Sweeney J, Patterson CC, et al. ; British Thoracic Society Difficult Asthma Network. The cost of treating severe refractory asthma in the UK: an economic analysis from the British Thoracic Society Difficult Asthma Registry. Thorax. 2015;70(4):376-78. [DOI] [PubMed] [Google Scholar]
- 15.van Staa TP, Leufkens HG, Cooper C.. The epidemiology of corticosteroid-induced osteoporosis: a meta-analysis. Osteoporos Int. 2002;13(10):777-87. [DOI] [PubMed] [Google Scholar]
- 16.Curtis JR, Westfall AO, Allison J, et al. Population-based assessment of adverse events associated with long-term glucocorticoid use. Arthritis Rheum. 2006;55(3):420-26. [DOI] [PubMed] [Google Scholar]
- 17.Thamer M, Hernán MA, Zhang Y, Cotter D, Petri M.. Prednisone, lupus activity, and permanent organ damage. J Rheumatol. 2009;36(3):560-64. Available at: http://www.ncbi.nlm.nih.gov/pmc/articles/PMC3624968/. Accessed May 24, 2016. [DOI] [PMC free article] [PubMed] [Google Scholar]
- 18.Saag KG, Koehnke R, Caldwell JR, et al. Low dose long-term corticosteroid therapy in rheumatoid arthritis: an analysis of serious adverse events. Am J Med. 1994;96(2):115-23. [DOI] [PubMed] [Google Scholar]
- 19.De Vries F, Bracke M, Leufkens HG, Lammers JW, Cooper C, van Staa TP.. Fracture risk with intermittent high-dose oral glucocorticoid therapy. Arthritis Rheum. 2007;56(1):208-14. [DOI] [PubMed] [Google Scholar]
- 20.Zonana-Nacach A, Barr SG, Magder LS, Petri M.. Damage in systemic lupus erythematosus and its association with corticosteroids. Arthritis Rheum. 2000;43(8):1801-08. [DOI] [PubMed] [Google Scholar]
- 21.Walsh LJ, Wong CA, Oborne J, et al. Adverse effects of oral corticosteroids in relation to dose in patients with lung disease. Thorax. 2001;56(4):279-84. Available at: http://thorax.bmj.com/content/56/4/279.long. Accessed May 24, 2016. [DOI] [PMC free article] [PubMed] [Google Scholar]
- 22.Steinbuch M, Youket TE, Cohen S.. Oral glucocorticoid use is associated with an increased risk of fracture. Osteoporos Int. 2004;15(4):323-28. [DOI] [PubMed] [Google Scholar]
- 23.van Staa TP, Leufkens HG, Abenhaim L, Zhang B, Cooper C.. Oral corticosteroids and fracture risk: relationship to daily and cumulative doses. Rheumatology (Oxford). 2000;39(12):1383-89. Available at: http://rheumatology.oxfordjournals.org/content/39/12/1383.long. Accessed May 24, 2016. [DOI] [PubMed] [Google Scholar]
- 24.Da Silva JA, Jacobs JW, Kirwan JR, et al. Safety of low dose glucocorticoid treatment in rheumatoid arthritis: published evidence and prospective trial data. Ann Rheum Dis. 2006;65(3):285-93. Available at: http://www.ncbi.nlm.nih.gov/pmc/articles/PMC1798053/. Accessed May 24, 2016. [DOI] [PMC free article] [PubMed] [Google Scholar]
- 25.Dixon WG, Suissa S, Hudson M.. The association between systemic glucocorticoid therapy and the risk of infection in patients with rheumatoid arthritis: systematic review and meta-analyses. Arthritis Res Ther. 2011;13(4): R139. Available at: http://www.arthritis-research.com/content/13/4/R139. Accessed May 24, 2016. [DOI] [PMC free article] [PubMed] [Google Scholar]
- 26.Santiago T, da Silva JA.. Safety of low- to medium-dose glucocorticoid treatment in rheumatoid arthritis: myths and reality over the years. Ann N Y Acad Sci. 2014;1318:41-49. [DOI] [PubMed] [Google Scholar]
- 27.Bernatsky S, Hudson M, Suissa S.. Anti-rheumatic drug use and risk of serious infections in rheumatoid arthritis. Rheumatology (Oxford). 2007;46(7):1157-60. Available at: http://rheumatology.oxfordjournals.org/content/46/7/1157.long. Accessed May 24, 2016. [DOI] [PubMed] [Google Scholar]
- 28.U.S. Food and Drug Administration. FDA approves the first nonhormonal treatment for hot flashes associated with menopause. June 28, 2013. Available at: http://www.fda.gov/NewsEvents/Newsroom/PressAnnouncements/ucm359030.htm. Accessed May 24, 2016.