

Abstract
BACKGROUND:
Optimized medication use involves the effective use of medications for better outcomes, improved patient experience, and lower costs. Few studies systematically gather data on the actions accountable care organizations (ACOs) have taken to optimize medication use.
OBJECTIVES:
To (a) assess how ACOs optimize medication use; (b) establish an association between efforts to optimize medication use and achievement on financial and quality metrics; (c) identify organizational factors that correlate with optimized medication use; and (d) identify barriers to optimized medication use.
METHODS:
This cross-sectional study consisted of a survey and interviews that gathered information on the perceptions of ACO leadership. The survey contained a medication practices inventory (MPI) composed of 38 capabilities across 6 functional domains related to optimizing medication use. ACOs completed self-assessments that included rating each component of the MPI on a scale of 1 to 10. Fisher’s exact tests, 2-proportions tests, t-tests, and logistic regression were used to test for associations between ACO scores on the MPI and performance on financial and quality metrics, and on ACO descriptive characteristics.
RESULTS:
Of the 847 ACOs that were contacted, 49 provided usable survey data. These ACOs rated their own system’s ability to manage the quality and costs of optimizing medication use, providing a 64% and 31% affirmative response, respectively. Three ACOs achieved an overall MPI score of 8 or higher, 45 scored between 4 and 7.9, and 1 scored between 0 and 3.9. Using the 3 score groups, the study did not identify a relationship between MPI scores and achievement on financial or quality benchmarks, ACO provider type, member volume, date of ACO creation, or the presence of a pharmacist in a leadership position. Barriers to optimizing medication use relate to reimbursement for pharmacist integration, lack of health information technology interoperability, lack of data, feasibility issues, and physician buy-in.
CONCLUSIONS:
Compared with 2012 data, data on ACOs that participated in this study show that they continue to build effective strategies to optimize medication use. These ACOs struggle with both notification related to prescription use and measurement of the influence optimized medication use has on costs and quality outcomes. Compared with the earlier study, these data find that more ACOs are involving pharmacists directly in care, expanding the use of generics, electronically transmitting prescriptions, identifying gaps in care and potential adverse events, and educating patients on therapeutic alternatives. ACO-level policies that facilitate practices to optimize medication use are needed. Integrating pharmacists into care, giving both pharmacists and physicians access to clinical data, obtaining physician buy-in, and measuring the impact of practices to optimize medication use may improve these practices.
What is already known about this subject
Many of the metrics for which accountable care organizations (ACOs) are held accountable are affected by medication use.
In 2012, ACOs were not prepared to optimize medication use.
ACOs that more broadly engage pharmacies adjust better to value-based payments.
What this study adds
Updated survey information shows how ACOs rate themselves as being better positioned to optimize quality of medication use than they are to optimize its costs.
Barriers to optimizing medication use relate to reimbursement for pharmacist integration, lack of health information technology interoperability, lack of data, feasibility issues, and physician buy-in.
The medication practices inventory captures ACO medication use practices and may be expanded to be used in other assessments.
Successfully treating many chronic conditions relies on effective medication use, with 72.5% or more of medical visits involving medications.1-4 Optimized medication use includes the broad spectrum of programs, services, and strategies that use medication effectively to promote better outcomes, improved patient experience, and lower costs. As health care reimbursement continues to shift to value-based contracting, the optimization of medication use will be integral5 to achieving the Triple Aim.6-8 Per the Institute for Healthcare Improvement, the Triple Aim outlines the 3 major goals of the health care industry: to improve the individual experience of care, to improve the health of the population, and to reduce per capita costs for care.6 Stakeholders throughout the health care system are striving to redress past policies, which encouraged the volume of interventions—rather than value—and contributed to uncontrolled growth in health care costs.9
Accountable care organizations (ACOs) and other risk-bearing provider entities are integral to the strategy of transforming the health care delivery system in the United States.10-13 ACOs aim to coordinate care, improve outcomes, and control costs. Evidence suggests that optimizing medication use may contribute to cost offsets and provide a significant return on investment, thus helping ACOs meet cost and quality bench-marks.8,14 Yet, despite the significant role medications play in managing chronic illnesses and the importance of managing chronic illness to ACO success, there has been limited investigation into how much ACOs focus on medication use. This study describes how ACOs optimize medication use as a part of their value-based contracting and care delivery.
Practices surrounding optimized medication use are cost-effective ways to improve patient outcomes and to reduce adverse events.15,16 Studies have demonstrated that using pharmacists to manage medication use improves outcomes and costs.17,18 Optimizing medication use is especially important to individuals with multiple comorbidities.19-23
Existing ACO quality metrics include many measures affected by medication use.8,24 Measures under development include metrics for unnecessary services and waste, patient education around medications, shared decision making, health-related quality of life, patient-reported outcomes, antibiotic stewardship, substance use disorders, and screening measures.25 The evaluation of ACOs has shown initially modest but growing cost savings to Medicare.9,26-28 Consequently, maintaining the momentum to develop and refine value-based models remains a health system priority.
The Centers for Medicare & Medicaid Services (CMS) has implemented many programs—e.g., bundled payments, Comprehensive Primary Care Plus, Oncology Care Models, the Medicare Shared Savings Program, and the Next Generation ACO Model—and has proposed other alternative payment models that may accelerate the transition to value. Commercial or private contracts also continue to grow significantly, as do Medicaid and state-level value-based contracts. In fact, commercial ACOs represent a higher member volume than do Medicare ACOs.25 ACO growth is expected to cover as many as 105 million lives, or more than 1 in 4 Americans, by 2020.12 When taken together, the importance of medications and ACOs to the future health care landscape should motivate research to investigate how ACOs optimize medication use.
To date, there have been few studies that systematically gather data on measures ACOs have taken to optimize medication use. One study, by Colla et al. (2015), found that 77% of 270 ACOs were held responsible for prescription spending on at least 1 contract and that ACOs that more broadly engaged pharmacy services adjusted better to value-based payments.5 Another study, by Dubois et al. (2014), examined ACO readiness to optimize medication use and found critical gaps in ACO preparedness to do so.28 More than 50% of the 46 responding ACOs rated themselves as unprepared on 13 of the 16 medication use-related topics measured in that study.28
This study expands on this body of work by drawing on a more comprehensive database of known ACOs and applying an adaptation of Leavitt Partners’ innovative ACO taxonomy.11,29 The survey used in this study incorporates some elements of the Dubois study but also expands the list of capabilities required to optimize medication use. The current study also includes 12 pair-wise interviews with ACO leadership, adding depth to the survey data.
This study provides ACO leadership with an updated landscape on medication use practices. It suggests ideas about the changes needed to support optimized medication use for ACOs, policymakers, payers, organizations that support ACOs through information technology, biopharmaceutical manufacturers, and institutions that train or advocate for the health care workforce.
There were 4 research objectives: (1) Measure the ability of ACOs to successfully optimize the pharmaceutical component of care; (2) identify what, if any, relationship practices to optimize medication use have on an ACO’s financial and quality performance; (3) identify organizational factors that correlate with and may influence an ACO’s capabilities to optimize medication use; and (4) identify potential barriers to instituting practices that optimize medication use.
Methods
This descriptive, cross-sectional qualitative study consisted of a survey and follow-up interviews. Both the survey and the interviews gathered information on the perceptions of ACOs’ leadership. ACOs were not asked to provide quantifiable data to support their responses. A comprehensive literature review of practices to optimize medication use was completed and used to form broad categories of initial capabilities, which served as important markers of ACOs’ ability to optimize medication use. Subsequently, 3 pharmacy experts were interviewed to aid in survey design. After the completion of the survey, cognitive testing was performed with 4 ACO pharmacy directors, and revisions were made.
Central to the survey was a comprehensive list of 38 components, including tools used by, tasks performed by, and capabilities of ACOs called the medication practices inventory (MPI). The MPI, which was designed for this study, allowed ACOs to rate themselves on a scale of 1 to 10, with 1 representing the lowest functioning, frequency, consistency, or skill and 10 representing the highest functioning, consistency, frequency, or skill. The survey also contained questions about ACOs’ descriptive characteristics and obstacles to optimizing medication use. The survey was administered through Qualtrics’ survey software from June 2015 to February 2016.30
The target population included all operational ACOs at the time of the study. The sampling frame for the study was the proprietary ACO database managed by Leavitt Partners. This database contains data on public and private ACOs, including information on the provider organizations forming the ACOs. ACOs were organized into groups based on the Leavitt Partners taxonomy. This taxonomy is based on the premise that, despite a shared goal, ACOs differ dramatically in organizational structure, ownership, and population served.29 The taxonomy divides ACOs into 6 core provider types, collapsed into 3 provider types for this study (Table 1). Attempts were made to contact 847 ACOs.
TABLE 1.
Summary of Descriptive Variables of Respondent Organizations and Statistically Significant Differences Between the Target Population and Survey Respondents
| ACO Characteristic | Groupings | ACO Database n = 847 (%) | NPC Survey n = 49 (%) | Significant Differencesa |
|---|---|---|---|---|
| Provider type | Hospital systemb | 27.4 | 28.6 | |
| Physician groupc | 42.7 | 24.5 | ≤ 0.05 | |
| Integrated systemd | 30.0 | 47.0 | ≤ 0.05 | |
| Percentage in rural arease | None | 6.1 | 2.0 | |
| < 50% | 59.5 | 63.3 | ||
| ≥ 50% | 34.4 | 34.7 | ||
| Estimated ACO member volumef | Fewer than 5,000 | 41.4 | 2.0 | ≤ 0.01 |
| 5,001 to 20,000 | 43.6 | 20.4 | ≤ 0.01 | |
| 20,001 to 100,000 | 5.7 | 51.0 | ≤ 0.01 | |
| 100,001 or more | 9.3 | 26.5 | ≤ 0.01 | |
| CMS programsg | Yes | 56.6 | 55.0 |
aSignificant P values are listed.
bHospital systems are ACOs that are hospitals or hospital systems.
cPhysician groups are ACOs comprising physicians or physician groups.
dIntegrated systems are ACOs comprising both hospitals and physician groups.
eRural areas were defined as the number of nonurban areas as defined by the U.S. Census Bureau ZIP codes covered in the hospital referral region.36
fACO member volume was defined as the number of patients for whom the ACO is responsible.
gACOs were considered CMS ACOs if they participated in the Pioneer, Medicare Shared Savings Program, Next Generation ACO Model, or the Oncology Care Model.
ACO = accountable care organization; CMS = Centers for Medicare & Medicaid Services; NPC = National Pharmaceutical Council.
Survey analyses included a calculation of survey-level response rates (Completed surveys ÷ [Completes + Partials] + [Refusals + No contacts] + [Not attempted]) and comparisons between respondent ACOs and target ACOs.31,32 Further analysis of the survey data used t-tests and logistic regression to assess relationships between scores on the MPI and responses related to ACO performance on financial and quality metrics, ACO provider type, member volume, year the ACO was created, and presence of a pharmacist in a leadership position.
CMS holds ACOs accountable for 33 quality metrics related to patient experience, care coordination and patient safety, preventive care, and care for at-risk populations.23 For the categorical analyses, MPI scores were divided into 3 groups: scores of 8 or above, scores of 4 to 7.9, and scores of 0 to 3.9. The 3 groups were approximated using the standard method of taking the mean score ± 2 standard deviations to create cut points.
The survey contained 1 question that asked ACOs whether they met, exceeded, or failed to meet financial benchmarks in the previous year. A second question asked ACOs to report on what percentage of quality measures they met or exceeded benchmarks. In the case of financial performance, ACOs meeting or exceeding financial metrics were coded as 1, whereas those failing to meet or unsure of achievement on financial benchmarks were coded as 0. Similarly, quality scores were collapsed into 2 categories, with ACOs scoring 70% or more on quality benchmarks coded as 1 and those meeting fewer than 70% of quality benchmarks coded as 0. The cut point of 70% was based on the initial CMS scoring of quality measures in 42 CFR 425.502, requiring that ACOs meet at least 70% of measures in each quality domain. Earned shared savings or financial metrics are related to quality metric achievement.23 A similar cutoff, above and below 70%, was used to report the scores on the MPI.
For interviews, MPI scores were used to rank ACOs relative to each other, and ACOs were sorted into groups by the 3 provider types. Four ACOs were chosen from each of the 3 provider type groups: 2 with relatively high MPI scores and 2 with the lowest scores. Twelve 1-hour interviews were completed with an ACO executive and/or the director of pharmacy. In some cases, interviews were conducted with the same executive who answered the survey questions. However, if the original executive was unavailable, another knowledgeable executive was interviewed. Interviews were analyzed using the grounded theory approach.33-35 Relevant summarized results from the structured interviews provide additional detail or potential explanations for data found in the survey results.
Results
Respondent Characteristics
Of the 847 ACOs in the database, 49 completed a substantial portion or all of the survey, a response rate of 5.8%. A comparison of ACOs that participated in this research is shown in Table 1. Participating ACOs were different from the overall ACO population in that they included a higher proportion of integrated systems (47%) when compared with the target population (30%) and a lower proportion of physician groups (24.5%) than did the target population (42.7%). Participating ACOs also had higher member volume, with 77.5% of them covering more than 20,000 members, compared with 15% in the broader ACO population.
ACO Optimization of Medication Use
The survey asked ACOs to rate their preparation to manage the quality and cost of medication use on a scale of 1 to 100. On quality, 64% of ACOs rated themselves at or above 70 on the rating scale. Fewer ACOs, 31%, rated their preparation to manage the cost of medication use at or above 70. Overall, responses showed that in 50% of ACOs, no pharmacist held a leadership position. In 13% of ACOs, a pharmacist held a position on the executive team.
When placed into categories based on mean score on the MPI, 3 ACOs achieved scores between 8 and 10, 45 achieved scores between 4 and 7.9, and 1 achieved a score between 0 and 3.9. Using these categories, multinomial logistic regression revealed no significant associations between ACO score on the MPI and ACO reports of meeting 70% or more of quality metrics. There was also no significant association between MPI scores and whether ACOs met or exceeded financial benchmarks. Finally, there was no significant relationship between MPI scores and ACO characteristics, including provider type, member volume, formation date, or the presence of a pharmacist in a leadership position.
ACOs indicated their performance on each component of the MPI on a scale of 1 to 10, with 1 indicating the lowest performance and 10 indicating the highest. Using the CMS requirement that ACOs perform 70% or higher on quality measures, the study reported ratings as the percentage of ACOs that ranked themselves as performing at a 7 or above on a scale of 1 to 10 (Figure 1). The proportion of ACOs performing at or above 7 was lowest in regard to notification of pharmacies when a prescription is canceled (14.3%) and notification of primary care providers when a prescription is discontinued (14.3%). On the other end of the rating continuum, the largest percentage of ACOs ranked themselves as performing at a rank of 7 or higher on their ability to transmit prescriptions electronically for noncontrolled substances (91.8%) and notifying providers of known drug allergies (89.8%), both in the health information technology (HIT) domain. The MPI was organized conceptually into 6 functional domains that are important to effective integration of medication use practices into an ACO. Specific domain scores are provided in Table 2.
FIGURE 1.
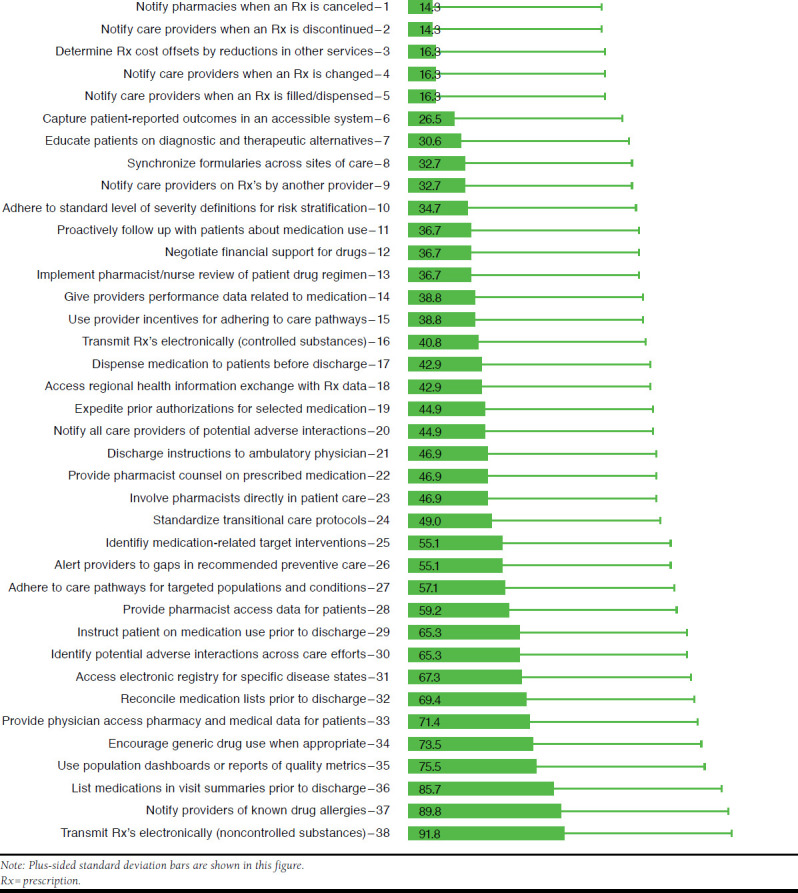
Percentage of ACOs Indicating They Perform at a Rank of 7 or Above, on a Rating Scale of 1 to 10, on Each of the 38 Components of the Medication Practices Inventory (n = 44-49)
TABLE 2.
Medication Practices Inventory Scores by Domain and Percentage of ACOs that Scored 7 or Higher by Domain
| Domains | N | Mean Score (SD) | Percentage Scoring 7 or Higher (SD) | Components | MPI Component Numbers |
|---|---|---|---|---|---|
| Analytics and evaluation | 49 | 4.9 (1.9) | 12.0 (33.0) | Determine if Rx costs are offset by reductions in other services | 3 |
| Capture patient-reported outcomes in an accessible system | 6 | ||||
| Give providers performance data related to medications | 14 | ||||
| Identify medication-related target interventions | 25 | ||||
| Care teams and clinical protocols | 40 | 5.3 (2.2) | 22.5 (42.3) | Adhere to standard level of severity definitions for risk stratification | 10 |
| Implement pharmacist/nurse review of patient drug regimen | 13 | ||||
| Use provider incentives for adhering to care pathways | 15 | ||||
| Involve pharmacists directly in patient care | 23 | ||||
| Adhere to care pathways for targeted populations and conditions | 27 | ||||
| Discharge planning and transitional care | 42 | 6.4 (1.5) | 33.3 (47.7) | Dispense medications to patients before discharge and proactively follow up | 11, 17 |
| Discharge instructions to ambulatory physician | 21 | ||||
| Standardize transitional care protocols | 24 | ||||
| Reconcile medication lists and include in visit summaries prior to discharge | 32, 36 | ||||
| Health information technology | 41 | 5.7 (1.5) | 19.5 (40.1) | Notify pharmacies when Rx’s are canceled | 1 |
| Notify care providers when Rx’s are discontinued, changed, filled/dispensed, prescribed by another provider | 2, 4, 5, 9 | ||||
| Synchronize formularies across sites of care | 8 | ||||
| Transmit Rx’s electronically (controlled/noncontrolled substances) | 16, 38 | ||||
| Access regional health information exchange with Rx data | 18 | ||||
| Identify and notify all care providers of potential adverse interactions, known drug allergies | 20, 30, 37 | ||||
| Provide physician and pharmacists access to pharmacy and medical patient data, including alerts to gaps in preventive care | 26, 28, 33 | ||||
| Access electronic registry for specific disease states | 31 | ||||
| Use population dashboards or reports of quality metrics | 35 | ||||
| Patient education | 48 | 5.9 (2.1) | 31.3 (46.8) | Educate patients on diagnostic and therapeutic alternatives | 7 |
| Provide pharmacist counsel on prescribed medications | 22 | ||||
| Instruct patient on medication use prior to discharge | 29 | ||||
| Prescribing practices | 48 | 6.1 (2.3) | 34.7 (48.1) | Negotiate financial support for expensive drugs | 12 |
| Expedite prior authorizations for selected medications | 19 | ||||
| Encourage generic drug use when appropriate | 34 |
MPI = medication practices inventory; Rx = prescription; SD = standard deviation.
To obtain preliminary results on challenges to optimizing medication use, survey respondents were asked to indicate the severity of barriers to optimizing medication use based on a sample of 10 components on the MPI as shown in Figure 1, components 12, 14, 19, 21, 22, 25, 29, 34, 35, and 36. Respondents chose between 3 types of barriers and had to rate each as a severely limiting, a moderately limiting, or not a limiting factor to optimization of medication use. Issues related to the first barrier, feasibility (e.g., workforce availability and technology) were ranked highest for all 10 questions. For instance, 96% of respondents indicated that feasibility was a moderately or severely limiting factor to proactively following up with patients about medication use.
The second and third limitations, budget considerations and buy-in from leadership and/or the care team, were selected by 86% and 41% of respondents, respectively. Budget concerns were selected by 80% or more of respondents as a limitation for providing a pharmacist’s counsel on prescribed medications and for reconciling medication lists before discharge. Leadership and care team buy-in was selected as a limiting factor by 82% of respondents for encouraging generic drug use through a standard formulary.
Interviews
The 12 ACOs interviewed were asked to rate the priority of medication use priorities relative to other areas of ACO focus. Five of the 6 ACOs with the lowest scores relative to other ACO respondents indicated that practices to optimize medication use were moderate to low priorities, while 2 of the 6 ACOs with the highest scores relative to other ACOs indicate the same.
In terms of HIT, ACOs reported varying levels of technology sophistication specifically focused on medication use optimization. Table 3 summarizes quotes indicating various levels of using HIT for optimizing medication use. The interviews indicated that ACOs with relatively higher MPI scores tended to have either a single integrated electronic health record (EHR) across the ACO or software that allowed 2-way interfaces or data mining across multiple EHRs. In contrast, ACOs with relatively lower MPI scores indicated that they had multiple health records and more challenges with HIT interoperability.
TABLE 3.
Interview Respondent Quotes on the Use of Health Information Technology and Integration of Pharmacists
| Use of HIT |
| Limited use of HIT |
| “And that’s probably why you’ll see our hands-on approach, it’s because of the weaknesses of the electronic transfer of information, it’s not very reliable.” (Hospital, ACO 1) |
| “As far as medication use, I’m not sure our IT system has really addressed that …” (Physician, ACO 8) |
| Intermediate use of HIT |
| “We build a two-way interface with our preferred hospitals. We know our hospitals use that because we can see in the discharge notes that they are looking at patients’ medication lists.” (Provider, ACO 6) |
| “We’ve got some technology … that’s able to pull data from different EHRs. We look at patients … that are on [multiple] medications.” (Physician, ACO 7) |
| Multifaceted or complex use of HIT |
| “We’ve got a lot of informatics, population health initiatives and registries. We can quickly identify patients who are not meeting objective goals of chronic disease management.” (Hospital, ACO 2) |
| “We’ve got several mobile apps that are very detailed in showing the patients what they’re on, what it costs, and what the alternatives are.” (Integrated, ACO 11) |
| “We are an HIMSS stage 7 organization. We have a pharmacist IT team that manages the entire medication profile [and] supports safe prescribing of medications.” (Integrated, ACO 12) |
| Integration of Pharmacists |
| Beginning or intermediate integration of pharmacists |
| “One of our larger regions brought in a pharmacist in one practice to really get a handle on the prescribing habits. And I think it was in a six-month period, saved just that one practice a quarter of a million dollars, not to mention better care delivery.” (Hospital, ACO 3) |
| “We embed clinical pharmacy in two of our primary care practices so that the clinical pharmacists are actually seeing patients. So, that’s a pilot program … ” (Hospital, ACO 4) |
| “I think the pharmacists would generally like to have more involvement in trying to assist the physicians with some of these things. But it can be hard to justify new positions [or] resources within pharmacy to actually be dedicated for that purpose since it’s not necessarily a money-making endeavor.” (Integrated, ACO 11) |
| Broader integration of pharmacists |
| “When I’ve talked to other delivery systems, we have a bigger investment than most in clinical pharmacists. So, every practice site has an embedded clinical pharmacist. The practices consider the clinical pharmacist a member of the team.” (Physician, ACO 6) |
| “I’ve got a team of about 12 pharmacists. Each of them is assigned different topics or subject matter areas … [They are] really focused mainly on what’s happening in our clinics and hospitals. We have several pharmacists that sit on our P&T committee.” (Integrated, ACO 9) |
| “[It is] very high on our list in terms of making sure that we are having our pharmacists practice at the top of their license.” (Integrated, ACO 12) |
ACO = accountable care organization; EHRs = electronic health records; HIMSS = Healthcare Information and Management Systems Society; HIT = health information technology; IT = information technology; P&T = pharmacy and therapeutics.
Where care teams and protocols were concerned, interviews revealed that 5 of 6 ACOs with relatively higher MPI scores had a separate pharmacy department or group staffed by pharmacists, while 3 of 6 of the ACOs with relatively lower scores had a separate pharmacy department or group. Table 3 contains quotes describing the varying levels of pharmacist integration. ACOs with relatively lower MPI scores tended to focus less on achieving physician buy-in proactively. Rather, they assumed clinicians agreed with policies until problems surfaced. ACOs with higher MPI scores tended to seek buy-in actively by vetting policy, seeking consensus, or requesting feedback from physicians, pharmacists, and other care team members.
The interviews identified several barriers to optimizing medication use. In the areas of analytics and evaluation, interviewees indicated that limited data sharing, lack of interoperability, and absence of a “single source of truth” for data were barriers to optimized medication use practices. Other interviewees indicated that obtaining physician buy-in to integrating pharmacists was often an obstacle to optimize medication use. Two interviewees described situations in which physicians ultimately, after initial hesitation, found great value added from pharmacists’ clinical integration.
Interviewees identified 2 additional obstacles related to pharmacists: (1) In many cases pharmacists do not operate to the full extent of their license, and (2) there is a lack of reimbursement for services provided by pharmacists. With limited reimbursement for pharmacists’ services, some ACOs find it difficult to invest in full-time pharmacists to engage in medication use practices.
The interview results added to the 4 components on the MPI that were specific to pharmacists’ involvement. Fifty-nine percent of ACOs gave themselves a rank of 7 or higher out of 10 on giving pharmacists access to pharmacy and medical data on patients. However, less than 50% of the ACOs involve pharmacists directly in patient care, provide pharmacists’ counsel on prescribed medications, or have a pharmacist or nurse review patients’ drug regimens.
Discussion
The study attempted to measure the ability of ACOs to successfully optimize medication use. ACOs rated themselves as being better positioned to optimize the quality than the costs of medication use. ACOs interviewed recognized the importance of optimized medication use. However, because of conflicting priorities, the transition from recognizing the importance to taking action to improve medication use has been slow. Self-rating scores suggest most ACOs generally do not believe themselves to operate with high functioning, frequency, consistency, or skill on the components measured by the MPI. Despite a tendency in survey research for respondents to present themselves positively, there were still very few ACOs that rated themselves as scoring the highest levels of the MPI.
However, based on research by Dubois et al. (2014), we found evidence to suggest that in some areas ACOs are giving more attention to some practices to optimize medication use than they did before.28 Table 4 shows comparable questions between the Dubois et al. survey and those included in the MPI used in this study. Although the wording of the medication use components is different between the 2 studies, several are comparable. Table 4 shows those areas where there has been a statistically significant increase in ACO scores. Specifically, more ACOs give themselves higher scores on educating patients about alternatives when determining the recommended medication regimen. This is significant, considering that patient education is a pending CMS metric.24
TABLE 4.
Comparisons of Medication Use Components from the Dubois et al. 2014 Study and the Current Study
| 2014 Study Components28 | Current Component (Component Number) | 2014 Study (na = 46) (Nb = 175) % | Current Study (na = 49) (Nb = 847) % | Significancec |
|---|---|---|---|---|
| Quantify medication offsets | Determine if medication costs are offset by reductions in use of other services (3)d | 7 | 16 | ≤ 0.10 |
| Notify care providers when a prescription is filled | Notify a patient’s care providers when prescriptions are filled and dispensed (5)e | 9 | 16 | |
| Educate patients about alternatives/implications when determining the recommended medication care plan | Educate patients on diagnostic and therapeutic alternatives and their implications (7)f | 11 | 31 | ≤ 0.01 |
| Share potential drug-drug/drug-disease/polypharmacy concerns with the care team | Notify all patient care providers of potential drug-drug, drug-disease, and polypharmacy adverse interactions (20)g | 13 | 45 | ≤ 0.01 |
| Capture patient-reported outcomes electronically | Capture patient-reported outcomes in a provider-accessible electronic system (6)d | 15 | 27 | ≤ 0.10 |
| Notify care providers when Rx’s are prescribed | Notify a patient’s care provider when medications are prescribed by another provider (9)g | 20 | 33 | ≤ 0.10 |
| Involve pharmacists in direct patient care | Involve pharmacists directly in patient care (23)h | 22 | 47 | ≤ 0.01 |
| Alert providers of preventive care gaps | Automatically alert providers of gaps in recommended preventive care (26)g | 28 | 55 | ≤ 0.01 |
| Synchronize formularies across different care sites | Synchronize formularies across sites of care (8)g | 35 | 33 | |
| Identify potential drug-drug, drug-disease, and/or polypharmacy concerns | Identify potential adverse interactions across all patient care efforts (30)g | 43 | 65 | ≤ 0.05 |
| Encourage appropriate generic use with formularies | Encourage generic drug use when appropriate (34)i | 50 | 73 | ≤ 0.01 |
| View prescription and medical data in 1 system | Provide physician access to integrated electronic pharmacy and medical data for individual patients at the point of care (33)g | 54 | 71 | ≤ 0.05 |
| Provide pharmacist access to integrated electronic pharmacy and medical data (28)g | 54 | 59 |
an = number of survey respondents.
bN = number of ACOs in the target population.
cSignificant P values are shown.
dDomain = Analytics and evaluation.
eDomain = Discharge planning and transitional care.
fDomain = Patient education.
gDomain = Health information technology.
hDomain = Care teams and clinical protocols.
iDomain = Prescribing practices.
In the future, all ACOs will need to address performance on this component. In terms of the care team, more ACOs are involving pharmacists in direct patient care. Focus on appropriate generic use has also expanded. In HIT, more ACOs identify and notify care providers of potential adverse events, alert providers to gaps in preventive care, and electronically transmit prescriptions for noncontrolled substances than in the previous study. In the analytics and evaluation domain, no significant changes were measured between the 2 studies. Interestingly, the analytics and evaluation domain is also the domain in the MPI with the lowest overall mean, reinforcing the idea that studies that measure the impact of optimized medication use practices on total cost of care and in patient outcomes are limited.
The study did not discover significant relationships between ACO absolute aggregate scores on the MPI and ACO achievement of financial or quality outcomes. Nor were there clear organizational characteristics that differentiated performance on the MPI. This may suggest that challenges or strengths related to medication use practices are not limited to a specific type of ACO. Alternatively, it is noteworthy that of the 49 ACOs that answered the ranking questions, only 6% achieved an aggregate score of 8 or above (out of 10). The low representation of the highest scorers in the sample may have made it difficult to detect differences on scores by ACO characteristics.
This conclusion was supported when different cut points were used to sort ACOs. For instance, when scores on the MPI were placed into 2 groups, those with an overall score of less than 7 and those with a score of 7 or higher, we found that ACOs with scores of 7 or higher were more likely to have been operating for a longer period. They were also more likely to feel prepared to manage the cost and quality of pharmaceutical care.
There are several possibilities for why more ACOs did not score themselves higher on optimizing medication use practices. In terms of payment and service delivery reform, ACOs are still new in their development. Policies related to optimizing medication use are either still being developed or are evolving rapidly. Several ACOs that participated in this research are beginning to track cost offsets due to medication optimization. This kind of quantitative data will help establish relationships between optimization of medication use practices and quality and cost benchmarks.
More comprehensive strategies are hindered by the lack of reimbursement for pharmacists’ services, poor technology interoperability, and the difficulty of isolating and evaluating the cost savings associated with better medication use practices. Some ACOs have found creative ways to address these obstacles. In 1 system, all of the ACO’s providers contributed to the investment in pharmacists so that no one entity had to bear the full cost burden. Other ACOs, instead of waiting for data from payers, are implementing pilot projects that involve practices to optimize medication use and are gathering data on cost savings and/or improved outcomes.
Three of the participating ACOs indicated that they were in the process of implementing or evaluating the impact of specific medication use interventions on the costs and quality metrics of the ACO. These interventions include case-control models in which pharmacists become embedded or responsible for the medication use of a subsection of high-risk patients. It is important that data from such interventions are disseminated. It is also important to provide systematic quantitative data that support what many ACO leaders seem to recognize—but are yet unable to prove—about the benefits including cost-effectiveness of efforts to optimize medication use.
As noted in Table 1, the respondent group contained more ACOs with a member volume of 20,001 or more (77.5%) than in the ACO population (15.0%) represented by the Leavitt Partners database. The respondent group also had more integrated systems (47.0%) than the ACO population (30.0%), but fewer physician groups (24.5%) than the ACO population (42.7%). As indicated in the Leavitt Partners taxonomy, types of ACOs vary in their level of integration, differentiation, and centralization. These factors may influence the type, sophistication, and effectiveness of medication use practices. Specifically, integrated systems tend to have more established HIT infrastructure and more sophisticated analytics.29
By comparison, physician groups may have less sophisticated HIT systems. It may be that this research captured technical abilities that were on either end of the HIT spectrum and that more ACOs are more likely to be somewhere along the continuum between using HIT to optimize medication use management and not using it at all. The same reasoning applies to the overrepresentation of large ACOs. It may be that this study did not capture more of those ACOs that would self-rate at the lower end of the spectrum on their preparation to manage the cost and quality of medication use practices.
Implications
Overall, ACO leaders recognize that improving medication use requires increased strategic focus. However, competing priorities and other challenges inhibit development and implementation of medication use practices. Several forces may increase the attention that ACOs give to medication use practices. Among them is the increased number of medication-related quality metrics that CMS plans to roll out to its ACOs. The new metrics will facilitate more data collection related to medication use practices by CMS and other payers.
In addition, it is likely that the health care system will revisit payment for pharmacists’ services as more data show the cost savings and improved outcomes associated with the integrating pharmacists. Furthermore, reevaluating relationships with the pharmaceutical industry (e.g., performance-based contracting) and the transforming health care system will likely increase attention given to optimizing medication use. When more clear data are available from within ACOs, especially data on chronic illnesses, the pathway to optimize medication use practices may be easier to navigate as ACOs understand the impact on total cost of care and overall quality.
Limitations
Data from this study contribute to our understanding of how ACOs assess themselves on optimizing medication use. However, caution must be used in interpreting and generalizing the results. It is possible that the participating ACOs differ in meaningful ways from those not participating, resulting in response bias and lack of representativeness. Although several researchers independently reviewed the interview data and then came to a consensus, there is also the possibility of researcher bias in the interview data analyses.
Finally, both the survey and interviews collected perception data from ACO leadership. There may be substantive differences between the estimates provided on the survey or in interviews and the actual figures. For instance, survey respondents may not have accurately recalled the percentage of quality measures met or the number of pharmacists employed. In addition, although the survey instrument and the MPI were carefully constructed, this study did not include tests for reliability and validity of the survey instrument.
Conclusions
Because of its important nature, ongoing efforts are required to gather systematic data on medication use practices and to provide ACOs with technical assistance on measuring and understanding potential cost offsets in decreased use of other services achieved through practices to optimize medication use. The MPI used in this study would benefit from validation and refinement so that it can be used as part of the ongoing assessment. Medication use practices may be easier to implement if ACOs provide access to data to both pharmacists and physicians, focus on removing technological barriers, gather buy-in from front-line physicians, and integrate pharmacists into care teams. Policies that remove barriers to or incentivize integration of practices to optimize medication use practices—and integrate pharmacists into care delivery—are likely to improve medication use in ACOs, which should enhance achievement of the Triple Aim.
ACKNOWLEDGMENTS
The authors acknowledge the contributions of the following: Jerry Penso, MD, MBA, AMGA; Robert DeVol, MA, Premier; Marv Feldman, MS, RPh, Premier; William Caughey, MS, Leavitt Partners; Alex Anderson, Leavitt Partners; Mallory Ekstrom, MPP, Leavitt Partners; and Susan Winckler, RPh, JD, Leavitt Partners.
REFERENCES
- 1.Kantor ED, Rehm CD, Haas JS, Chan AT, Giovannucci EL.. Trends in prescription drug use among adults in the United States from 1999-2012 [editorial comment]. Obstet Gynecol Surv. 2016;71(3):131-33. [Google Scholar]
- 2.Kantor ED, Rehm CD, Haas JS, Chan AT, Giovannucci EL.. Trends in prescription drug use among adults in the United States from 1999-2012. JAMA. 2015;314(17):1818-31. [DOI] [PMC free article] [PubMed] [Google Scholar]
- 3.Nianogo T, Okunade A, Fofana D, Chen W.. Determinants of U.S. prescription drug utilization using county level data. Health Econ. 2016;25(5):606-19. [DOI] [PubMed] [Google Scholar]
- 4.Centers for Disease Control and Prevention. National Center for Health Statistics. Therapeutic drug use. July 4, 2014. Available at: http://www.cdc.gov/nchs/fastats/drug-use-therapeutic.htm. Accessed May 8, 2017.
- 5.Colla CH, Lewis VA, Beaulieu-Jones BR, Morden NE.. Role of pharmacy services in accountable care organizations. J Manag Care Spec Pharm. 2015;21(4):338-44. Available at: http://www.jmcp.org/doi/pdf/10.18553/jmcp.2015.21.4.338. [DOI] [PMC free article] [PubMed] [Google Scholar]
- 6.Berwick DM, Nolan TW, Whittington J.. The triple aim: care, health, and cost. Health Aff (Millwood). 2008;27(3):759-69. [DOI] [PubMed] [Google Scholar]
- 7.Lunner K, Smith M, Pena C.. Optimized medication use: a growing priority for ACOs. Leavitt Partners. February 2014. [Google Scholar]
- 8.Chee TT, Ryan AM, Wasfy JH, Borden WB.. Current state of value-based purchasing programs. Circulation. 2016;133(22):2197-205. [DOI] [PMC free article] [PubMed] [Google Scholar]
- 9.Burwell SM. Setting value-based payment goals--HHS efforts to improve U.S. health care. N Engl J Med. 2015;372(10):897-99. [DOI] [PubMed] [Google Scholar]
- 10.Albright BB, Lewis VA, Ross JS, Colla CH.. Preventive care quality of Medicare accountable care organizations: associations of organizational characteristics with performance. Med Care. 2016;54(3):326-35. [DOI] [PMC free article] [PubMed] [Google Scholar]
- 11.Muhlestein D, Gardner P, Caughey W, de Lisle K.. Projected growth of accountable care organizations. Leavitt Partners. December 23, 2015. Available at: http://leavittpartners.com/2015/12/projected-growth-of-accountable-care-organizations/. Accessed May 8, 2017.
- 12.The Henry J. Kaiser Family Foundation. An overview of Medicare. Issue brief. April 2016. Available at: http://files.kff.org/attachment/issue-brief-an-overview-of-medicare. Accessed May 8, 2017.
- 13.Smith M, Giuliano MR, Starkowski MP.. In Connecticut: improving patient medication management in primary care. Health Aff (Millwood). 2011;30(4):646-54. [DOI] [PubMed] [Google Scholar]
- 14.Griesbach S, Lustig A, Malsin L, Carley B, Westrich KD, Dubois RW.. Best practices: an electronic drug alert program to improve safety in an accountable care environment. J Manag Care Spec Pharm. 2015;21(4):330-36. Available at: http://www.jmcp.org/doi/pdf/10.18553/jmcp.2015.21.4.330. [DOI] [PMC free article] [PubMed] [Google Scholar]
- 15.Smith M, Bates DW, Bodenheimer TS.. Pharmacists belong in accountable care organizations and integrated care teams. Health Aff (Millwood). 2013;32(11):1963-70. [DOI] [PubMed] [Google Scholar]
- 16.Alhossan A, Kennedy A, Leal S.. Outcomes of annual wellness visits provided by pharmacists in an accountable care organization associated with a federally qualified health center. Am J Health Syst Pharm. 2016;73(4):225-28. [DOI] [PubMed] [Google Scholar]
- 17.He L-R, Qiao W, Liao Z-X, et al. Impact of comorbidities and use of common medications on cancer and non-cancer specific survival in esophageal carcinoma. BMC Cancer. 2015;15. [DOI] [PMC free article] [PubMed] [Google Scholar]
- 18.Donaldson M, Epstein J, Villines D.. Managing the care of patients with Sjögren syndrome and dry mouth: comorbidities, medication use and dental care considerations. J Am Dent Assoc. 2014;145(12):1240-47. [DOI] [PubMed] [Google Scholar]
- 19.Loeppke R, Haufle V, Jinnett K, et al. Medication adherence, comorbidities, and health risk impacts on workforce absence and job performance. J Occup Environ Med. 2011;53(6):595-604. [DOI] [PubMed] [Google Scholar]
- 20.Barnes PJ. Future treatments for chronic obstructive pulmonary disease and its comorbidities. Proc Am Thorac Soc. 2008;5(8):857-64. [DOI] [PubMed] [Google Scholar]
- 21.Fitzgerald SP, Bean NG.. An analysis of the interactions between individual comorbidities and their treatments—implications for guidelines and polypharmacy. J Am Med Dir Assoc. 2010;11(7):475-84. [DOI] [PubMed] [Google Scholar]
- 22.Dubois RW, Feldman M, Martin J, Sanderson-Austin J, Westrich KD, Medication WGO.. Role of pharmaceuticals in value-based healthcare: a framework for success. Am J Manag Care. 2012;18(7):E243-45. [PubMed] [Google Scholar]
- 23.RTI International. Accountable care organization 2015 program analysis quality performance standards narrative measure specifications. Centers for Medicare & Medicaid Services. January 9, 2015. Available at: https://www.cms.gov/medicare/medicare-fee-for-service-payment/sharedsavingsprogram/downloads/ry2015-narrative-specifications.pdf. Accessed May 8, 2017.
- 24.Centers for Medicare & Medicaid Services. Consensus core set: ACO and PCMH/primary care measures. Version 1.0. February 2016. Available at: https://www.cms.gov/Medicare/Quality-Initiatives-Patient-Assessment-Instruments/QualityMeasures/Downloads/ACO-and-PCMH-Primary-Care-Measures.pdf. Accessed May 8, 2017.
- 25.Muhlestein D, McClellan M.. Accountable care organizations in 2016: private and public-sector growth and dispersion. Health Affairs Blog. April 2016. Available at: http://healthaffairs.org/blog/2016/04/21/accountable-care-organizations-in-2016-private-and-public-sector-growth-and-dispersion/. Accessed May 8, 2017.
- 26.McWilliams JM, Hatfield LA, Chernew ME, Landon BE, Schwartz AL.. Early performance of accountable care organizations in Medicare. N Engl J Med. 2016;374(24):2357-66. [DOI] [PMC free article] [PubMed] [Google Scholar]
- 27.McWilliams JM, Chernew ME, Landon BE, Schwartz AL.. Performance differences in year 1 of pioneer accountable care organizations. N Engl J Med. 2015;372(20):1927-36. [DOI] [PMC free article] [PubMed] [Google Scholar]
- 28.Dubois RW, Feldman M, Lustig A, et al. Are ACOs ready to be accountable for medication use? J Manag Care Pharm. 2014;20(1):17-21. Available at: http://www.jmcp.org/doi/pdf/10.18553/jmcp.2014.20.1.17. [DOI] [PMC free article] [PubMed] [Google Scholar]
- 29.Muhlestein D, Gardner P, Merrill T, Petersen M, Tu T.. A taxonomy of accountable care organizations: different approaches to achieve the triple aim. Leavitt Partners. June 2014. Page 12. Available at: http://www.leavittpartners.com/wp-content/uploads/2014/06/A-Taxonomy-of-Accountable-Care-Organizations.pdf. Accessed May 22, 2017.
- 30.Qualtrics. Q support. Cite or reference Qualtrics in research. 2015. Available at: https://www.qualtrics.com/support/research-resources/cite-reference-qualtrics-research/. Accessed May 8, 2017.
- 31.The American Association for Public Opinion Research. Standard definitions: final dispositions of case codes and outcome rates for surveys. Revised 2016. Available at: http://www.aapor.org/AAPOR_Main/media/publications/Standard-Definitions20169theditionfinal.pdf. Accessed May 8, 2017.
- 32.Smith T. A revised review of methods to estimate the status of cases with unknown eligibility. American Association for Public Opinion Research. August 2009. Available at: https://www.aapor.org/AAPOR_Main/media/MainSiteFiles/FindingE.pdf. Accessed May 8, 2017.
- 33.Charmaz K. Constructing Grounded Theory: A Practical Guide Through Qualitative Analysis. Thousand Oaks, CA: Sage Publications; 2006. [Google Scholar]
- 34.Patton MQ. Qualitative Research and Evaluation Methods. 3rd ed. Thousand Oaks, CA: Sage Publications; 2002. [Google Scholar]
- 35.Miles M, Huberman A.. Qualitative Data Analysis. 2nd ed. Thousand Oaks, CA: Sage Publications; 1994. [Google Scholar]
- 36.U.S. Census Bureau. 2010 census urban area FAQs: urban-rural classification program. February 9, 2015. Available at: https://www.census.gov/geo/reference/ua/uafaq.html. Accessed May 8, 2017.