

Abstract
BACKGROUND:
Membranous nephropathy (MN) is a common cause of nephrotic syndrome in nondiabetic adults. Approximately one third of patients with MN progress to end-stage renal disease (ESRD), while others may be successfully treated to remission. Patients with MN represent a high-risk population for whom management strategies can alter and improve outcomes. Currently, there is little real-world evidence regarding the burden of MN on health plans.
OBJECTIVES:
To (a) characterize clinical and economic outcomes during a 1-year time frame among a prevalent cohort of patients with MN and (b) compare the 5% of patients incurring the highest cost with the remaining 95%.
METHODS:
A retrospective analysis of commercially insured patients was conducted using MarketScan administrative health care claims data from January 1, 2012, to December 31, 2015. Patients were aged ≥ 18 years, enrolled In a fee-for-service plan, and had ≥ 2 medical claims for an MN diagnosis (ICD-9-CM codes 581.1, 582.1, and 583.1). Diagnoses indicating clear secondary causes were excluded wherever possible. Demographics were determined as of the first diagnosis date; clinical characteristics (e.g., MN-specific therapy, complications, and procedures), health care resource utilization (HCRU; inpatient, outpatient including other outpatient and emergency department [ED], and prescriptions), and costs were evaluated for 1 year following MN diagnosis. Total costs and cost distribution (2017 U.S. dollars) were examined using plan-paid and patient-paid amounts. The 95th percentile was used to categorize and compare the subcohorts: high-cost cohort (HCC) patients (top 5%) and non-high-cost cohort (NHCC) patients (the remaining 95%). Descriptive analyses, chi-square tests, and Wilcoxon rank-sum tests were conducted.
RESULTS:
2,689 patients were identified (60.0% male, mean age = 46.4 years). Severity and advanced disease were observed In a higher proportion of HCC patients (n = 134) versus NHC patients (n = 2,555) via adverse health outcomes, procedures, and immunosuppressant use. HCC patients used significantly more resources on average than NHCC patients (additional use): 1.7 inpatient, 1.2 ED, and 4.8 outpatient office visits; 15 prescriptions; and 64.8 other outpatient visits (i.e., outpatient, hospital, and ESRD facilities). Total MN-related cost and mean (SD) cost per patient were $123.2 million and $45,814 ($101,353); HCC patients accounted for 43.7% of total costs for a mean cost per patient of $401,608 versus NHCC patients at 56.3% and mean cost per patient of $27,154. The greatest costs for both groups were related to outpatient visits (HCC = 46.7%; NHCC = 52.8%), inpatient visits (HCC = 27.7%; NHCC = 28.6%), and prescriptions (HCC = 25.7%; NHCC = 18.6%).
CONCLUSIONS:
Patients with MN are significantly burdened with high disease severity and adverse health outcomes, resulting In substantial HCRU and costs. Health plan cost drivers for MN (HCC and NHCC patients) occurred primarily In the outpatient setting, followed by the inpatient setting and prescriptions. Modifiable aspects preceding progression to advanced renal disease and worse outcomes should be explored to Identify effective interventions and improve resource allocation earlier In the disease pathway, before ESRD.
What is already known about this subject
Glomerulonephritis, including membranous nephropathy (MN), is a prevalent and expensive cause of end-stage renal disease (ESRD).
Over one third of patients with MN progress to ESRD or mortality; others represent an opportunity for successful treatment to remission.
Clinical and economic aspects of MN have been under-recognized and underappreciated by clinicians and largely unexplored by researchers.
What this study adds
This research presents unique health claims data on a prevalent MN cohort of patients, with important evaluations of characteristics, clinical and economic outcomes, and high- and low-cost comparisons.
This study found that the cohort with the top 5% in expenditures appeared to have more severe and advanced disease, more treatment-related complications, and broader resource use.
Membranous nephropathy (MN) is one of the most common and challenging causes of nephrotic syndrome among adults.1,2 Peak incidence occurs in the fourth and fifth decades of life, and overall incidence in adults is estimated at 1.2 per 100,000 per year.3,4 Approximately 75% of MN cases are idiopathic membranous nephropathy (iMN), while secondary causes include autoimmune diseases, infection, drugs, and malignancy. The frequency and etiology of secondary causes vary in different geographic areas.5 Patients with MN have varying clinical courses and treatment responses.6 Although spontaneous remission occurs in approximately one third of MN patients and some may experience successful treatment-led proteinuria remission, 30%-40% of patients progress to end-stage renal disease (ESRD) within 5-15 years.3
Glomerulonephritis, including MN, accounts for the third most common cause of ESRD in the United States.7 Annual medical costs per patient with ESRD reached $65,312 per patient for Medicare and between $96,000 and $180,000 per patient for private insurance in 2012.8 With a growth in the total number of covered lives, this number has risen over time: total Medicare spending on ESRD patients during2015 exceeded $34 billion.9,10 Moreover, a study of 13,796 individuals with chronic kidney disease (CKD) and their matched controls reported that CKD and ESRD patients used considerably more health care resources on an ongoing basis compared with those without CKD or those at the pre-ESRD stage (2001 U.S. dollars).11,12 Patients with MN therefore represent a major economic challenge and are at a high risk for complications; thus, management strategies may alter and improve outcomes.4,13
Treatment guidelines and modalities for MN are composed of immunosuppressants, including corticosteroids, cyclophosphamide, chlorambucil, and calcineurin inhibitors (CNIs; e.g., cyclosporine and tacrolimus); repository corticotropin injections (RCIs; H.P. Acthar Gel), rituximab, and mycophenolate mofetil (MMF).14 These are often supplements for background therapies such as angiotensin-converting enzyme inhibitors (ACEIs), angiotensin receptor blockers (ARBs), statins, diuretics, and anticoagulants. The progression risk and side effect profile are key factors in the selection of immunosuppressant therapy, and therapeutic regimens involving immunosuppressant agents, dosing, and duration have also been known to vary by region.15
MN and other glomerulonephropathies have been under-recognized and underappreciated in terms of their clinical and economic relevance in U.S. clinical practice. Little information is currently available regarding patients affected by MN in terms of patient characteristics and clinical and economic outcomes. The burden of illness and effect of the condition within a specific U.S. health care system are currently unknown. However, commercial health insurance provides primary health coverage for advanced renal outcomes (such as dialysis and ESRD) during the 30-month coordination of benefits (COB) period proceeding Medicare eligibility.16,17 Therefore, commercial administrative claims provide strong insight into key aspects of the disease that incur health care resource utilization (HCRU).
Given the lack of real-world data on the burden of MN, we sought to identify prevalent cohorts of patients in U.S. commercial health insurance claims data and describe their real-world outcomes and costs over 1 year. A tailored literature review, a renal health plan coverage primer, and related coding conventions were leveraged to identify patients with primary MN and their relevant health outcomes using claims data.6,18,19 To facilitate more granular evaluation of the cohorts, we categorized our prevalent primary MN cohort into subcohorts (high-cost cohort [HCC] and non-high-cost cohort [NHCC]) in order to characterize and compare patients.
Methods
Data Source
This retrospective observational analysis used administrative health care claims data from the IBM MarketScan database.MarketScan data contain deidentified patient enrollment information and medical and pharmacy claims data for U.S. patients enrolled in employer-sponsored commercial and Medicare Advantage supplemental health plans. As the analysis was conducted using deidentified data, institutional review board approval was not required.20
Study Population
To assess cost analyses during the 1-year observation period, the study population was selected from commercially insured fee-for-service (FFS) patients due to the comprehensiveness of claims and accuracy of cost information. During the 30-month COB period preceding Medicare eligibility, commercial insurance offers primary health coverage for adverse renal events such as permanent kidney failure, dialysis, and kidney transplantation.12,13 Since Medicare Advantage coverage within the MarketScan database is supplementary and primary Medicare claims were not available, eligibility was limited to the commercially insured population.
Patient Selection
Patients with ≥ 2 medical claims for an MN diagnosis (International Classification of Diseases, Ninth Revision, Clinical Modification [ICD-9-CM] codes 581.1, 582.1, and 583.1) were identified during the period from January 1, 2012, to December 31, 2015. The first MN diagnosis date was designated as the index date. Patients were required to be ≥ 18 years on the index date and continuously enrolled in a health plan with medical and prescription benefits for the 1-year post-index (follow-up) period. To ensure patients had primary MN (i.e., iMN), wherever possible, patients with diagnosis claims indicating secondary causes of MN were excluded (see Figure 1 for the list of secondary causes).21,22
FIGURE 1.
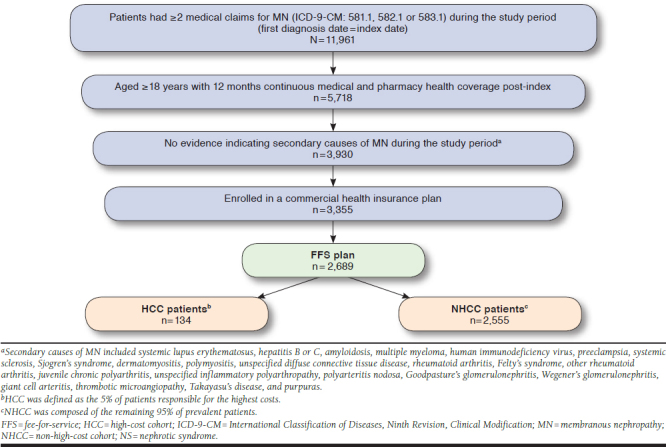
Patient Selection Criteria
Patient Characteristics and Outcome Measures
Patient demographics included age, sex, U.S. geographic region, and Charlson Comorbidity Index (CCI) score.13 In consideration of the cohort under study, end-stage disease was also included and defined as any of the following: the occurrence of an ESRD diagnosis, CKD stage 4 or stage 5, renal transplant procedure, dialysis, or indications for an erythropoietin drug.23-25 Clinical outcomes included bleeding-related complications, infections, and MN-related renal outcomes.21,22,26 Bleeding included any major gastrointestinal, major intracranial, or any other hemorrhage. Other infections included acute pyelonephritis, cholangitis, tuberculosis, cytomegalovirus, varicella zoster, chronic pyelonephritis without renal medullary necrosis, acute pyelonephritis without renal medullary necrosis, unspecified pyelonephritis, and soft tissue infections. Renal procedures of interest included dialysis, renal transplant, and kidney biopsy.27
Medication use was defined as any use of the following medications. Relevant therapies of interest administered as procedures (such as intravenous immunoglobulin [IVIG] and plasmapheresis) and dispensed through the pharmacy included background therapy (any prescription claim for ACEIs, ARBs, statins, anticoagulants, diuretics)23 and immunosuppressants often used to treat MN, including corticosteroids (prednisone, prednisolone, methylprednisolone, and dexamethasone); CNIs (cyclosporine and tacrolimus); cyclophosphamide; MMF; RCIs; rituximab; chlorambucil; and proteasome inhibitors (bortezomib and fish oil).
Medication use was not considered to be mutually exclusive (e.g., patients could have taken multiple medications simultaneously), except in the case of established regimens such as the Ponticelli regimen (i.e., cyclical corticosteroids and chlorambucil), modified Ponticelli regimen (i.e., cyclical corticosteroids and cyclophosphamide), and combination therapies (e.g., corticosteroids and CNIs)28,29; regimens were determinedby identifying any overlap in the dispense date of any of the prescription medications previously specified.
All-cause HCRU was assessed, including inpatient use, length of stay (LOS), outpatient use (including services rendered in an office), emergency department (ED) visits, and all prescriptions dispensed through the pharmacy.
Other outpatient service utilization was separated from outpatient office visits, given that the former represented, among others, outpatient hospital and ESRD facility use. All-cause health care costs were based on FFS plan-paid and patient-paid amounts.
Analyses
Patient demographics were determined as of the index date, and clinical and economic outcomes were evaluated for the following 1-year period. Comorbidities and outcomes measures were defined using diagnosis, procedure, and drug identifier codes from claims.
Descriptive analyses of demographics and statistical analyses of the 1-year clinical and economic outcomes (including HCRU and costs) were conducted. Counts and percentages were provided for dichotomous variables. Means, medians, and standard deviations (SDs) were provided for continuous variables.
All-cause costs and cost distributions were examined for all patients. The 95th percentile of plan-paid costs were used to form 2 patient subcohorts: HCC (i.e., the top 5% of patients who contributed the highest costs; considered to be the high-cost cohort [Appendix A, available in online article]), and the NHCC (i.e., the remaining 95% of patients; considered to be the non-high-cost cohort). These cohorts were then compared. Results are presented for all patients, along with HCC versus NHCC, in order to highlight specific areas of difference. Chi-square and t-tests were used to compare categorical and continuous variables, respectively, and to generate P values, where values < 0.05 were considered statistically significant. Wilcoxon rank-sum tests were used to compared all-cause costs and utilization because of the tendency of cost data in claims databases to skew.
Costs were then adjusted to 2017 U.S. dollars using the medical care component of the Consumer Price Index.30 Allanalyses were performed by STATinMED Research using SAS, version 9.3 (SAS Institute, Cary, NC).
Results
Patient Characteristics
A total of 2,689 patients with MN enrolled in FFS health plans were identified (Figure 1). The mean age was 46.4 years; 59.5% were male and mostly resided in the South U.S. region (39.0%). The male-to-female ratio within the HCC and NHCC was similar (3:2), as was the geographic distribution; however, the mean age of patients in the HCC was approximately 2 years younger than that of the NHCC. HCC patients had higher CCI scores and a higher proportion of evidence of ESRD compared with NHCC patients (Table 1).
TABLE 1.
Demographics and Baseline Characteristics of Patients with Primary MN
| MN Patients | P Value a | ||||||
|---|---|---|---|---|---|---|---|
| All (N = 2,689) | HCC (n = 134) | NHCC (n = 2,555) | |||||
| n | % | n | % | n | % | ||
| Age | |||||||
| Mean, SD | 46.4 | 12.6 | 44.5 | 13.5 | 46.5 | 12.6 | 0.069 |
| Median | 48 | 46.5 | 48 | ||||
| Age group | |||||||
| 18-34 | 520 | 19.3 | 33 | 24.6 | 487 | 19.1 | 0.112 |
| 35-44 | 589 | 21.9 | 31 | 23.1 | 558 | 21.8 | 0.724 |
| 45-54 | 698 | 26.0 | 29 | 21.6 | 669 | 26.2 | 0.242 |
| ≥ 55 | 882 | 32.8 | 41 | 30.6 | 841 | 32.9 | 0.577 |
| Sex | |||||||
| Male | 1,599 | 59.5 | 81 | 60.4 | 1,518 | 59.4 | 0.812 |
| Female | 1,090 | 40.5 | 53 | 39.6 | 1,037 | 40.6 | 0.812 |
| Geographic location | |||||||
| Northeast | 530 | 19.7 | 27 | 20.1 | 503 | 19.7 | 0.896 |
| North Central | 676 | 25.1 | 30 | 22.4 | 646 | 25.3 | 0.451 |
| South | 1,045 | 38.9 | 52 | 38.8 | 993 | 38.9 | 0.989 |
| West | 401 | 14.9 | 23 | 17.2 | 378 | 14.8 | 0.453 |
| Unknown | 37 | 1.4 | 2 | 1.5 | 35 | 1.4 | 0.905 |
| CCI score | |||||||
| Mean, SD | 2.96 | 1.69 | 3.95 | 2.44 | 2.91 | 1.63 | < 0.001 |
| Median | 2.0 | 3.0 | 2.0 | ||||
| Patients with end-stage diseaseb | 428 | 15.9 | 88 | 65.7 | 340 | 13.3 | < 0.001 |
Note: Percentages have been rounded to 1 decimal place only and subsequently may not equal exactly 100% in aggregate as represented in the table.
aP values were calculated using t-tests (for continuous variables) and chi-square tests (for categorical variables) to reflect differences between HCC and NHCC patients.
bEnd-stage disease included end-stage renal disease, chronic kidney disease stage 4 or 5, renal transplants, presence of an erythropoietin drug, or dialysis.
CCI = Charlson Comorbidity Index; HCC = high-cost cohort; MN = membranous nephropathy; NHCC = non-high-cost cohort; SD = standard deviation.
One-Year Clinical Outcomes
Use of background therapy is described in Table 2. Approximately 73.4% of all patients were prescribed ACEIs or ARBs, with a significantly smaller proportion of use in the HCC (64.9% vs. 73.9%) compared with the NHCC. Approximately 35.3% of all patients were taking diuretics and 28.5% were prescribed statins, although diuretic use was significantly more prevalent in the HCC (52.2% vs. 34.4%) compared with theNHCC. Of the 3.3% of patients prescribed anticoagulants, use was 8.2% among HCC patients vs. 3.0% among NHCC patients.
TABLE 2.
One-Year Treatment Use in Patients with MN
| Patients with MN | P Value a | ||||||
|---|---|---|---|---|---|---|---|
| All (N = 2,689) | HCC (n = 134) | NHCC (n = 2,555) | |||||
| n | % | n | % | n | % | ||
| Background therapy | |||||||
| ACEIs | 1,270 | 47.2 | 52 | 38.8 | 1,218 | 47.7 | 0.045 |
| ARBs | 972 | 36.1 | 53 | 39.6 | 919 | 36.0 | 0.400 |
| ACEIs/ARBs | 1,975 | 73.4 | 87 | 64.9 | 1,888 | 73.9 | 0.022 |
| Statins | 767 | 28.5 | 45 | 33.6 | 722 | 28.3 | 0.183 |
| Diuretics | 949 | 35.3 | 70 | 52.2 | 879 | 34.4 | < 0.001 |
| Anticoagulants | 88 | 3.3 | 11 | 8.2 | 77 | 3.0 | 0.001 |
| Immunosuppressant therapyb | |||||||
| Any immunosuppressant | 1,498 | 55.7 | 110 | 82.0 | 1,388 | 54.0 | < 0.001 |
| Any corticosteroid | 1,217 | 45.3 | 80 | 59.7 | 1,137 | 44.5 | < 0.001 |
| Prednisone | 905 | 33.7 | 64 | 47.8 | 841 | 32.9 | < 0.001 |
| Prednisolone | 37 | 1.4 | 1 | 0.7 | 36 | 1.4 | 0.521 |
| Methylprednisolone | 355 | 13.2 | 15 | 11.2 | 340 | 13.3 | 0.481 |
| Dexamethasone | 235 | 8.7 | 14 | 10.4 | 221 | 8.6 | 0.473 |
| Any CNI | 574 | 21.3 | 48 | 35.8 | 526 | 20.6 | < 0.001 |
| Cyclosporine | 296 | 11.0 | 11 | 8.2 | 285 | 11.2 | 0.288 |
| Tacrolimus | 299 | 11.1 | 40 | 29.9 | 259 | 10.1 | < 0.001 |
| RCI | 62 | 2.3 | 39 | 29.1 | 23 | 0.9 | < 0.001 |
| Rituximab | 33 | 1.2 | 5 | 3.7 | 28 | 1.1 | 0.007 |
| IVIG | 14 | 0.5 | 3 | 2.2 | 11 | 0.4 | 0.005 |
| Plasmapheresis | 6 | 0.2 | 2 | 1.5 | 4 | 0.2 | < 0.001 |
| Chlorambucil | 4 | 0.1 | 0 | 0.0 | 4 | 0.2 | 0.647 |
| Ponticelli regimen | 4 | 0.1 | 0 | 0.0 | 4 | 0.2 | 0.647 |
| Modified Ponticelli regimen | 120 | 4.5 | 6 | 4.5 | 114 | 4.5 | 0.993 |
| Ponticelli regimen + modified Ponticelli regimenc | 124 | 4.6 | 6 | 4.5 | 118 | 4.6 | 0.940 |
| Any corticosteroid ± any CNI | 1,380 | 51.3 | 89 | 66.4 | 1,291 | 50.5 | < 0.001 |
| MMF | 332 | 12.3 | 32 | 23.9 | 300 | 11.7 | < 0.001 |
| Cyclophosphamide | 124 | 4.6 | 7 | 5.2 | 117 | 4.6 | 0.729 |
| Proteasome inhibitor | 88 | 3.3 | 5 | 3.7 | 83 | 3.2 | 0.760 |
Note: Percentages have been rounded to 1 decimal place only and subsequently may not equal exactly 100% in aggregate as represented in the table.
aP values were calculated using chi-square tests and reflect differences between HCC and NHCC patients.
bTreatments shown above are not mutually exclusive. For example, patients prescribed prednisone may also have been prescribed other immunosuppressants.
cAny corticosteroid + chlorambucil/cyclophosphamide was used to define the Ponticelli regimen and modified Ponticelli regimen.
ACEI = angiotensin-converting enzyme inhibitor; ARB = angiotensin receptor blocker; CNI = calcineurin inhibitor; HCC = high-cost cohort; IVIG = intravenous immunoglobulin; MN = membranous nephropathy; MMF = mycophenolate mofetil; NHCC = non-high-cost cohort; RCI = repository corticotropin injection; SD = standard deviation.
More than half of patients (55.7%) received immuno-suppressant therapy, with a much higher proportion of use in the HCC (82.0% vs. 54.0%) compared with the NHCC. The proportion of all patients receiving medications suggestive of the Ponticelli or the modified Ponticelli regimens was 4.6%; 4.6% and 3.3% were for cyclophosphamide and proteasome inhibitors, respectively. No significant differences were observed among HCC and NHCC patients for these medications. Of the 45.3% of patients who received corticosteroids (most commonly prednisone), a significantly higher proportion of patients were included in the HCC (47.8% vs. 32.9% for the NHCC). Of the 21.3% receiving CNIs, HCC patients had approximately 15% greater use than NHCC patients (35.8% vs. 20.6%). MMF was used by 12.3% of patients, with a significantly increased use in the HCC vs the NHCC (23.9% vs. 11.7%). Similarly, a significantly greater proportion of HCC patients used RCI, rituximab, IVIG, and plasmapheresis, although the total sum of use was < 5.0%.
Complications, infections, adverse outcomes, and procedures of interest are listed in Table 3. Among bleeding-related complications, bleeding was observed in 30.8% of patients and occurred in almost twice as many HCC vs NHCC patients. Deep vein thrombosis and pulmonary embolism occurred in approximately 2% of patients and in over 3 times as many in HCC versus NHCC patients.
TABLE 3.
One-Year Complications, Infections, and Adverse Health Outcomes and Procedures Among Patients with MN
| Patients with MN | P Value a | ||||||
|---|---|---|---|---|---|---|---|
| All (N = 2,689) | HCC (n = 134) | NHCC (n = 2,555) | |||||
| n | % | n | % | n | % | ||
| Bleeding-related complications | |||||||
| Any bleedingb | 827 | 30.8 | 75 | 56.0 | 752 | 29.4 | < 0.001 |
| Deep vein thrombosis | 59 | 2.2 | 8 | 6.0 | 51 | 2.0 | 0.002 |
| Pulmonary embolism | 57 | 2.1 | 9 | 6.7 | 48 | 1.9 | < 0.001 |
| Complications of a transplanted kidney | 166 | 6.2 | 38 | 28.4 | 128 | 5.0 | < 0.001 |
| Hematuria | 258 | 9.6 | 18 | 13.4 | 240 | 9.4 | 0.122 |
| Infections | |||||||
| Septicemia | 64 | 2.4 | 22 | 16.4 | 42 | 1.6 | < 0.001 |
| Pneumonia | 136 | 5.1 | 23 | 17.2 | 113 | 4.4 | < 0.001 |
| Kidney infection | 2 | 0.1 | 0 | 0.0 | 2 | 0.1 | 0.746 |
| Urinary tract infection | 493 | 18.3 | 38 | 28.4 | 455 | 17.8 | 0.002 |
| Infection and inflammatory reaction due to vascular device, implant, and graft (due to peritoneal dialysis catheter) | 13 | 0.5 | 7 | 5.2 | 6 | 0.2 | < 0.001 |
| Other infectionsc | 90 | 3.3 | 18 | 13.4 | 72 | 2.8 | < 0.001 |
| MN-related outcomes | |||||||
| Acute kidney injury | 432 | 16.1 | 63 | 47.0 | 369 | 14.4 | < 0.001 |
| Chronic kidney disease (any) | 1,860 | 69.2 | 119 | 88.8 | 1,741 | 68.1 | < 0.001 |
| Stage 4 | 418 | 15.5 | 35 | 26.1 | 383 | 15.0 | < 0.001 |
| Stage 5 | 258 | 9.6 | 43 | 32.1 | 215 | 8.4 | < 0.001 |
| Procedures of interest | |||||||
| Dialysis | 268 | 10.0 | 75 | 56.0 | 193 | 7.6 | < 0.001 |
| Renal transplant | 93 | 3.5 | 30 | 22.4 | 63 | 2.5 | < 0.001 |
| Kidney biopsy | 435 | 16.2 | 48 | 35.8 | 387 | 15.1 | < 0.001 |
Note: Percentages have been rounded to 1 decimal place only and subsequently may not equal exactly 100% in aggregate as represented in the table.
aP values were calculated using chi-square tests and reflect differences between HCC and NHCC patients.
bAny bleeding includes any major gastrointestinal, major intracranial hemorrhage, or any other hemorrhage.
cOther infections include acute pyelonephritis, acute pyelonephritis without renal medullary necrosis, chronic pyelonephritis without renal medullary necrosis, unspecified pyelonephritis, cholangitis, tuberculosis, cytomegalovirus, varicella zoster, and soft tissue infections.
dHCC outpatient other: outpatient hospital = $88,729 (48.6%); ESRD facilities = $67,302 (36.8%); other facilities = $26,713 (14.6%).
HCC = high-cost cohort; MN = membranous nephropathy; NHCC = non-high-cost cohort.
Urinary tract infections occurred in 18.3% of all patients and were approximately 10% higher in HCC vs NHCC patients. Pneumonia, septicemia, and other infections were also more prevalent in HCC patients by 10%-15% versus NHCC patients.
Acute kidney injury occurred in 16.1% of all patients. The proportion of patients with evidence of ESRD in the HCC was 4-5 times higher than for those in the NHCC. Approximately 10% of all patients were administered dialysis, and dialysis in the HCC was 8 times more prevalent than in the NHCC; renal transplant was prevalent in 3.5% of all MN patients with 10 times greater prevalence in the HCC than NHCC.
All noted differences were significant at P < 0.05.
One-Year Economic Outcomes
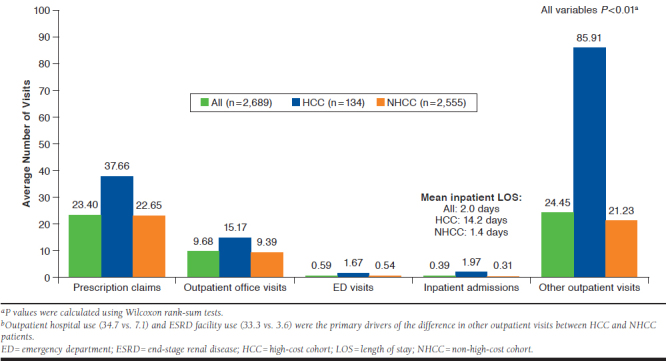
On average, all MN patients had 9.7 outpatient office visits, 0.4 inpatient admissions, and 24.5 other outpatient visits. HCC patients used significantly more HCRU than NHCC patients:1.7 more inpatient admissions and a mean 12.8 days longer inpatient LOS, 15 more prescription claims, 1.1 more ED admissions, 5.8 outpatient office visits, and 64.7 more other outpatient visits (Appendix A). When comparing the cohorts in the other outpatient setting, outpatient hospital use (27.6 more visits) and ESRD facility use (29.7 more visits) were the primary drivers of the substantial HCRU differences. All differences noted above were significant at P < 0.01.
Total and mean (SD) costs per patient for all patients with MN were $123.2 million and $45,814 ($101,353), respectively. HCC patients incurred 43.7% of total costs, or $53.8 million (see Appendix A), and a greater mean per-patient cost of $401,608 for HCC vs non-HCC patients, with a mean per-patient cost of $27,154.
Among both HCC and NHCC patients, the primary driver of total costs occurred in the outpatient setting (HCC = 46.6% and NHCC = 52.8% among their total costs, respectively).Within outpatient costs, other outpatient costs from outpatient hospital and ESRD facilities comprised 47.4% and 36% of the total outpatient burden for HCC and 49.9% and 18.3% of total outpatient burden for NHCC, respectively. ED use was a relatively low portion of the outpatient burden in both HCC and NHCC (0.9% and 3.5%). Proportionally, after outpatient costs, the next highest cost drivers were related to inpatient care and services, and then prescription-related costs. All differences were significant at P < 0.01 (Figure 2).
FIGURE 2.
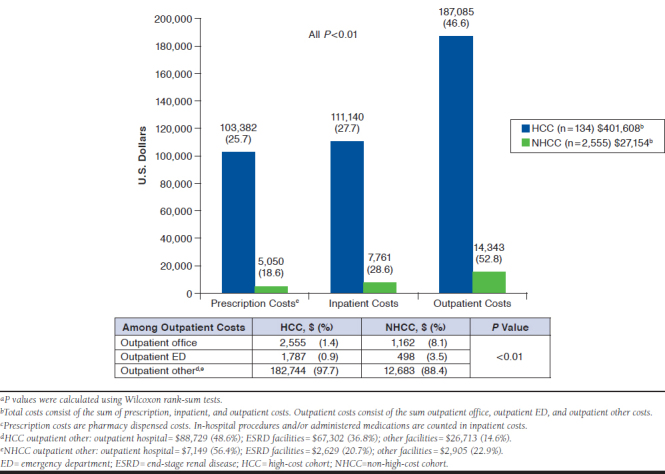
One-Year Mean Per-Patient All-Cause Health Care Costs for Patients with MN (HCC vs. NHCC)a
Discussion
To the best of our knowledge, this is the first real-world analysis of commercially insured patients with MN in the United States using administrative health insurance claims data. Our study describes 1-year outcomes and costs in a prevalent MN population and compares results among high-cost and non-high-cost patient subgroups. We observed considerabledifferences in clinical and health utilization outcomes between the subgroups. Health plans that may not have considered MN as a condition of interest or that may not have had a claims-based perspective on the clinical and economic outcomes associated may now investigate further based on these data.
The clinical course of MN results in high health care resource utilization and economic burden. A higher proportion of patients in the top fifth percentile of costs appeared to be at more advanced stages of disease and with higher severity, with greater rates of CKD stage 4 or 5, dialysis, or evidence of ESRD. They also had a greater proportion of several complications and infections including bleeding and urinary tract infection, as well as more immunosuppressant use. Correspondingly, increased HCRU in high-cost vs non-high-cost patients was observed across all settings, with a much higher magnitude of visits in the outpatient setting (4.7 more outpatient office visits) and a smaller, yet meaningful increase in the inpatient setting(1.7 more inpatient admissions) corresponding with markedly longer mean LOS (12.8 more days in hospital).
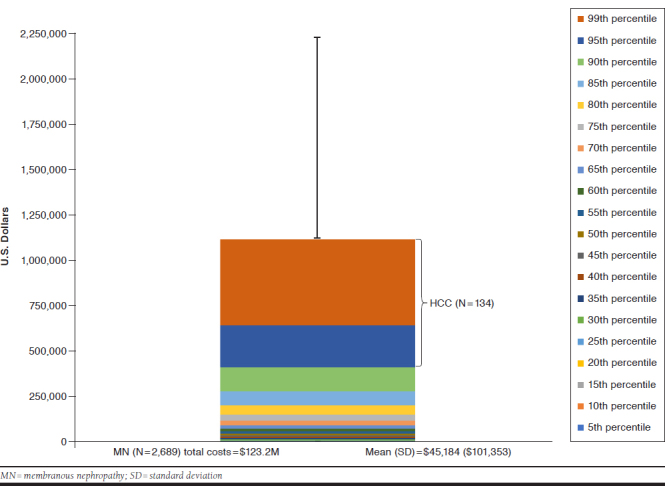
The prevalent MN cohort incurred a total cost of $123.2 million and a mean per-patient cost of $45,814 during 1 year. The 5% of patients deemed high-cost incurred over 43.7% of the total costs over 1 year, for a mean per-patient cost of $401,608. However, 12.7% of patients (n = 342) had 1-year costs exceeding $100,000 (Appendix B, available in online article). This additional granularity may be relevant in identifying and applying plan-specific thresholds for monitoring and intervention.
Among patients in the overall MN cohort, approximately 47% of expenditures were related to outpatient utilization, predominantly via outpatient hospital and ESRD facility use. The remaining 31% was attributable to inpatient utilization and 22% to prescription use. Notably, approximately 25.7% of HCC costs were prescription-driven. For the NHCC, cost drivers were proportionally similar to those for the HCC. Understanding and predicting the patient journey and key factors leading to ESRD, where high costs are incurred, is key. For example, appropriate management with the goal of stabilizing or improving renal function (e.g., supplementing background therapy) may be critical to slowing or preventing progression to end-stage disease. Hence, reallocation of resources earlier in the disease pathway may be considered a prevention measure. Specifically, further consideration into whether costs should be distributed the same way among HCC and NHCC patients may be warranted, as there may be opportunities for more appropriate resource allocation through earlier intervention or different medical management strategies.
The extent to which delays in diagnosis, timely access to treatment, and appropriate use of treatment may have helped offset entry into the high-cost group remains unclear. For example, CKD screening programs for early detection and management have been shown to be effective.31 As a chronic disease, costs of CKD may accumulate; hence, early intervention (diagnosis, different treatment, or monitoring) may be implemented to slow disease progression, prevent loss of renal function, and simultaneously stem overall cost of care.12,13
We observed more ACEI/ARB use among NHCC patients, although this was contrary to the expected finding of higher use among HCC patients. In keeping with our findings, a recent study by Molnar et al. (2014) highlighted that patients with a low estimated glomerular filtration rate tended to underutilize ACEIs/ARBs.34 It is unclear whether lower use was due to tolerability or other factors. The high prevalence of steroid use in our study and the published evidence of the ineffectiveness of steroid monotherapy for primary MN are also notable35,36; however, the complexity of MN makes it difficult to form clear conclusions when determining the most appropriate treatment.
Interestingly, compared with the NHCC, HCC patients were on average 2 years younger, with a 28% higher prevalence ofany immunosuppressant use. This may signal younger patients being more aggressively treated given a different disease course or severity versus a general preference for careful monitoring—particularly in older, more severe patients. This is consistent with published literature in other therapeutic areas wherein younger patients were treated with immunosuppressants.37,38
Limitations
There are some limitations to consider for this study. The MarketScan data population reflects a large convenience sample of administrative health insurance claims data, collected for the purposes of reimbursement and payment. Clinical detail is largely not captured. Claims offer a reliable closed system of data for analysis but carry the potential for coding errors and missing data. For instance, under-recording of certain clinical outcomes (e.g., hematuria, CKD status) would lead to underestimation of their prevalence and cost. In addition, this patient cohort may reflect disease severity specific to the MarketScan population, and results may not be generalizable to other commercial health plans in the United States. However, information provided here will help to conduct plan-specific evaluations.
There were also coding challenges in identifying MN. Although the Centers for Medicare & Medicaid Services provides ICD-9-CM coding guidelines for MN, these codes have been noted to not be adopted in practice or to provide inadequate distinction of glomerulonephritis.39,40 The literature suggests this coding lacks sufficient sensitivity and correlates poorly with gold-standard biopsy information; further, glomerulonephritis specificity has been removed from the most recently updated form 2728.41 MN coding evaluated within Kaiser Permanente Southern California revealed that ICD-9-CM codes containing the description “lesion of membranous glomerulonephritis” had sensitivity and specificity values of 83% and 94%, respectively, in identifying biopsy-proven MN.42 While use of MN codes in claims may vary further, we used this exercise to inform and rationalize the research approach used here.
We did not examine concomitant diagnoses of other forms of glomerulonephritis, given no clear way to reconcile them. We did attempt to address secondary causes of MN through our exclusion criteria; however, some patients with secondary causes (e.g., caused by nonsteroidal anti-inflammatory drugs) may have been captured. For some comparisons, sample sizes were low, complicating the detection of differences. However, MN is a low-prevalence disease.
Our analysis used ICD-9-CM coding to identify MN patients until December 2015. As of October 1, 2015, health providers converted to International Classification of Diseases, Tenth Revision, Clinical Modification codes, so there may have been at least 2 months of patient data potentially missed (although the loss is likely nominal and would minimally affect our findings). Therefore, further investigation will be warranted to improve the efficiency of case identification and characterization.
Conclusions
Our study provides an important step in identifying and evaluating a cohort of patients with MN and their associated health outcomes and costs, beyond the physiological response variables typically reported in studies to date. Active support, adoption, and reinforcement of robust coding practices by payers and health care providers (e.g., nephrologists) will enable a more granular understanding of health care delivery and areas of improvement for patients with MN. Given the importance of histological variants on the course of disease, determining predictors of high-cost patients will be critical in developing actionable insights. Further study of patients with MN and the key inflection points en route to end-stage disease is also critically important in managing the goals of stabilizing renal function and slowing down the progression to end-stage disease. With such insights, appropriate reallocations of resources earlier in the disease pathway may be considered preventive measures.
ACKNOWLEDGMENTS
Editorial support was provided by Michael Moriarty of STATinMED Research.
APPENDIX A. One-Year All-Cause Health Care Utilization for MN Patients
APPENDIX B. one-Year All-Cause Cost Distribution of MN Patients
REFERENCES
- 1.Jin B, Zeng C, Ge Y, et al. The spectrum of biopsy-proven kidney diseases in elderly Chinese patients. Nephrol Dial Transplant.2014;29(12):2251-59. [DOI] [PubMed] [Google Scholar]
- 2.Prakash J, Singh A, Saxena RK. Glomerular diseases in the elderly in India. Int Urol Nephrol. 2003;35(2):283-88. [DOI] [PubMed] [Google Scholar]
- 3.Lai WL, Yeh TH, Chen PM, et al. Membranous nephropathy: a review on the pathogenesis, diagnosis, and treatment. J Formos Med Assoc. 2015;114(2):102-11. [DOI] [PubMed] [Google Scholar]
- 4.Ayalon R, Beck LH. Membranous nephropathy: not just a disease for adults. Pediatr Nephrol. 2013;30(1):31-39. [DOI] [PMC free article] [PubMed] [Google Scholar]
- 5.Chen SY, Chen CH, Huang YC, et al. Genetic susceptibility to idiopathic membranous nephropathy in high-prevalence area, Taiwan. Biomedicine (Taipei). 2014;4(2):9. [DOI] [PMC free article] [PubMed] [Google Scholar]
- 6.Sim JJ, Bhandari SK, Batech M, et al. End-stage renal disease and mortality outcomes across different glomerulonephropathies in a large diverse US population. Mayo Clin Proc. 2018;93(2):167-78. [DOI] [PubMed] [Google Scholar]
- 7.Saran R, Robinson B, Abbott KC, et al. U.S. Renal Data System 2017 annual data report: epidemiology of kidney disease in the United States. Am J Kidney Dis. 2018;71(3S1):A7. [DOI] [PMC free article] [PubMed] [Google Scholar]
- 8.Wang V, Vilme H, Maciejewski ML, Boulware LE. The economic burden of chronic kidney disease and end-stage renal disease. Semin Nephrol. 2016;36(4)319-30. [DOI] [PubMed] [Google Scholar]
- 9.United States Renal Data System. Costs of ESRD . In: Annual Data Report 2012. Available at: https://www.usrds.org/2012/view/v2_11.aspx. Accessed June 9, 2019.
- 10.Center for Medicare and Medicaid Innovation . Comprehensive ESRD Care Model. Available at: https://innovation.cms.gov/initiatives/comprehensive-esrd-care/. Accessed June 9, 2019.
- 11.Smith DH, Gullion CM, Nichols G, Keith DS, Brown JB. Cost of medical care for chronic kidney disease and comorbidity among enrollees in a large HMO population. J Am Soc Nephrol. 2004;15(5):1300-06. [DOI] [PubMed] [Google Scholar]
- 12.Hunsicker LG. The consequences and costs of chronic kidney disease before ESRD. J Am Soc Nephrol. 2004;15(5):1363-64. [DOI] [PubMed] [Google Scholar]
- 13.Sim JJ, Batech M, Hever A, et al. Distribution of biopsy-proven presumed primary glomerulonephropathies in 2000-2011 among a racially and ethnically diverse U.S. population. Am J Kidney Dis. 2016;68(4):533-44. [DOI] [PubMed] [Google Scholar]
- 14.Hofstra JM, Fervenza FC, Wetzels JF. Treatment of idiopathic membranous nephropathy. Nat Rev Nephrol. 2013;9(8):443. [DOI] [PubMed] [Google Scholar]
- 15.Alfaadhel T, Cattran D. Management of membranous nephropathy in western countries. Kidney Dis (Basel). 2015;1(2):126-37. [DOI] [PMC free article] [PubMed] [Google Scholar]
- 16.Medicare.gov . How Medicare works with other insurance. 2017. Available at: https://www.medicare.gov/supplement-other-insurance/how-medicare-works-with-other-insurance/how-medicare-works-with-other-insurance.html. Accessed June 9, 2019.
- 17.Centers for Medicare & Medicaid Services . Medicare secondary payer (MSP): end stage renal disease course. 2014. Available at: https://www.cms.gov/Medicare/Coordination-of-Benefits-and-Recovery/Coordination-of-Benefits-and-Recovery-Overview/Medicare-Secondary-Payer/Downloads/MSP-End-Stage-Renal-Disease-ESRD.pdf. Accessed June 9, 2019.
- 18.Wetmore JB, Guo H, Liu J, Collins AJ, Gilbertson DT. The incidence, prevalence, and outcomes of glomerulonephritis derived from a large retrospective analysis. Kidney Int. 2016;90(4):853-60. [DOI] [PubMed] [Google Scholar]
- 19.Taneja C, Berger A, Inglese GW, et al. Can dialysis patients be accurately identified using health care claims data? Perit Dial Int. 2014;34(6):643-51. [DOI] [PMC free article] [PubMed] [Google Scholar]
- 20.Government Publishing Office . Health Insurance Portability and Accountability Act of 1996. Public Law 104-191. 1996. Available at: https://www.gpo.gov/fdsys/pkg/PLAW-104publ191/content-detail.html. Accessed June 9, 2019.
- 21.Kodner C. Nephrotic syndrome in adults: diagnosis and management. Am Fam Physician. 2009;80(10):1129-34. [PubMed] [Google Scholar]
- 22.National Kidney Foundation . ESRD Medicare guidelines. 2003. Available at: http://www.kidney.org/sites/default/files/docs/esrd_medicare_guidelines.pdf. Accessed June 9, 2019.
- 23.NIH National Institute of Diabetes and Digestive and Kidney Diseases . Kidney disease statistics for the United States. 2016. Available at: https://www.niddk.nih.gov/health-information/health-statistics/kidney-disease. Accessed June 9, 2019.
- 24.Dalrymple LS, Katz R, Kestenbaum B, et al. Chronic kidney disease and the risk of end-stage renal disease versus death. J Gen Intern Med. 2011;26(4):379-85. [DOI] [PMC free article] [PubMed] [Google Scholar]
- 25.DaVita Kidney Care . Stage 4 of chronic kidney disease. Available at: https://www.davita.com/kidney-disease/overview/stages-of-kidney-disease/stage-4-of-chronic-kidney-disease/e/4751. Accessed June 9, 2019.
- 26.Kellum JA, Lameire N, Aspelin P, et al. Kidney disease: improving global outcomes (KDIGO) acute kidney injury work group. KDIGO clinical practice guideline for acute kidney injury. Kidney Int Suppl. 2012;2(1):1-38. [Google Scholar]
- 27.Cravedi P, Ruggenenti P, Remuzzi G. Proteinuria should be used as a surrogate in CKD. Nat Rev Nephrol. 2012;8(5):301-06. [DOI] [PubMed] [Google Scholar]
- 28.Das U, Dakshinamurty KV, Prasad N. Ponticelli regimen in idiopathic nephrotic syndrome. Indian J Nephrol. 2009;19(2):48-52. [DOI] [PMC free article] [PubMed] [Google Scholar]
- 29.NHS, University Hospitals Birmingham, Queen Elizabeth Hospital . Modified Ponticelli treatment record card. 2017. Available at: https://www. uhb.nhs.uk/Downloads/pdf/PiModifiedPonticelli.pdf. Accessed June 9, 2019.
- 30.U.S. Department of Labor, Bureau of Labor Statistics . Consumer Price Index. Available at: https://www.bls.gov/cpi/. Accessed June 9, 2019.
- 31.Sim JJ, Rutkowski MP, Selevan DC, et al. Kaiser Permanente Creatinine Safety Program: a mechanism to ensure widespread detection and care for chronic kidney disease. Am J Med. 2015;128(11):1204-11.e1. [DOI] [PubMed] [Google Scholar]
- 32.Jafar TH, Stark PC, Schmid CH, et al. Progression of chronic kidney disease: the role of blood pressure control, proteinuria, and angiotensin-converting enzyme inhibition: a patient-level meta-analysis. Ann Intern Med. 2003;139(4):244-52. [DOI] [PubMed] [Google Scholar]
- 33.Peter WL, Khan SS, Ebben JP. Chronic kidney disease: the distribution of health care dollars. Kidney Int. 2004;66(1):313-21. [DOI] [PubMed] [Google Scholar]
- 34.Molnar MZ, Kalantar-Zadeh K, Lott EH, et al. Angiotensin-convertingenzyme inhibitor, angiotensin receptor blocker use, and mortality in patients with chronic kidney disease. J Am Coll Cardiol. 2014;63(7):650-58. [DOI] [PMC free article] [PubMed] [Google Scholar]
- 35.Collaborative Study Group . A controlled study of short-term prednisone treatment in adults with membranous nephropathy—collaborative study of the adult idiopathic nephrotic syndrome. N Engl J Med. 1979;301(24):1301-06. [DOI] [PubMed] [Google Scholar]
- 36.Cattran DC, Delmore T, Roscoe J, et al. A randomized controlled trial of prednisone in patients with idiopathic membranous nephropathy. N Engl J Med. 1989;320(4):210-15. [DOI] [PubMed] [Google Scholar]
- 37.Barocas DA, Cowan JE, Smith JA Jr, Carroll PR; CaPSURE Investigators. What percentage of patients with newly diagnosed carcinoma of the prostate are candidates for surveillance? An analysis of the CaPSURE database. J Urol. 2008;180(4):1330-35. [DOI] [PubMed] [Google Scholar]
- 38.Kariburyo F, Wang Y, Cheng INE, et al. Observation versus treatment among men with favorable risk prostate cancer in a community-based integrated health care system: a retrospective cohort study. BMC Urol. 2018;18(1):55. [DOI] [PMC free article] [PubMed] [Google Scholar]
- 39.Tucker BM, Freedman BI. Need to reclassify etiologies of ESRD on the CMS 2728 medical evidence report. Clin J Am Soc Nephrol. 2017;CJN-08310817. [DOI] [PMC free article] [PubMed] [Google Scholar]
- 40.Centers for Medicare & Medicaid Services . End stage renal disease medical evidence report: Medicare entitlement and/or patient registration. Available at: https://www.cms.gov/Medicare/CMS-Forms/CMS-Forms/Downloads/CMS2728.pdf. Accessed June 9, 2019.
- 41.Longenecker JC, Coresh J, Klag MJ, et al. Validation of comorbid conditions on the end-stage renal disease medical evidence report: the CHOICE study. Choices for Healthy Outcomes in Caring for ESRD. J Am Soc Nephrol. 2000;11(3):520-29. [DOI] [PubMed] [Google Scholar]
- 42.Sun AZ, Shu Y-H, Harrison TN, O’Shaughnessy MM, Sim, JJ. Studying rare disease using an electronic health record (EHR) and machine learning-based approach: The Kaiser Permanente Southern California (KPSC) Membranous Nephropathy (MN) cohort. Presented at: American Society of Nephrology, Kidney Week 2018; October 27, 2018; San Diego CA. Available at: https://www.asn-online.org/education/kidneyweek/2018/program-abstract.aspx?controlId=3009243. Accessed July 1, 2019. [Google Scholar]