

Abstract
BACKGROUND:
The American Diabetes Association (ADA) recommends metformin to treat individuals diagnosed with type 2 diabetes and recommends that hemoglobin A1c (HbA1c) be maintained below or around 7%. If the HbA1c target is not achieved or maintained by metformin monotherapy at maximal tolerated dose over 3 to 6 months, treatment modification with addition of a second oral antihyperglycemic agent or by initiating insulin is recommended. Despite the importance of attaining and maintaining HbA1c goals, actual treatment behavior may not follow ADA guidelines to add a second oral agent or to initiate insulin as expected even considering that individual patient’s needs are taken into account when treatment decisions are made.
OBJECTIVE:
To evaluate treatment addition for metformin monotherapy users with suboptimal glycemic control and associated factors.
METHODS:
A retrospective health care claims study identified 7,109 subjects aged 18 to 89 years, treated for type 2 diabetes with an HbA1c > 7% following at least 60 days of continuous metformin monotherapy. Subjects were required to have 12 months continuous enrollment with the health plan before and after the index lab date. Pharmacological treatment additions after the HbA1c lab result and time to treatment addition were evaluated. A logistic regression model was used to evaluate the patient characteristics and comorbidities associated with the treatment addition.
RESULTS:
Thirty-eight percent of study subjects had evidence of addition of a second antidiabetic medication to primary metformin monotherapy, 57.5% remained on metformin monotherapy, and 4.5% discontinued metformin altogether. A logistic regression model found age inversely related to treatment addition: age 45-64 versus 18-44 (OR = 0.77, 95% CI = 0.59-0.99) and age 65-89 versus 18-44 (OR = 0.57, 95% CI = 0.43-0.74). HbA1c was positively related to treatment addition: > 8%-9% versus > 7%-8% (OR = 2.31, 95% CI = 2.00-2.67); > 9%-10% versus > 7%-8% (OR = 2.88, 95% CI = 2.32-3.58); and > 10% versus > 7%-8% (OR = 3.54, 95% CI = 2.92-4.28). Evidence of ophthalmic disorder was not related to treatment addition (P = 0.056), but evidence of hypertension (OR = 1.56, 95% CI = 1.28-1.89); hyperlipidemia (OR = 1.28, 95% CI = 1.05-1.55); other cardiovascular diseases (OR = 1.30, 95% CI = 1.16-1.45); obesity (OR = 1.21, 95% CI = 1.08-1.36); and renal disease (OR = 1.35, 95% CI = 1.21-1.51) were associated.
CONCLUSIONS:
The majority of the metformin monotherapy users with suboptimal glycemic control did not initiate add-on therapy as recommended by guidelines, and prolonged time on metformin monotherapy demonstrated clinical inertia in real-world clinical practice. Several factors were associated with this delay including older age, lower index HbA1c, and lack of evidence of certain comorbidities.
What is already known about this subject
Despite the importance of maintaining hemoglobin A1c (HbA1c) at or below goal level, many patients do not meet the goal of HbA1c < 7%.
Despite HbA1c levels above the 7% goal, treatment modification may be delayed up to a year or more.
Treatment inertia (status quo treatment) appears to be common in spite of HbA1c levels that are greater than 7%.
What this study adds
Previous studies of time to treatment modification and treatment inertia have included patients taking any type of antidiabetic medication prior to the observed HbA1c above the 7% goal level. Patients taking 3 or more oral antidiabetics or on insulin may not be candidates for treatment modification.
The observation of time to treatment addition was isolated to those on metformin monotherapy, and the results suggest that treatment addition is also not typical for patients on metformin monotherapy.
This study provides evidence for practitioners and researchers regarding the influence of HbA1c, age, and comorbidity on the decision to add a treatment even for patients treated with metformin monotherapy.
Diabetes is one of the most common diseases worldwide. An estimated 347 million people globally had diabetes in 2011,1 with projections that the number will increase to 552 million by 2030.2 In the United States, 29.1 million people, or 9.3% of the population, had diagnosed or undiagnosed diabetes in 2012.3 Among them, 90%-95% of the diagnosed cases in adults were for type 2 diabetes mellitus (T2DM).
As a chronic, progressive disease, national and international guidelines for diabetes management consistently emphasize the importance of glycemic control to prevent complications of T2DM such as microvascular (e.g., nephropathy, retinopathy, neuropathy) and macrovascular (e.g., coronary heart disease, cerebrovascular disease or stroke, congestive heart failure) diseases.4,5 Several medical organizations, including the American College of Cardiology (ACC), American Heart Association (AHA), and the American Diabetes Association (ADA), recommend lowering hemoglobin A1c (HbA1c), also known as glycated hemoglobin A1c, to below or around 7% for most patients in order to reduce or delay these complications.6-9 The HbA1c goal might be lower than 7% or higher than 7% based on patient characteristics and treatment considerations. Lowering HbA1c to 6.5% or lower might be appropriate for patients with long life expectancies, no prior cardiovascular disease, and low risk for hypoglycemia related to aggressive treatment.9 Conversely, lowering HbA1c to around 8% may be sufficient for patients with shorter life expectancies, with extensive comorbid conditions, or for those with a history of hypoglycemia.9 A goal of HbA1c < 7% is appropriate for most adult patients.9
When initiating pharmacological treatment for T2DM, the ADA recommends metformin therapy, along with lifestyle interventions at diagnosis, unless metformin is contraindicated.9 At the time of this study, if the HbA1c target was not achieved or maintained by noninsulin monotherapy at maximal tolerated dose over 3 to 6 months, treatment modification was recommended. Modification may be recommended sooner if HbA1c target is not achieved for patients initiating pharmacological treatment after 2014. Addition of a second oral antidiabetic metformin monotherapy is one option, which may include sulfonylureas, thiazolidinediones, dipeptidyl peptidase-4 (DPP-4) inhibitors, or sodium-glucose cotransporter 2 (SGLT2) inhibitors.9 Insulin or injectable glucagon-like peptide-1 (GLP-1) receptor agonists can also be considered as replacement monotherapy or in addition to metformin treatment. Ultimately, the treatment choice resides with the physician and patient, with time to treatment addition or other modification varying by practice.9
Despite its importance in T2DM management, attaining and maintaining HbA1c goals presents challenges and difficulty in clinical practice. In fact, in a study published in 2011 of U.S. adults with T2DM, 40% of the patients did not reach the HbA1c target of < 7%.10 The Real-Life Effectiveness and Care Patterns of Diabetes Management (RECAP-DM) study reported that among European T2DM patients on metformin-based dual therapy only 25.5% of them had adequate glycemic control.11
Several studies have investigated the time between an HbA1c level below target and medication therapy changes.12-14 For example, Yood et al. (2006) evaluated the time to oral anti-diabetic medication change in response to elevated HbA1c test results and found the median time to pharmacotherapy change was 372 days (95% CI = 358-393) following HbA1c test results of 7%-10%, and 160 days for patients with HbA1c > 10%.12 Furthermore, Fu et al. (2011) evaluated the time to antidiabetic medication change after uncontrolled HbA1c and found the majority of patients received additional treatment within 1 to 2 years after the uncontrolled HbA1c result was identified.13 Similarly, Khunti et al. (2013) observed a delay of several years before treatment modification was employed.14 None of these studies focused on patients taking metformin only as a pharmacological treatment, yet metformin as monotherapy is the recommended first-line treatment for most patients.
This study expounded upon previous research by evaluating time to treatment addition after a lab test indicating suboptimal glycemic control (HbA1c > 7%) for patients initially treated with metformin monotherapy in a U.S. health plan population. This study also evaluated HbA1c levels, age, sex, and several comorbid conditions as they related to treatment addition in patients with suboptimal glycemic control.
Methods
A retrospective cohort study was conducted using member enrollment, medical and pharmacy claims, and lab results from a large national health plan (Humana), which included Medicare Advantage and commercial fully insured populations. Humana is a national health plan with the majority of plan members residing in the southern and midwestern portions of the United States. The study protocol, waiver of informed consent, and waiver of authorization to use and disclose protected health information were approved by Schulman and Associates IRB. Member enrollment data for the health plan included information on member demographics and coverage start and end dates. Medical claims data included diagnosis codes related to health care services utilization. Pharmacy claims data included detailed information on each member’s prescription fills. Such information includes, but is not limited to, the specific medication filled (National Drug Codes [NDC] numbers and Generic Product Identifier [GPI] codes), prescription fill date, quantity dispensed, metric strength, and days of supply.
Health plan members aged 18 through 89 years with a lab result of HbA1c > 7% within January 1, 2009, through July 31, 2011 (identification period) were identified for inclusion in the study. Only HbA1c values within the range 4%-18% were considered valid. The first occurrence of HbA1c > 7% served as the study index date and study subjects were required to have 12 months (1 year) continuous enrollment with the health plan before the index and 12 months (1 year) continuous enrollment after the index date. Even though previous research identified median time to treatment change beyond 12 months, a 12-month observation period was chosen, a priori, in an effort to retain as much sample size as possible and because the study focused on patients on metformin monotherapy for whom treatment addition was presumed to be a more likely option after HbA1c > 7% than patients already on multiple medications, as had been observed in earlier research. To verify metformin monotherapy before the index HbA1c > 7% lab date, continuous metformin supply during the 60-day period before the index date was required. Up to a 45-day gap in therapy was allowed for defining continuous medication supply. The allowed gap was later shortened for sensitivity analysis. To further verify metformin monotherapy before the index HbA1c > 7% lab date, members were excluded if they had supply of any antidiabetic medication other than metformin during the 60-day period before the index date. All study subjects were also required to have a diagnosis for T2DM (International Classification of Diseases, Ninth Revision, Clinical Modification [ICD-9-CM] codes 250.x0, 250.x2) or at least 2 metformin pharmacy claims indicating treatment for T2DM. Potential study subjects with evidence of pregnancy (all 650-679, all V22-V24, V72.42) during the 12 months pre-index and post-index were excluded along with all potential subjects with a diagnosis for type 1 diabetes (ICD-9 CM 250.x1, 250.x3) anytime during the study period (January 1, 2008-July 31, 2012).
As the sampling method was designed to be highly inclusive, sensitivity analysis was deemed necessary. Three separate analyses were completed to evaluate the impact of stricter inclusion criteria on overall results. Three restrictions were placed on the sample for each respective sensitivity analysis: (1) 90 days of metformin use was required immediately before the index date; (2) reducing the acceptable gap in metformin treatment to 30 days for evaluation of continuous metformin before the index date and to identify metformin discontinuation post-index date; and (3) requirement of proportion of days covered (PDC) ≥ 0.8 for the 60 days of metformin immediately before the index date.
Study Variables
Outcome Variables.
This study evaluated relationships of certain patient characteristics with treatment addition within 1 year after evidence of suboptimal glycemic control (HbA1c > 7%), as well as the time to treatment addition within the 1-year period. Treatment addition was defined as the addition of an adjuvant antidiabetic medication to current metformin treatment or as the introduction of metformin combination medication. To verify treatment addition, ≥ 2 claims for the add-on medication were required before the discontinuation of the add-on medication and before the discontinuation of metformin therapy. In the case of metformin fixed-dose combination products, ≥ 2 claims for product were required before discontinuation. For the main analysis, treatment discontinuation was identified as > 45 days without supply of the treatment of interest. Once treatment discontinuation was identified, the discontinuation date was set as the most recent fill date plus the days of supply and surplus days. Surplus days were determined as the cumulative extra days of supply before treatment discontinuation. Extra days of supply were calculated at each fill as days of supply minus days between fill date and previous fill date. The discontinuation date identification was based on the methods described by Karter et al. (2009).15
The treatment addition date was defined as the first pharmacy claim for an add-on medication or fixed-dose combination product, respectively. Time to treatment addition was defined as the number of days from the index date to the date of treatment addition. Antidiabetic drug classes included in the study were: metformin, sulfonylureas, thiazolidinediones, glucagon-like peptide-1 receptor agonists, dipeptidyl peptidase-4 inhibitors, insulin, metformin fixed-dose combination products, other non-metformin fixed-dose combination products, and other antidiabetics including alpha-glucosidase inhibitors, amylin agonists, bile acid sequestrants, and meglitinides.
Independent Variables.
Comorbidities included hypertension (ICD-9-CM codes 401.xx-405.xx), hyperlipidemia (all 272.xx), obesity (278.00, 278.01), cardiovascular disease (410. xx-417.xx, 420.xx-448.xx, 451.xx-459.xx, 707.xx, 785.4), renal disease (580.xx-590.xx, 593.xx), and ophthalmic disease or disorder (362.xx, 364.41, 364.42, 365.xx-366.xx, 377.xx). ICD-9CM codes in any position were evaluated for comorbidity identification. Age was calculated as of the index date and ordered as 18-44 (referent), 45-64, and ≥ 65. Sex was measured as female, male, or unknown.
Race/ethnicity was organized as non-Hispanic white (referent), non-Hispanic black, Hispanic, and other. Race/ethnicity information was based on Centers for Medicare & Medicaid Services definitions and only available for the subjects with Medicare Advantage coverage.
HbA1c values were measured at the index date. In cases of multiple HbA1c lab results on the same date, only the greatest value was included for analysis. HbA1c values were organized as > 7% through 8% (referent), > 8% through 9%, > 9% through 10%, and > 10%.
Statistical Analyses
Time to treatment addition was plotted using the Kaplan-Meier method. In order to evaluate the relationship between subject characteristics and whether a treatment addition was received or not, a logistic regression model for add-on versus no add-on was evaluated. The model included age (categorized as 18-44, 45-64, and 65-89), sex, index HbA1c (categorized as > 7%-8%, > 8%-9%, > 9%-10%, and > 10%), and the comorbidities hypertension, hyperlipidemia, obesity, other cardiovascular, renal disease, and ophthalmic disorder. The model was applied to the main study sample and to each of the 3 more restrictive samples for sensitivity analysis. For model estimates, P values less than 0.05 were used to determine the statistical significance. Confidence intervals (CI) were evaluated for odds ratios (OR).
Results
The study sample comprised 7,109 subjects. Figure 1 illustrates the attrition steps for sample identification. Despite evidence of suboptimal glycemic control (HbA1c > 7%) at the index date, only 38% of study subjects had evidence of addition of a second antidiabetic medication to primary metformin monotherapy (35.7% within 1 year; Figure 2). Subjects with addition of a second antidiabetic medication were different than subjects without an addition in terms of age and ethnicity/race measures (Table 1). No subjects were identified as switching from metformin to another antidiabetic medication. All subjects with a second antidiabetic medication were classified as receiving a treatment addition based on the methods for identifying discontinuation of metformin and start of other medications during the observation period. The majority of subjects (57.5%) remained on metformin monotherapy during the period following the HbA1c > 7% lab result and 4.5% of subjects discontinued metformin altogether.
FIGURE 1.
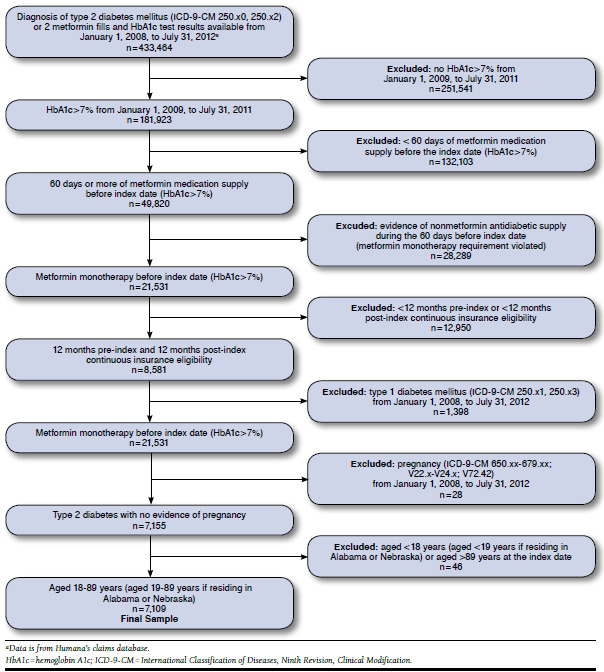
Sample Attrition Diagram
FIGURE 2.
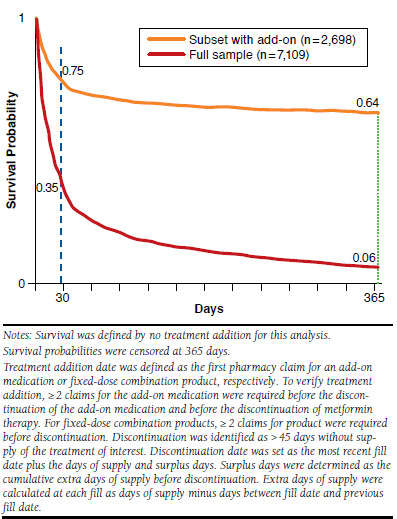
Kaplan-Meier Curves for Days to Treatment Addition for Full Sample and Subset with a Treatment Addition
TABLE 1.
Study Sample Characteristics
| Add-on n = 2,698 | No Add-on n = 4,411 | P Value | |
|---|---|---|---|
| Age, years, mean [SD] | 65.6 [11.4] | 67.5 [10.4] | < 0.001 |
| 18-44, % (n) | 5.3 (144) | 3.4 (148) | < 0.001 |
| 45-64, % (n) | 30.5 (822) | 25.4 (1,122) | |
| ≥ 65, % (n) | 64.2 (1,732) | 71.2 (3,141) | |
| Sex, % (n) | |||
| Male | 52.2 (1,409) | 50.6 (2,233) | 0.190 |
| Female | 47.8 (1,289) | 49.4 (2,178) | |
| Race/ethnicity, % (n)a | |||
| Non-Hispanic white | 62.2 (1,679) | 62.4 (2,752) | < 0.001 |
| Non-Hispanic black | 9.8 (265) | 13.2 (582) | |
| Hispanic | 0.0 (0) | 0.0 (0) | |
| Other/unknown | 28.0 (754) | 24.4 (1,077) | |
Note: Chi-square test was used to compare categorical variables, and t-test was used for for continuous age.
aRace/ethnicity data were only available for Medicare Advantage members. All commercially insured members in the sample were marked as “unknown.”
SD = standard deviation.
A second HbA1c was evaluated in the 4.5% of cases where metformin monotherapy was discontinued to determine glycemic control related to discontinuation. HbA1c related to metformin discontinuation was measured as the most recent HbA1c result before the metformin discontinuation date and after the index date. In cases of multiple HbA1c lab results on the same date, only the highest value result was included for analysis. In cases of no HbA1c result between the index date and metformin discontinuation date, the baseline HbA1c value at the index date was used. Of the 4.5% that discontinued metformin altogether with no other antidiabetic medication, none had evidence of improved glycemic control.
Most treatment additions (65.9%) occurred within the first month of the index lab result and the occurrence of add-on decreases as time progresses. The occurrence of add-on decreases as time progresses as 81.3% patients had add-on therapy within 90 days after index date. With only 38% of the sample showing evidence of treatment addition during the observation period, a median time to add-on for the full sample could not be determined and can only be described as greater than 365 days. When examining only the 38% of the sample with a treatment addition, the median number of days between index and add-on treatment date was 18 days and the average was 44 days.
The model found age was inversely related to treatment addition (OR = 0.77, 95% CI = 0.59-0.99 for age 45-64 vs. age 18-44; OR = 0.57, 95% CI = 0.43-0.74 for age 65-89 vs. age 18-44), whereas younger patients were more likely to receive add-on treatment to baseline metformin monotherapy (Table 2). Furthermore, the model indicated HbA1c at index was positively related to treatment addition (OR = 2.31, 95% CI = 2.00-2.67 for HbA1c > 8%-9% vs. > 7%-8%; OR = 2.88, 95% CI = 2.32-3.58 for > 9%-10% vs. > 7%-8%; and OR = 3.54, 95% CI = 2.92-4.28 for > 10% vs. > 7%-8%). The results suggest a greater likelihood of intensified treatment with poorer glycemic control (Table 2).
TABLE 2.
Logistic Regression Model Results to Evaluate the Relationship Between Add-on Treatment and Subject Characteristics
| Odds Ratio | 95% CI | P Value | |
|---|---|---|---|
| Age 18-44 years (reference) | 1.00 | – | – |
| Age 45-64 years | 0.77 | (0.59-0.99) | 0.052 |
| Age 65-89 years | 0.57 | (0.43-0.74) | < 0.001 |
| Sex | 1.01 | (0.91-1.11) | 0.906 |
| Index HbA1c > 7%-8% (reference) | 1.00 | – | – |
| Index HbA1c > 8%-9% | 2.31 | (2.00-2.67) | < 0.001 |
| Index HbA1c > 9%-10% | 2.88 | (2.32-3.58) | < 0.001 |
| Index HbA1c > 10% | 3.54 | (2.92-4.28) | < 0.001 |
| Hypertension | 1.56 | (1.28-1.89) | < 0.001 |
| Hyperlipidemia | 1.28 | (1.05-1.55) | 0.016 |
| Obesity | 1.21 | (1.08-1.36) | 0.001 |
| Cardiovascular | 1.30 | (1.16-1.45) | < 0.001 |
| Renal | 1.35 | (1.21-1.51) | < 0.001 |
| Ophthalmic | 1.11 | (1.00-1.24) | 0.056 |
Notes: AIC = 8959.31, Hosmer and Lemeshow χ2 = 10.73, P = 0.217.
ICD-9-CM codes for comorbidities: hypertension = 401.xx-405.xx; hyperlipidemia = all 272.xx; obesity = 278.00, 278.01; cardiovascular = 410.xx-417.xx, 420.xx-448.xx, 451.xx-459.xx, 707.xx, 785.4; renal = 580.xx-590.xx, 593.xx; Ophthalmic = 362.xx, 364.41, 364.42, 365.xx-366.xx, 377.xx. ICD-9CM codes in any position were evaluated.
AIC = Akaike information criterion; CI = confidence interval; HbA1c = glycated hemoglobin; ICD-9-CM = International Classification of Diseases, Ninth Revision, Clinical Modification.
Regarding the baseline comorbidities, evidence of ophthalmic disorder was not related to treatment addition (P = 0.056), but hypertension (OR = 1.56, 95% CI = 1.28-1.89), hyperlipidemia (OR = 1.28, 95% CI = 1.05-1.55), other cardiovascular disease (OR = 1.30, 95% CI = 1.16-1.45), obesity (OR = 1.21, 95% CI = 1.08-1.36), and renal disease (OR = 1.35, 95% CI = 1.21-1.51) were related to treatment addition (Table 2). The positive associations comorbid conditions and treatment addition suggests a greater likelihood to augment therapy for patients with a worse overall condition.
In order to better understand treatment for subjects remaining on metformin with no treatment addition, metformin dose pre- and post-index (HbA1c > 7%) for subjects remaining on metformin monotherapy, as well as for the overall sample was examined. The goal of this analysis was to examine if there was a greater tendency toward increased metformin dose as a therapeutic modification for those subjects with no add-on treatment. We found no evidence of systematic metformin dose increase when comparing the subjects remaining on metformin to the overall sample (+53 vs. +54 mg change).
Sensitivity Analyses
The results of each sensitivity analysis model are illustrated in Table 3. Samples of 7,087, 5,207, and 3,212 patients were identified for each of the 3 sensitivity analysis samples, respectively. The sensitivity analysis models found similar results to the main analysis model. Specifically, age was inversely related, and HbA1c was positively related, to add-on therapy. Upon review of all analyses, index HbA1c was the most important factor for determining treatment addition. In all samples, HbA1c > 8%-9% was associated with greater than 2 times the odds of add-on treatment (OR = 2.22, 95% CI = 1.92-2.56; OR = 2.09, 95% CI = 1.77-2.47; OR = 2.43, 95% CI = 1.94-3.04) compared with HbA1c > 7%-8%. HbA1c > 9%-10% was associated with greater than 2 and a half times the odds of add-on treatment (OR = 2.60, 95% CI = 2.09-3.24; OR = 2.64, 95% CI = 2.05-3.42; OR = 3.51, 95% CI = 2.35-5.25) compared with HbA1c > 7%-8% in all samples. HbA1c > 10% (> 86 mmol/mol) was associated with greater than 3 and a half times the odds of add-on treatment (OR = 3.73, 95% CI = 3.08-4.51; OR = 3.56, 95% CI = 2.87-4.43; OR = 3.58, 95% CI = 2.44-5.24) compared with HbA1c > 7%-8%. Although less important than HbA1c, age was a factor for determining treatment addition. The effect of age 65 and older compared with aged 18-44 years was evident in all sensitivity analysis samples, whereas the older age group had lower odds of treatment addition than the younger group (OR = 0.55, 95% CI = 0.43-0.72; OR = 0.53, 95% CI = 0.39-0.72; OR = 0.54, 95% CI = 0.35-0.85).
TABLE 3.
Sensitivity Analyses to Evaluate the Relationship Between Add-on Treatment and Subject Characteristics
| Analysis Number | Sensitivity Analysis 1 | Sensitivity Analysis 2 | Sensitivity Analysis 3 |
|---|---|---|---|
| Restriction | ≥ 90 Days Metformin Required Before Index HbA1c n = 7,087 | Acceptable Gap for Metformin Limited to 30 Days n = 5,207 | ≥ 0.8 PDC for Metformin Required Before Index HbA1c n = 3,212 |
| Add-on, n (%) | 2,682 (37.8) | 1,982 (38.1) | 1,333 (41.5) |
| No add-on, n (%) | 4,405 (62.2) | 3,225 (61.9) | 1,879 (58.5) |
| Predictors | OR (95% CI) | OR (95% CI) | OR (95% CI) |
| Age 45-64 yearsa | 0.75 (0.57-0.97)c | 0.71 (0.52-0.96)c | 0.69 (0.44-1.09) |
| Age 65-89 yearsa | 0.55 (0.43-0.72)e | 0.53 (0.39-0.72)e | 0.54 (0.35-0.85)d |
| Sex | 1.02 (0.92-1.12) | 1.00 (0.89-1.13) | 1.04 (0.90-1.20) |
| Index HbA1c > 8%-9%b | 2.22 (1.92-2.56)e | 2.09 (1.77-2.47)e | 2.43 (1.94-3.04)e |
| Index HbA1c > 9%-10%b | 2.60 (2.09-3.24)e | 2.64 (2.05-3.42)e | 3.51 (2.35-5.25)e |
| Index HbA1c > 10b | 3.73 (3.08-4.51)e | 3.56 (2.87-4.43)e | 3.58 (2.44-5.24)e |
| Hypertension | 1.53 (1.26-1.85)e | 1.63 (1.30-2.04)e | 1.37 (0.99-1.90) |
| Hyperlipidemia | 1.29 (1.06-1.57)c | 1.24 (0.98-1.55) | 1.07 (0.78-1.48) |
| Obesity | 1.22 (1.08-1.37)d | 1.25 (1.09-1.43)d | 1.20 (1.01-1.43)c |
| Cardiovascular | 1.30 (1.16-1.46)e | 1.37 (1.20-1.56)e | 1.12 (0.95-1.32) |
| Renal | 1.34 (1.20-1.50)e | 1.26 (1.11-1.44)d | 1.27 (1.08-1.49) |
| Ophthalmic | 1.11 (0.99-1.23) | 1.16 (1.02-1.32)c | 1.01 (0.86-1.17) |
Notes: AIC = 8959.31, Hosmer and Lemeshow χ2 = 10.73, P = 0.217.
ICD-9-CM codes for comorbidities: hypertension = 401.xx-405.xx; hyperlipidemia = all 272.xx; obesity = 278.00, 278.01; cardiovascular = 410.xx-417.xx, 420.xx-448.xx, 451.xx-459.xx, 707.xx, 785.4; renal = 580.xx-590.xx, 593.xx; and ophthalmic = 362.xx, 364.41, 364.42, 365.xx-366.xx, 377.xx. ICD-9CM codes in any position were evaluated.
aReference: age 18-44 years.
bReference: HbA1c > 7%-8%.
cModel parameter estimate significant at P < 0.05.
dModel parameter estimate significant at P < 0.01.
eModel parameter estimate significant at P < 0.001.
CI = confidence interval; HbA1c = glycated hemoglobin; ICD-9-CM = International Classification of Diseases, Ninth Revision, Clinical Modification; OR = odds ratio; PDC = proportion of days covered.
The most sensitive variables to sample size restriction were the comorbid conditions. Sensitivity analysis 1, like the main analysis, found a positive relationship between add-on and comorbidities hypertension, hyperlipidemia, obesity, other cardiovascular disease, and renal disease. Sensitivity analysis 2 reported similar relationships with comorbidities hypertension, obesity, other cardiovascular disease, and renal disease, but not hyperlipidemia. Additionally, sensitivity analysis 2 revealed a positive relationship between add-on and ophthalmic disorder. For sensitivity analysis 3, the only comorbidity with a statistically significant relationship with add-on therapy was obesity. Overall, comorbidities, as identified in the study, were less important for determining treatment addition and lacked statistically significant associations in the most conservative sample. Obesity was the only exception and was statistically significant in all samples (OR = 1.22, 95% CI = 1.08-1.37; OR = 1.25, 95% CI = 1.09-1.43; OR = 1.20, 95% CI = 1.01-1.43).
Discussion
Our findings were similar to previous studies, which identified HbA1c level, comorbidities, and younger age as predictors of treatment intensification; however, the current study is the first to observe these effects specifically in a metformin monotherapy treated population.16,17
We found that only slightly more than one third (38%) of the patients with suboptimal glycemic control (HbA1c > 7%) initiated an add-on therapy. It is possible and perhaps likely that patients and providers considered a higher threshold than 7% for HbA1c for determining that treatment addition was warranted. The results support that notion because higher HbA1c for the index lab result was positively related to the odds of an add-on treatment. In patients who did receive add-on treatment within 12 months following an abnormal HbA1c test result, nearly two thirds (65.9%) initiated add-on therapy within the first 30 days of the abnormal test and the proportion of patients with add-on therapy within 90 days of the abnormal test was 81.3%. The urgency of treatment addition for the patients with any add-on therapy is evidence that some patients and providers may have responded to the index HbA1c lab result by adding another antihyperglycemic treatment. While some of the patients receiving add-on therapy had HbA1c results between 7% to 8%, the odds of receiving add-on therapy were greater for patients with HbA1c above 8% to 9%, greater for patients with HbA1c above 9% to 10%, and even greater for patients with HbA1c above 10%.
Age was inversely related to odds for receiving an add-on treatment: younger subjects were more likely to receive an add-on treatment than their older counterparts, even when accounting for index HbA1c level and clinical characteristics. It is uncertain as to what exactly drives this age-related phenomenon. Older patients may have a relaxed HbA1c target for treatment depending on life expectancy and comorbidity complexity according to guidelines,18,19 but comorbidities, including renal disease and disorder, were associated with increased odds of receiving add-on treatment based on the current study’s results. Possibly a greater hesitation exists among providers to complicate the medication regimens of older patients, especially considering that treatment for T2DM is focused on reducing risk of long-term outcomes which may be more relevant to younger patients than to older patients.19 In addition, considerations related to medication burden or medication affordability might also influence providers’ and/or patients’ decisions to add a second antidiabetic medication.20
The primary finding of interest was the majority of cases did not result in an add-on treatment, but rather resulted in continued metformin use.21 In fact, fewer than half (approximately 38%) of study subjects received an add-on treatment after evidence of suboptimal glycemic control (HbA1c > 7%). The majority of subjects (57.5%) simply remained on metformin treatment through the observation period. In addition, metformin dose pre- and post-index (HbA1c > 7%) was examined to explore the data for evidence of clinical inertia. The change in dose was slightly lower for those remaining on metformin monotherapy than for the overall sample (+ 53 vs. + 54 mg change), but not meaningfully different. The results were not indicative of widespread application of increased metformin dose as a response to suboptimal glycemic control, as evidenced by HbA1c. In contrast, these results could be partially indicative of clinical inertia where treatment continues unchanged despite evidence that a treatment addition might be warranted.22 The results could also indicate, at least partially, that many patients and providers are sensitive to a HbA1c threshold higher than 7%.
Clinical inertial has been documented before, as Rodondi et al. (2006) identified clinical inertia in 33% of patients with suboptimal glycemic control regardless of treatment regimen during 2002-2003.16 While Rodondi et al. focused on patients residing in the northern California area of the United States, the current study included patients predominantly residing in the midwestern and southern United States and only included those treated with metformin monotherapy. The current study also examined the phenomenon in a more recent time period (2009-2011).
Future research should further investigate factors related to clinical inertia. Medication burden or medication affordability might specifically be examined with regards to the influence on providers’ willingness to add a second antidiabetic medication and the impact on patients’ follow-through with primary medication adherence. Although the current study evaluated HbA1c value as a factor for receiving an add-on treatment, there was no attempt to identify a threshold above 7%. The 7% threshold was set a priori based on clinical practice guidelines, but it is possible providers and patients in the real-world setting are using a higher level of HbA1c to prompt a treatment addition, especially for older patients. The considerations around balancing the risks and benefits of adding another medication to a patient’s regimen with the goal of reducing the risk of long-term clinical outcomes may be very different for older patients than for younger patients. Furthermore, future research should also consider the clinical and economic consequences of clinical inertia.
Limitations
This study has a number of limitations related to the design and use of claims data. First, a diagnosis of poly-cystic ovary syndrome was not identified for sample exclusion, so it is possible that the sample contained 1 or more patients treated for poly-cystic ovary syndrome rather than T2DM but it is not likely that many if any of these cases existed in the study sample. Second, we cannot rule out the possibility that some patients were benefiting from metformin monotherapy even though an HbA1c > 7% test result was observed. Some patients might have had HbA1c tests before the baseline year with results even greater than 7%, and a downward trend in HbA1c, if observed, was considered adequate achievement by the patient and his or her provider. Furthermore, the study design did not include observations of post-index HbA1c tests, so we cannot rule out the possibility that some patients had a downward trend in HbA1c post-index that was considered adequate achievement. The index date HbA1c was the first observed result above 7% after metformin monotherapy based on the claims data available, but the claims data do not necessarily provide a comprehensive picture of each patient’s medical history nor the treatment effectiveness after the first observed HbA1c > 7%. Third, the study required metformin monotherapy before an HbA1c > 7% in an attempt to isolate patients treated as recommended by guidelines, but physicians’ intentions were not known. Without a comprehensive picture of each patient’s medical history and treatment history, it is not clear if guide-lines-based treatment was appropriate for all study subjects. Finally, although the study clearly indicates that clinical inertia is a relatively common problem, the reasons for clinical inertia are not known and are beyond the scope of the current study.
Conclusions
Patients in this study with HbA1c levels higher than those recommended by guidelines did not appear to be receiving additional treatment as advised by leading diabetes associations. Several factors including older age, lower index HbA1c, and lack of evidence of certain comorbidities were associated with no additional treatments. Providing appropriate medication additions to metformin for patients not meeting HbA1c goals may help to avoid development of complications related to diabetes, but the considerations around balancing the risks and benefits of adding another medication to a patient’s regimen with the goal of reducing the risk of long-term clinical outcomes may be very different for older patients, for patients with HbA1c near goal, and for patients with certain comorbidities.
Acknowledgments
The authors thank Mary Costantino for writing and editorial assistance and Damion Nero and Cralen Davis for analytical assistance. Mary Costantino and Cralen Davis are employees of Comprehensive Health Insights. Damion Nero was previously an employee of Comprehensive Health Insights.
References
- 1. Danaei G, Singh GM, Paciorek CJ, et al. The global cardiovascular risk transition: associations of four metabolic risk factors with national income, urbanization, and Western diet in 1980 and 2008. Circulation. 2013;127(14):1493-502. Available at: http://www.ncbi.nlm.nih.gov/pmc/articles/PMC4181853/. Accessed December 7, 2015. [DOI] [PMC free article] [PubMed] [Google Scholar]
- 2. Whiting DR, Guariguata L, Weil C, Shaw J. IDF diabetes atlas: global estimates of the prevalence of diabetes for 2011 and 2030. Diabetes Res Clin Pract. 2011;94(3):311-21. Available at: http://www.diabetesresearchclinicalpractice.com/article/S0168-8227%2811%2900591-2/abstract. Accessed December 7, 2015. [DOI] [PubMed] [Google Scholar]
- 3. Centers for Disease Control and Prevention . National diabetes statistics report, 2014. Atlanta, GA: U.S. Department of Health and Human Services; 2014. Available at: http://www.cdc.gov/diabetes/pubs/statsreport14/nationaldiabetes-report-web.pdf. Accessed December 7, 2015.
- 4. Stratton IM, Adler AI, Neil HA, et al. Association of glycaemia with macrovascular and microvascular complications of type 2 diabetes (UKPDS 35): prospective observational study. BMJ. 2000;321(7258):405-12. [DOI] [PMC free article] [PubMed] [Google Scholar]
- 5. Holman RR, Paul SK, Bethel MA, Matthews DR, Neil HA. 10-year follow-up of intensive glucose control in type 2 diabetes. N Engl J Med. 2008;359(15):1577-89. [DOI] [PubMed] [Google Scholar]
- 6. Nichols GA, Joshua-Gotlib S, Parasuraman S. Glycemic control and risk of cardiovascular disease hospitalization and all-cause mortality. J Am Coll Cardiol. 2013;62(2):121-27. [DOI] [PubMed] [Google Scholar]
- 7. Smith SC Jr, Benjamin EJ, Bonow RO, et al. AHA/ACCF secondary prevention and risk reduction therapy for patients with coronary and other atherosclerotic vascular disease: 2011 update: a guideline from the American Heart Association and American College of Cardiology Foundation endorsed by the World Heart Federation and the Preventive Cardiovascular Nurses Association. J Am Coll Cardiol. 2011;58(23):2432-46. [DOI] [PubMed] [Google Scholar]
- 8. American Diabetes Association . Executive summary: Standards of medical care in diabetes—2012. Diabetes Care. 2012;35(Suppl 1):S4-S10. [DOI] [PMC free article] [PubMed] [Google Scholar]
- 9. Inzucchi SE, Bergenstal RM, Buse JB, et al. Management of hyperglycemia in type 2 diabetes: a patient-centered approach: position statement of the American Diabetes Association (ADA) and the European Association for the Study of Diabetes (EASD). Diabetes Care. 2012;35(6):1364-79. [DOI] [PMC free article] [PubMed] [Google Scholar]
- 10. Nguyen NT, Nguyen XM, Lane J, Wang P. Relationship between obesity and diabetes in a US adult population: findings from the National Health and Nutrition Examination Survey, 1999-2006. Obes Surg. 2011;21(3):351-55. [DOI] [PMC free article] [PubMed] [Google Scholar]
- 11. Alvarez Guisasola F, Mavros P, Nocea G, Alemao E, Alexander CM, Yin D. Glycaemic control among patients with type 2 diabetes mellitus in seven European countries: findings from the Real-Life Effectiveness and Care Patterns of Diabetes Management (RECAP-DM) study. Diabetes Obes Metab. 2008;10(Suppl 1):8-15. [DOI] [PubMed] [Google Scholar]
- 12. Yood MU, Lafata JE, Koro C, Wells KE, Pladevall M. Time to pharmacotherapy change in response to elevated HbA1c test results. Curr Med Res Opin. 2006;22(8):1567-74. [DOI] [PubMed] [Google Scholar]
- 13. Fu AZ, Qiu Y, Davies MJ, Radican L, Engel SS. Treatment intensification in patients with type 2 diabetes who failed metformin monotherapy. Diabetes Obes Metab. 2011;13(8):765-69. [DOI] [PubMed] [Google Scholar]
- 14. Khunti K, Wolden ML, Thorsted BL, Andersen M, Davies MJ. Clinical inertia in people with type 2 diabetes: a retrospective cohort study of more than 80,000 people. Diabetes Care. 2013;36(11):3411-17. [DOI] [PMC free article] [PubMed] [Google Scholar]
- 15. Karter AJ, Parker MM, Moffet HH, Ahmed AT, Schmittdiel JA, Selby JV. New prescription medication gaps: a comprehensive measure of adherence to new prescriptions. Health Serv Res. 2009;44(5 Pt 1):1640-61. Available at: http://www.ncbi.nlm.nih.gov/pmc/articles/PMC2754552/. Accessed December 7, 2015. [DOI] [PMC free article] [PubMed] [Google Scholar]
- 16. Rodondi N, Peng T, Karter AJ, et al. Therapy modifications in response to poorly controlled hypertension, dyslipidemia, and diabetes mellitus. Ann Intern Med. 2006;144(7):475-84. [DOI] [PMC free article] [PubMed] [Google Scholar]
- 17. McEwen LN, Bilik D, Johnson SL, et al. Predictors and impact of intensification of antihyperglycemic therapy in type 2 diabetes: translating research into action for diabetes (TRIAD). Diabetes Care. 2009;32(6):971-76. [DOI] [PMC free article] [PubMed] [Google Scholar]
- 18. Kirkman MS, Briscoe VJ, Clark N, et al. Diabetes in older adults. Diabetes Care. 2012;35(12):2650-64. [DOI] [PMC free article] [PubMed] [Google Scholar]
- 19. Kirkman MS, Briscoe VJ, Clark N, et al. Diabetes in older adults: a consensus report. J Am Geriatr Soc. 2012;60(12):2342-56. [DOI] [PMC free article] [PubMed] [Google Scholar]
- 20. Piette JD, Heisler M, Wagner TH. Problems paying out-of-pocket medication costs among older adults with diabetes. Diabetes Care. 2004;27(2):384-91. [DOI] [PubMed] [Google Scholar]
- 21. Cook CB, Ziemer DC, El-Kebbi IM, et al. Diabetes in urban African-Americans. XVI. Overcoming clinical inertia improves glycemic control in patients with type 2 diabetes. Diabetes Care. 1999;22(9):1494-500. [DOI] [PubMed] [Google Scholar]
- 22. Phillips LS, Branch WT, Cook CB, et al. Clinical inertia. Ann Intern Med. 2001;135(9):825-34. [DOI] [PubMed] [Google Scholar]